Genomes of two indigenous clams Anomalocardia flexuosa (Linnaeus, 1767) and Meretrix petechialis (Lamarck, 1818)
 and Meretrix petechialis (Lamarck, 1818)")
Background & Summary
Clams refer to the common name for several kinds of bivalve molluscs. The Veneridae family contains more than 700 described living species of bivalves or clams, and most of them are edible and exploited as food in different cultures around the world, including America, Asia and Europe (Huber, 2010)1. Clam digging activities, which refer to harvesting clams from below the surface of tidal sand or mud flats, also has long history in many places including Hong Kong. In the last century, clam digging in Hong Kong were mainly confined to villagers or recreational collection using hand tools on beaches during low tides for consumption or as a source of income. Nevertheless, clam digging activities have grown increasingly popular in recent years which threatens the clam populations and disturbs benthic biodiversity in some areas (Griffiths et al.; So et al.)2,3. Unlike many other places where sustainable clam digging practices, such as limiting the number of clams taken and/or temporary closure of clamming sites, Hong Kong does not have her own practices in the meantime due to the lack of information on the population structure of clams. As of to date, 12 genome assemblies in the Veneridae are available in NCBI (8 November 2024), including five chromosome-level genomes in the genera Mercenaria, Mysia, Ruditapes and Venus. Among the common clams that can be found in Hong Kong, such as that of Anomalocardia and Meretrix species which are the two frequently collected genera by local clam-diggers (So et al.)3, genomic resources are currently lacking which hinders our understanding of their connectivity at different geographical locations.
Here, utilizing PacBio HiFi long reads and Omni-C sequencing data, we present two chromosomal-level genomes of common clams in Hong Kong, Anomalocardia flexuosa and Meretrix petechialis. Together with transcriptome data from various tissues, we produce high-quality predicted gene models for the two clam species. These genome assemblies and transcriptome data provide valuable genomic resources for the understanding of genetic diversity and connectivity for future population genomics research in view of conserving local clam species and assessing the sustainability of clam digging activities.
Methods
Sample collection and high molecular weight DNA extraction
A. flexuosa and M. petechialis samples were collected in Shui Hau, Lantau Island, Hong Kong (22°13′14.2″N 113°55′09.0″E) on 6th July, 2023 and Yi O, Lantau Island, Hong Kong (22°13′58.4″N 113°51′02.0″E), on 28th August, 2022, respectively (Fig. 1A). Approximately 300 mg adductor muscle was used for high molecular weight (HMW) DNA extraction for both A. flexuosa and M. petechialis. For A. flexuosa, the tissue was first ground into powder with liquid nitrogen, from which HMW DNA was isolated by NucleoBond HMW DNA kit (Macherey-Nagel), following the manufacturer’s protocol. For M. petechialis, HMW DNA was extracted using MagAttract HMW DNA Kit (Qiagen), following the manufacturer’s instructions. The DNA samples were eluted with 120 µL of elution buffer (PacBio Cat. No. 101-633-500) and were subjected to quality check by the Qubit® Fluorometer, NanoDrop One Spectrophotometer, and overnight pulse-field gel electrophoresis.
 and Meretrix petechialis (Lamarck, 1818)")
(A) Pictures of A. flexuosa (left) and M. petechialis (right); (B) Statistics of the genome assembly generated in this study; (C) Hi-C contact map of the assembly A. flexuosa (left) and M. petechialis (right); (D).
PacBio library preparation and long-read sequencing
Prior to library preparation, approximately 5 µg of HMW DNA isolated from A. flexuosa and M. petechialis in 120 µL of elution buffer were transferred to a g-tube (Covaris Cat. No. 520079) for DNA shearing with 6 passes of centrifugation at 1,990 × g for 2 min. The fragment size of sheared DNA samples was assessed with overnight pulse-field gel electrophoresis. A SMRTbell library was constructed for both samples using the SMRTbell® prep kit 3.0 (PacBio Cat. No. 102-141-700), following the manufacturer’s instructions. Qubit® Fluorometer and overnight pulse-field gel electrophoresis were used to examine the quantity and quality of the SMRTbell libraries. Subsequently, the Sequel®II binding kit 3.2 (PacBio Cat. No. 102-194-100) was used for the final library preparation. Briefly, 3 µL of the SMRTbell library was mixed with 1.5 µL annealing buffer and 1.5 µL Sequel II Primer 3.2, and further incubated for 15 minutes in room temperature. Subsequently, a dilution step of Sequel II DNA polymerase 2.2 was carried out according to the manufacturer’s instructions, where 6 µL diluted polymerase was added to the SMRTbell mixture and incubated for 15 minutes in room temperature for polymerase binding, and followed by a purification step using SMRTbell® clean-up beads. The polymerase-bound complexes were eluted with 50 µL Sequel II Loading Buffer 3.2, which were then mixed with an addition of 67 µL Sequel II Loading Buffer 3.2 and 3 µL diluted internal DNA control to prepare a final loading library of 120 µL in volume. All mixing procedures during the SMRTbell library preparation and the final library preparation were performed with 200 µL wide bore tips (Rannin Cat No. 30389188) in 2 mL DNA LoBind® Tubes (Eppendorf Cat No. 022431048). 115 µL of the two final libraries were loaded at an on-plate concentration of 90 pM with diffusion loading mode, respectively. The sequencing was performed on the PacBio Sequel IIe system using circular consensus sequencing (CCS) sequencing mode for a 30-hour movie with 2-hour pre-extension to generate HiFi reads for each sample. One SMRT cell was used for sequencing for A. flexuosa and M. petechialis, respectively. Finally, 21.83 Gb and 30.58 Gb of Hifi reads were obtained for A. flexuosa and M. petechialis with average lengths of 8,017 bp and 10,729 bp and data coverages of 20X and 29X, respectively (Table 1).
Omni-C library preparation and sequencing
An Omni-C library was prepared for A. flexuosa and M. petechialis, respectively, using the Dovetail® Omni-C® Library Preparation Kit (Dovetail Cat. No. 21005), following the manufacturer’s instructions. Approximately 50 mg of flash-freezing powered tissue was used for crosslinking with the addition of formaldehyde in 1 mL 1X PBS for each sample, followed by nuclease digestion. The lysate samples were assessed by Qubit® Fluorometer and TapeStation D5000 ScreenTape and were proceeded with the library preparation protocol. After the final quality check with Qubit® Fluorometer and TapeStation D5000 ScreenTape, the Omni-C libraries were sent to Novogene Co. Ltd for sequencing on an Illumina HiSeq-PE150 platform, from which 60.4 Gb and 56.6 Gb Omni-C data were generated for A. flexuosa and M. petechialis, respectively (Table 1).
Transcriptome sequencing
Total RNA was isolated from various tissues including foot and adductor muscle, mantle, digestive gland, gill and gonad for A. flexuosa and foot, digestive gland, gill and gonad for M. petechialis, using the TRIzol™ Reagent (Invitrogen Cat No. 15596018), following the manufacturer’s protocol respectively. The RNA samples were subjected to quality control using NanoDrop One Spectrophotometer, and gel electrophoresis. The qualified samples were sent to Novogene Co. Ltd for polyA selected RNA sequencing library construction and 150 bp paired-end sequencing. A total of 31.7 Gb and 23.1 Gb transcriptome data were obtained from different tissue types of A. flexuosa and M. petechialis, respectively (Table 1).
Genome assembly and Gene model prediction
De novo genome assemblies of A. flexuosa and M. petechialis were first proceeded with Hifiasm (Cheng et al.)4 and then were processed with searching against the NT database with BLAST to remove possible contaminations using BlobTools (v1.1.1) (Laetsch & Blaxter)5. Subsequently, haplotypic duplications were removed according to the depth of HiFi reads using “purge_dups” (Guan et al.)6. Proximity ligation data from Omni-C were used to scaffold the assembly using YaHS (Zhou et al.)7 and manual checking using Juicebox (v1.1)8. The genomes were soft-masked by redmask (v0.0.2) (https://github.com/nextgenusfs/redmask) (Girgis et al.)9. The final genome assemblies of A. flexuosa and M. petechialis were 1.09 Gb and 1.04 Gb in size with 95.43% and 99.27% of the sequenced anchored into 19 chromosomes, and 391 and 195 gaps, respectively, which correspond to the kartotype (2n = 38) of Anomalocardia and Meretrix species (Fig. 1B-C; Tables 2, 3) (Lavander et al.; Park et al.)10,11. Both A. flexuosa and M. petechialis genomes were not only of high continuity, with scaffold N50 of 58.5 Mb and 53.5 Mb in 9 scaffolds, but also of high completeness after being assessed with Benchmarking Universal Single-Copy Orthologs (BUSCO, v5.5.0) using the “metazo_odb10” dataset (Manni et al.)12, which resulted in BUSCO scores of 94.4% (Complete and single-copy BUSCOs (S): 92.8%, Complete and duplicated BUSCOs (D): 1.6%, Fragmented BUSCOs (F): 3.7%, Missing BUSCOs (M): 1.9%) and 95.7% (S:93.2%, D:2.5%, F:2.7%, M:1.6%), respectively (Fig. 1B; Table 2).
For gene model prediction, RNA sequencing data were first processed using Trimmomatic (v0.39) (Bolger, Lohse & Usadel)13 with parameters “TruSeq. 3-PE.fa:2:30:10 SLIDINGWINDOW:4:5 LEADING:5 TRAILING:5 MINLEN:25” and kraken2 (v2. 0.8 with kraken2 database k2_standard_20210517)14 to remove the low quality and contaminated reads, and then aligned to the repeat soft-masked genome using Hisat215 to generate the bam file. A total of 389,399 Mollusca reference protein sequences were downloaded from NCBI on 25 March 2024 as protein hits, along with the RNA bam file, to perform genome annotation using Braker (v3.0.8)16 with default parameters. Briefly, RNA-Seq and protein hints were used to train GeneMark-ETP, from which the genes with high extrinsic evidence support were then used to train on AUGUSTUS. The predictions from AUGUSTUS and GeneMark-ETP were combined using TSEBRA to generate the final annotation files.
For A. flexuosa, the transcriptome assembled by stringtie (v2.2.1)17 contained 53,191 transcripts in a total of 131,817,025 bp with an average length of 2,478 bp and an N50 length of 4,030 bp. The completeness of the transcriptome was also assessed using the BUSCO “metazo_odb10” dataset (Manni et al.)12, reporting a BUSCO score of 98.1%. The assembled transcriptome was then used for gene model prediction. These data collectively generated 20,881 gene models, comprising 26,853 predicted protein-coding genes with average lengths of 580 amino acids (Fig. 1B; Table 2). The completeness of proteomes were also evaluated with BUSCO “metazo_odb10” dataset (Manni et al.)12, reporting BUSCO scores of 96.2% (Fig. 1B; Table 2). Protein-coding genes were mapped to the nr and swissprot databases using Diamond (v2.0.7)18 with the parameter ‘–evalue 1e-3–outfmt 6’ for functional annotation, and 97.56% of the protein-coding genes could be mapped to the database. The transcriptome data was mapped to gene modes using hisat215 with default parameters, 96.82% of genes are expressed in the transcriptome samples.
For M. petechialis, the transcriptome assembled by stringtie (v2.2.1)17 contained 28,098 transcripts in a total of 83,316,136 bp with an average length of 2,965 bp and an N50 length of 4,271 bp. The completeness of the transcriptome was also assessed using the BUSCO “metazo_odb10” dataset (Manni et al.)12, reporting a BUSCO score of 97.6%. The assembled transcriptome was then used for gene model prediction. These data collectively generated 20,084 gene models, comprising 25,196 predicted protein-coding genes with average lengths of 607 amino acids (Fig. 1B; Table 2). The completeness of proteomes were also evaluated with BUSCO “metazo_odb10” dataset (Manni et al.)12, reporting BUSCO scores of 98.3% (Fig. 1B; Table 2). Protein-coding genes were mapped to the nr and swissprot databases using Diamond (v2.0.7)18 with the parameter ‘–evalue 1e-3–outfmt 6’ for functional annotation, and 96.72% of the protein-coding genes could be mapped to the database. The transcriptome data was mapped to gene modes using hisat215 with default parameters, 95.96% of genes are expressed in the transcriptome samples.
Repetitive elements annotation
Transposable elements (TEs) of the two genome assemblies were annotated as previously described (Baril et al.)19 using the automated Earl Grey TE annotation pipeline (version 1.2, https://github.com/TobyBaril/EarlGrey) with “-r eukarya” to search the initial mask of known elements and other default parameters. Briefly, this pipeline first identified known TEs from Dfam with RBRM (release 3.2) and RepBase (v20181026). De novo TEs were then identified, and consensus boundaries were extended using an automated “BLAST, Extract, Extend’ process with 5 iterations and 1,000 flanking bases added in each round. Redundant sequences were removed from the consensus library before the genome assembly was annotated with the combined known and de novo TE libraries. Overlap and defragment annotations were removed prior to final TE quantification. A total of 338.3 Mb and 427.2 Mb of repeat contents were annotated from the genomes of A. flexuosa and M. petechialis, which account for 31.02% and 40.92% of the assembly, respectively (Fig. 2; Table 4). Of the classified TEs, LINE, DNA, and Rolling Circle contribute to the major proportions (Fig. 2), which are listed in Table 4. Repeat landscape plots of both A. flexuosa and M. petechialis revealed substantial increase of activities of LINE, DNA, and Rolling Circle and LTR, although a sharp recent decrease in repetitive element activities was observed in M. petechialis (Fig. 2). 19.36% and 26.65% of the repeat content were marked as unclassified for A. flexuosa and M. petechialis respectively. Therefore, we also run the Extensive de novo TE Annotator (EDTA)20 with parameters “–species others–threads 32–cds cds.fa–force 1–anno 1 “ for comparison. Despite fewer repetitive content was annotated by EDTA than earlGrey method in A. flexuosa (22.00%) and M. petechialis (31.15%), TIR still accounts for nearly half of the annotated repetitive elements annotated by either method (Tables 5, 6). Previous studies also identified the expansion and diversification of transposon elements in bivalve genomes (Farhat et al.; Martelossi et al.)21,22. Therefore, the genomes of A. flexuosa and M. petechialis may serve as valuable resources for further studies of genome evolution in Veneridae.
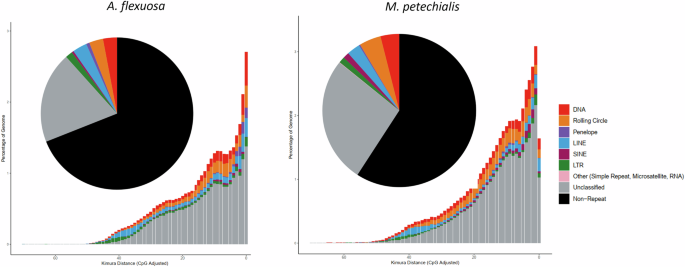
Pie chart and repeat landscape plot of repetitive elements of A. flexuosa (left) and M. petechialis (right).
Syntenic analyses
Macrosynteny analysis revealed a 1-to-1 pair relationship between the 19 pseudochromsomes of Cyclina sinensis23, A. flexuosa, M. petechialis and Mercenaria mercenaria21 using JCVI24 (Fig. 3), showing a conserved chromosome architecture between the four species, and the same chromosome number as in other Veneridae genomes. The full genome details downloaded from NCBI on 24 October 2024 are shown in Table 7.
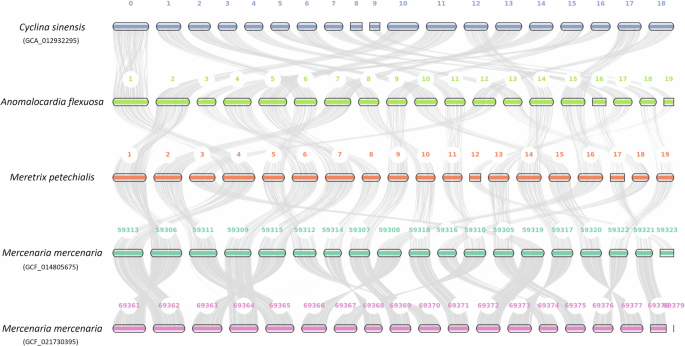
Macrosynteny plot of the 19 pseudochromosomes between Cyclina sinensis, A. flexuosa, M. petechialis and Mercenaria mercenaria (Mmer).
Data Records
The genome assemblies are in GenBank under accessions JBCAUM00000000025 (A. flexuosa) and JBCJFF00000000026 (M. petechialis). The raw reads generated in this study, including Transcriptome, Omni-C and PacBio HiFi data, have been deposited in the NCBI database under the SRA accession number SRP50250027 and SRP50217228 for A. flexuosa and M. petechialis, respectively. The genome, genome and repeat annotation files have been deposited and are publicly available in Figshare29 and CUHK Research Data Repository30.
Technical Validation
The pseudochromosomes of the final assemblies were validated by inspecting the Omni-C contact maps using Juicer tools (version 1.22.01) (Durand et al.)8. Briefly, Omni-C reads were mapped and aligned by BWA with parameters “mem -5SP -T0”, the parsing module of the pairtools pipeline was used to find ligation junctions with parameters “–min-mapq 40–walks-policy 5unique–max-inter-align-gap 30–nproc-in 8–nproc-out 8”. The parsed pairs were then sorted using pairtools sort with default parameters, PCR duplicate pairs were removed using pairtools dedup with parameters “–nproc-in 8 –nproc-out 8 –mark-dups”, the pairs file was split using pairtools split with default parameters and used to generate the contact matrix using juicertools and Juicebox (v1.11.08)8. Regarding the genome characteristics of the assembly, the k-mer count and histogram were generated at k = 21 from Omni-C reads using Jellyfish (v2.3.0) (Marçais & Kingsford)31 with the parameters “count -C -m 21 -s 1000000000 -t 10”, and the reads.histo was uploaded to GenomeScope to estimate genome heterozygosity, repeat content and size using default parameters (v2.0) (http://qb.cshl.edu/genomescope/genomescope2.0/) (Ranallo-Benavidez et al.)32. The resulting GenomeScope plots can be found in Fig. 4. Omni-C reads and PacBio HiFi reads were used to measure assembly completeness and consensus quality (QV) using Merqury (v1.3)33 with kmer 20, resulting in 75.3568% and 96.1486% kmer completeness for the Omni-C data and 57.149 and 62.1256 QV scores for the HiFi reads, corresponding to 99.999% and 99.9999% accuracy for A. flexuosa and M. petechialis, respectively. In addition, BlobTools (v1.1.1) assigned most of the assembled scaffolds that mapped to the NT database to the taxon Mollusca and scaffolds that assigned to other taxa such as Bacteroidota were removed (Laetsch & Blaxter)5 (Fig. 5).
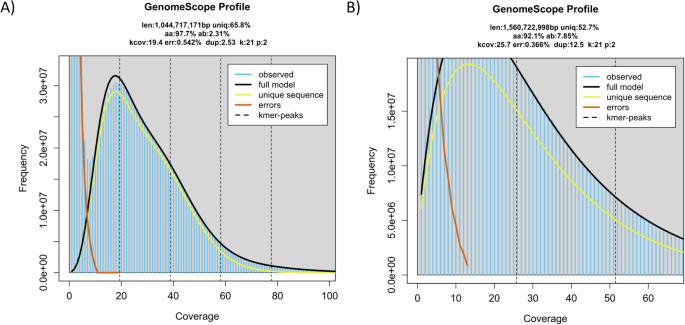
GenomeScope plots with the estimated genome size (K-mer = 21) of A. flexuosa (A) and M. petechialis (B).
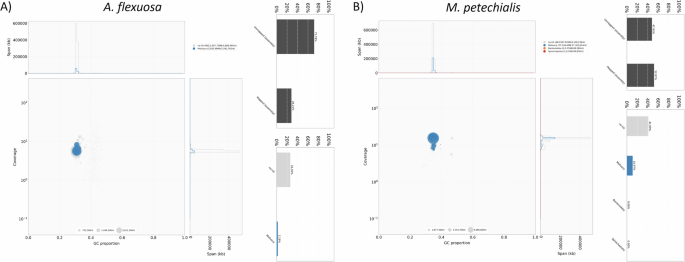
GC-coverage plots from BlobTools for genome assembly quality control and contaminants detection for A. flexuosa (A) and M. petechialis (B). The size of circles are proportional to the scaffold length. The upper bar plot shows the proportion of mapped and unmapped assembly to the NT database whereas the lower bar plot illustrates the distribution of the mapped assembly that are assigned to specific taxa.


Responses