Genomic survey of multidrug resistant Salmonella enterica serovar Minnesota clones in chicken products

Introduction
Non-typhoidal Salmonella (NTS) is recognized as the predominant foodborne bacterial pathogen. Each year, foodborne NTS is responsible for an estimated 93 million cases of gastroenteritis and 155,000 deaths worldwide1, contributing to ~4 million disability-adjusted life years2. In resource-limited regions and among immunocompromised individuals, extraintestinal or invasive NTS infections, often linked to specific serovars or phylogenetic clades, significantly contribute to the burden of the disease. Invasive cases can progress to life-threatening bloodstream infections, particularly problematic due to the increasing prevalence of antimicrobial resistance (AMR) in NTS3. This resistance can spread directly through human contact with AMR bacteria from livestock or indirectly via resistant bacteria contaminating environmental reservoirs such as water and soil, driven by the use of antimicrobials in agriculture4. Assessments of NTS antimicrobial susceptibility patterns over time indicate a concerning trend of moderate to high levels of resistance, including multidrug resistance5.
Salmonella serotype Minnesota (S. Minnesota) has recently emerged as a notable NTS serovar, exhibiting increased prevalence within poultry farming and related food products, such as chicken meat and eggs, in recent years. The prevalence of S. Minnesota rose following the introduction of a vaccine targeting Salmonella enterica serovar Enteritidis in 2003, which was the predominant Salmonella serovar in Brazilian poultry and exported chicken meat at that time6,7. Alongside vaccination, widespread antimicrobial use in animals is believed to have influenced these shifts8. The increased worldwide demand for animal protein is expected to double the antimicrobial usage in livestock in Brazil by 20309,10. Since Brazil serves as a major exporter of poultry to countries worldwide, numerous reports highlight the global dissemination and spread of S. Minnesota throughout food export chains.
The pathogenic mechanisms of S. Minnesota remain largely unknown, primarily due to its rarity and the limited number of studies focused on this serotype. Despite its infrequent isolation, several significant cases have been documented. First reported in the 1950s, a major outbreak of food poisoning resulted in over 500 clinical cases linked to the consumption of meat pies produced in a factory in Northamptonshire, United Kingdom. Since this initial report, isolations of S. Minnesota from clinical specimens have been infrequent. However, in 1985, an acute gastroenteritis outbreak occurred in a camp in Saudi Arabia11. a unique case involved a patient with Crohn’s disease who developed urosepsis caused by S. Minnesota without typical gastrointestinal symptoms. This highlighted the importance of considering NTS in immunocompromised patients presenting with severe infections12.
Whole genome sequencing, which provides a comprehensive view of genetic biomarkers, has been increasingly used in food surveillance and monitoring of bacterial contaminations13. Few studies have employed the fine resolution of whole genome sequencing to elucidate the diversity and genetic profiles of S. Minnesota. These studies have shown the persistence of S. Minnesota across food chains in various countries and the emergence of clones over the past few decades10. Furthermore, these studies have highlighted the role of IncI1 or IncC (formerly known as IncA/C14) plasmids as the main drivers of resistance genes against third-generation cephalosporins, tetracyclines, and/or sulfonamides by carrying respective genes such as blaCMY-2, tet(A) and sul215,16,17,18,19,20. Some studies have also reported the occurrence of mcr genes, which confer resistance against the last-resort antimicrobial colistin, suggesting an ongoing rise in resistance levels for clinically important antimicrobials21,22. Despite these significant insights, studies conducted at the country level often had limited sample sizes, making it difficult to capture the population dynamics of outbreaks and the regional epidemiology of multidrug resistant clones.
In this study, we conducted a large-scale population genomics surveillance to systematically investigate the diversity and dynamics of S. Minnesota collected from the chicken production chain across the Kingdom of Saudi Arabia (KSA), a country known for its substantial poultry production, consumption, import, and export activities. The poultry industry in KSA has experienced significant growth in recent years. Poultry is a staple protein source, with individuals consuming an average of 47 kg of chicken meat and 120 eggs annually23. In 2020 alone, the country produced 900,000 metric tons of chicken meat, meeting 60% of domestic demand24. Saudi Arabia imported 652,283 metric tons of chicken meat and related products that year, with Brazil being the primary supplier, accounting for 72% (467,522 metric tons) of these imports25,26. In human settings, Salmonella infection (salmonellosis) is one of the most frequently reported bacterial infectious diseases, with around 2000 cases annually27,28. The depth and breadth of the collection allowed us to fully elucidate the population dynamics of S. Minnesota clones and identify key factors driving the emergence and spread of antimicrobial-resistant clones on epidemiological time scales.
Results
Population structure of S. Minnesota indicates emergence of multiple clones
We analyzed whole genome sequencing data for 259 S. Minnesota isolates recovered from food production chain in the KSA (see “Methods”). In this collection, 87 isolates were of Brazilian origin, while the rest were isolated from local Saudi food products (Supplementary Table S1). To contextualize the genomes, we also retrieved genomes with available metadata from public repositories of global collections. This included 507 genomes from 21 countries in four continents (Fig. S1A). The population structure consisting of isolates sequenced in the current study (internal isolates) and external global genomes revealed 14 clones (BAPS groups), eleven of which consisted of more than ten isolates, ranging from 20 to 140 genomes. We designated these as BAPS1–11 (Fig. S1A). Except for two BAPS clones (BAPS1 and BAPS4), the other clones included isolates from human sources (Fig. S1A, Fig. 1). Isolates from different continents were unevenly distributed across the major clones. BAPS 8–11 consisted exclusively of strains from America and Europe, while internal genomes fell into six BAPS clones, specifically BAPS1–6 (Fig. S1A, Fig. 1). BAPS1 and BAPS6 clones included Saudi and Brazilian isolates, respectively. Isolates within these clones had lower genetic diversity and included more recent samples compared to those in the combined BAPS7–11 clones. These differences were statistically significant, with p-values from the Wilcoxon signed-rank test of <0.05 for genetic diversity and <0.01 for sample age (Fig. S1B, Fig. 1). Brazilian isolates co-occurred in BAPS2–4 clones with Saudi samples. The phylogenetic tree of the clones, reconstructed from the average genetic distance of genomes in different BAPS clones, revealed that clones containing Saudi isolates directly descended from the older BAPS6 clone. This clone included Brazilian and European isolates and, in turn, descended from even older North American and European BAPS clones. The genome of the only human isolate recovered from a salmonellosis infection in our study, i.e., K_287, showed genetic identity with the food isolates and grouped with genomes in BAPS2 clone. The most closely related genomes from a poultry source in this BAPS clone to the human isolate were K_099 and K_258, recovered from fresh chicken in Dammam (11 and 14 SNPs distant, respectively), as well as the K_017 isolate from fresh chicken in Riyadh (19 SNPs distant); all shared the same brand code (supplier), suggesting potential routes of bacterial food contamination into human settings.

The boxplots for age show the distribution of the years of collection for the strains in each BAPS clone. The boxplots for diversity correspond to pairwise SNP distances between genomes within each clone. The boxplots for the count (#) of virulence and resistance genes show genes identified by the genomic pipelines. Internal genomes are those sequenced as part of this study, while external genomes are from public databases (EnteroBase/PathogenDetection). The * and *** signs on the each panel denote significance levels of <0.05 and <0.01, respectively, based on a one-sided Wilcoxon ranked test. These levels indicate the significance of differences in age, diversity, virulence factor gene count, and resistance gene count for isolates in the BAPS1–6 clones (which included isolates from the current study) compared to the other BAPS clones (BAPS7–11).
Recent clones emerged and expanded concurrently at both national and global levels
We examined the dynamics and expansion of the Saudi clones (BAPS1–4) across the country (Fig. 2A). All clones formed concurrently over the course of 5–7.5 years (Fig. 2A). The inferred substitution rates for the clones averaged between 7.5 × 10⁻⁷ and 2.5 × 10⁻⁶ substitutions per site per year, which overlaps with the substitution rates of Salmonella enterica serovar Typhimurium, ranging from 1.9 × 10⁻⁷ to 1.49 × 10⁻⁶ substitutions per site per year29,30,31 (Fig. 2A). All clones exhibited a growing population trend since their formation, with slight variations. For BAPS1, BAPS3, and BAPS4, the population growth either slowed down or reversed, while for the most recent BAPS2 clone, the population continued to expand (Fig. 2B). The clone also exhibited other signatures of rapid expansion, characterized by the relatively large effective population size and the high substitution rate (Fig. 2A). We extended the analysis for BAPS2 and BAPS4 clones to include genomes from other countries. Phylodynamic trees confirmed the formation of Saudi clones between 2010 and 2014 (Fig. 2C). In BAPS2, Brazilian samples served as ancestors to the Saudi clone and other clones in the UK and South Africa. The Saudi clade served as the ancestor for a lineage from the UAE, a country that imports poultry meat from Saudi Arabia26, demonstrating the global and regional distribution of the clone (Fig. 2C). The BAPS4 tree indicates the concurrent expansion of two Saudi clades: one originating from a Brazilian clade in 2011 (95% HPD: 2010–2014) and the other from a Portuguese lineage in 2008 (95% HPD: 2006–2011) (Fig. 2C). The Brazilian clade gave rise to multiple lineages in the UK, South Africa, and Germany, indicating the global circulation of the BAPS4 clones.

A Estimated clone age for the four clones containing Saudi isolates. Error bars represent the 95% highest posterior density (HPD). B Skyline growth plot depicting changes in population size over time. The shaded region indicates the 95% confidence interval. C Phylodynamic trees for BAPS2 and BAPS4 clones, including genomes from the global collection. Internal branch colors denote the inferred status of the country of origin, with horizontal red bars indicating the 95% HPD.
Global and local transmissions of S. Minnesota isolates
We computed the genetic relatedness between isolates from different cities by reconstructing genealogies of the sampled genomes under the assumption that ancestors and descendants were sampled concurrently. By using a sequence identity cutoff of 10 SNPs, which corresponds to transmission within ~2 years, we reconstructed the maximum parsimony genealogy for genomes within each BAPS clone (Fig. 3). For BAPS1–4 clones, we identified 7, 4, 2, and 9 transmission sub-networks, respectively (Fig. 3). Most sub-networks comprised isolates from different cities or countries, showing the extent of global and local spread of the strains. Specifically, the mixing of isolates within the same city from different suppliers was noted in the BAPS1 clone (Fig. 3). At the inter-country level, BAPS3 and BAPS4 clones included networks with isolates from South Africa/Portugal and South Africa/Brazil, respectively. In the BAPS4 clone, Brazilian isolates, retrieved as part of the current study, served as ancestors for the Saudi isolates in 7 out of 9 sub-networks, likely through single or multiple import events (Fig. 3). These findings validate the results of the phylodynamic analysis, highlighting the simultaneous local and global circulation of S. Minnesota isolates within the food chain. This pattern is also consistent with the dual role of Saudi Arabia’s poultry industry as both an importer and exporter of poultry, as well as a hub for local production (see “Discussion”).

Each node represents one genome, and edges indicate genetic relatedness, with a distance cutoff of 10 SNPs for defining the networks. External (global) isolates are colored gray. All external isolates in the BAPS4 clone originated from South Africa. White nodes within BAPS4 represent Brazilian isolates from the current study. Colored squares denote different brand codes/suppliers for isolates from the same city. Each color represents a distinct brand code/supplier.
Increased prevalence of antimicrobial resistance and virulence genes in recent S. Minnesota clones
Despite lower genetic diversity, clones with Saudi isolates (BAPS1–5) and the clone with internal Brazilian samples (BAPS6) exhibited a significantly higher number of AMR and virulence factor genes compared to older clones, i.e., BAPS7–11 (p-value from Wilcoxon signed-rank test <0.01) (Fig. 1). For BAPS1–6, genomes harbored an average of 7.5 (95% CI: 5.7–9.4) resistance genes, while for older BAPS clones, genomes harbored an average of 0.5 (95% CI: 0.1–2.4) resistance genes. Similarly, genomes in BAPS1–6 carried an average of 148 unique virulence genes (95% CI: 142–155), while those in older BAPS clones, had a lower average of 132 unique virulence genes (95% CI: 123–138), indicating enhaced virulence and resistance levels for the recent clones.
Diversity of genes and genomic backgrounds of antimicrobial resistance genes
We explored S. Minnesota genomes and pinpointed a range of acquired genes conferring resistance to various antimicrobials. These included aminoglycosides (aac6’, aac3, ant3”, aph3’, aadA and aph4), β-lactams (blaTEM blaCTX-M and blaCMY-2), tetracyclines (tetA, tetB, and tetD), polymyxins (mcr1 and mcr9), florfenicol (floR and cmlA), macrolides (cat, lnuF, and mphA), fluoroquinolones (qnrB), and sulfonamides (sul) (Supplementary Table S1). The incidence of the genes was previously reported in multiple studies15,32,33 (Fig. 4A). The mcr genes were observed independently in six isolates from BAPS2, BAPS3, and BAPS4 on small genomic fragments (Fig. 4). We utilized long-read sequencing data to explore the genomic context of the resistance genes. Among the 23 genes identified, six were found on plasmids and seven on both plasmid and chromosomal genomic contexts. The ESBL gene, blaCTX-M, was present on multiple plasmid backgrounds. The higher frequency of resistance genes in BAPS1–6 is due to the presence of a range of plasmid-borne genes for aminoglycosides, β-lactams, tetracycline, florfenicol, fluoroquinolone, and sulfonamide resistance (Fig. 4A). In the recent clones (BAPS1–6) containing samples from collection under study, genomes in BAPS1 clone had a significantly higher content of resistance genes than the other clones (p-value from one-sided Wilcoxon test <0.05). This is due to the presence of plasmid-borne aminoglycoside modifying ant3” and efflux pump floR genes in a higher number of isolates, compared with other clones (p value proportion test <0.01) (Fig. 4A). Despite the diversity of resistance genes, only a few appeared to be significantly linked to the resistance phenotype. For three classes of antimicrobials—aminoglycosides, β-lactams, and macrolides—eight, three, and four resistance genes were identified, respectively (Fig. S2A). The most significant effects for aminoglycosides were observed for the aminoglycoside N-acetyltransferase aac3 and the aminoglycoside O-phosphotransferase aph4 gene, with odds ratios significantly greater than one (Fig. S2A, S2B). Both genes were plasmid-borne, accounting for 76% and 73% of the total resistance, respectively. Although the ant3” gene also had a significant effect, it was smaller and found on both IncC plasmids and chromosomes (Fig. S2A). For β-lactam resistance genes, the blaCMY-2 gene, present in 90% of the isolates, was strongly associated with the ampicillin resistance phenotype, accounting for 80% of the observed resistance. Its association with tazobactam resistance was modest but statistically significant (odds ratio 2.3, resistance detection rate: 90%) (Fig. S2A, S2B). The plasmid-borne blaCTX-M gene, present in 20% of isolates, had a modest significant effect on tazobactam resistance. For macrolides, the erm and mphA genes, present in 2% and 3% of genomes, respectively, were significantly associated with azithromycin resistance (95% confidence interval of odds ratio was bigger than one), although they accounted for less than 30% of the resistance phenotype (Fig. S2A, S2B, S2C).
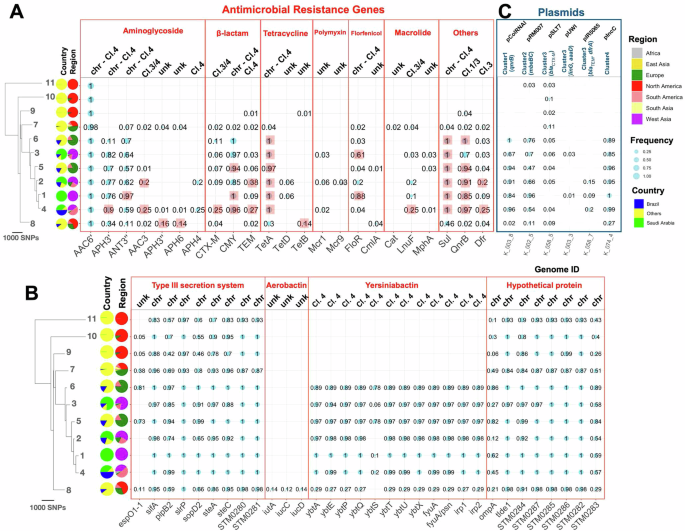
A Antimicrobial resistance genes, B virulence factor genes that are variably present in the clones, and C plasmids across the BAPS clones. Bubble sizes correspond to relative frequency, with numbers indicating relative frequencies within each clone. The tree is the same as in Fig. 1. For the detection of virulence factor genes and antimicrobial resistance genes, SRST2 pipeline with a threshold of 90% for identity and coverage was used. The shaded squares in (A) indicate the genes that were significantly overrepresented in each clone compared to other clones, as determined by a one-sided proportion test with a significance level of 0.01. For plasmids in (C), short reads for each strain were mapped against one of the plasmid backbones from each cluster presented in Fig. S3A, using a cutoff of 90% coverage to determine the presence of the plasmid. Genome IDs on the x-axis in (C) correspond to the isolate from which the reference plasmid genome was obtained. For IncC plasmid, the shortest IncC plasmid backbone in the population was used as reference. The labels “chr” and “Cl.” denote “chromosomal” and “cluster” indicating the genomic context of the gene on chromosomal or plasmid, respectively. “Unk” denotes “unknown,” indicating cases where the genomic context could not be resolved due to either the absence of the genome in the collection or fragmented contigs.
Diversity of virulence factor genes in S. Minnesota clones
Our results reveal that S. Minnesota genomes contained 213 distinct virulence genes, of which 88 genes were in the accessory genome, i.e., they were present in less than 99% of genomes. Among these genes, 37 were distributed variably across the clones (Fisher’s test p < 0.05), suggesting the evolution of different pathogenicity mechanisms in the S. Minnesota clones. These genes included nine encoding components of the type III secretion system (T3SS) and eight less well-characterized genes, found on the chromosome (Fig. 4B). All the variably present T3SS genes were effector proteins (Fig. 4B), which, upon introduction across bacterial and host membranes, can disrupt host functions34. Siderophore gene clusters of aerobactin and yersiniabactin were present exclusively in distinct clades. Aerobactin genes iutA and iucCD occurred in the BAPS8 clones, while genes encoding the yersiniabactin operon (fyuA, irp12, ybtAEPQSTUX) were found in more recent clones (ybtS became detectable once the identity threshold was lowered to 0.6) (Fig. 4B). The siderophore genes common to other S. Kentucky and APEC (Avian Pathogenic Escherichia coli) plasmids, including iutA, iucABCD, sitABCD, etsABC, iss, and iroBCDEN35, were observed only in isolates from BAPS1–6 clones, conferring these clones a higher virulence gene content than the other clones.
S. Minnesota isolates contained a diversity of plasmids carrying antimicrobial resistance genes
We next characterized the plasmids by extracting all genomic fragments with known replicons from the assemblies generated from hybrid assembly. This analysis yielded 39 plasmid fragments, which were grouped into four clusters based on their sequence identity (see “Methods”) (Fig. S3A). Cluster 2 contained 3 Kb pRM plasmids, which included the plasmid mobilization genes mbeBC, necessary for plasmid transfer with the help of a conjugational plasmid, as well as a hypothetical protein (Fig. S3A, S3B). These plasmids were more frequently found in the recent BAPS1–6 clones (47–96%), significantly higher than in the ancestral BAPS clones (Fig. 4C). Cluster 1 contained 3 Kb pColRNAI (Col(pHAD28)) plasmids, which carried the quinolone resistance efflux pump gene qnrB1 (Fig. S3C). This plasmid was present in most isolates (67–100%) of the emerging BAPS1 to 6 clones and was absent in the ancestral BAPS clones (Fig. 4C). Cluster 3 included diverse plasmids, among which three carried resistance genes. The small pUWI plasmid (55 Kbp) harbored linG, an integron-associated gene cassette with an aminoglycoside adenyltransferase gene aadA2, which encodes a nucleotidyltransferase found in S. enterica, conferring resistance to lincosamide (Fig. S3D). Another plasmid in this cluster, a small pIR plasmid (55 Kbp) reported in Klebsiella pneumoniae strains, carried β-lactam resistance gene blaTEM and trimethoprim resistance gene dfrA (Fig. S3D). Lastly, we identified a PSLT7 plasmid carrying the ESBL gene blaCTX-M-8, which harbored conjugation ability due to the presence of all transfer operon genes (Tra) (Fig. S3D). These AMR-linked plasmids in cluster 3 were present at low frequencies in BAPS1–4 clones (1–18%) (Fig. 4C) and were sporadically acquired by lineages, which potentially leads to the emergence of novel clones with higher resistance levels from existing clones.
The genomic configuration of IncC plasmids shows characteristics of mosaic plasmids with resistance and virulence genes
Cluster 4 included 200 Kb IncC plasmids that are large, low-copy, and frequently contain resistance genes36. These plasmids showed mosaic structures with regions encoding both resistance and virulence genes, contributing to the higher resistance and virulence content in the recent clones (e.g., BAPS1–6) (Figs. S3A and 5). Long-read sequencing data revealed that the largest IncC plasmid contained a virulence island composed of siderophore genes, including yersiniabactin ybt, irp, and fyu genes. Resistance genes were scattered across the plasmid backbone, with most confined to a small region, as reported before (Fig. 5A)36. Six AMR genes were identified on the plasmid: tet(A), aadA, and sul were clustered together, while blaCMY-2, aph(3), and the ESBL blaCTX-M-8 were inserted separately into the plasmid backbone (Fig. 5A). The plasmid contained only some transfer (tra) locus genes, such as traH and traF, which might confer partial conjugative ability. Alignment with conjugative IncC plasmids from other Salmonella serovars (ST548 isolates Crie-F1017 and Crie-F1252), which are well-studied incompatibility group plasmids in Salmonella37, confirmed the absence of several tra genes, suggesting conjugation may not be an inherent feature of these IncC plasmids.
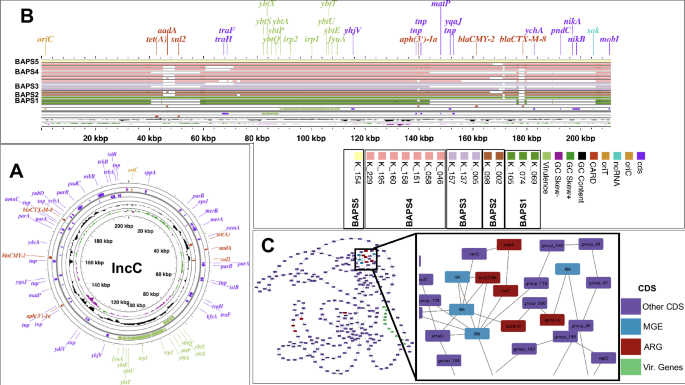
A Genomic map of the largest IncC plasmid (from isolate K_153) identified in the long-read sequencing data. B Linearized IncC plasmid with alignment of all IncC plasmids against the plasmid in (A). The bands for other plasmids are ordered from top to bottom and from left to right as indicated in the caption. Horizontal bars represent matches of 90% identity. Each color for the horizontal bars corresponds to the BAPS clones from which the plasmid was isolated. C Pangenome graph of IncC plasmids from 16 aligned IncC plasmids. Nodes and edges represent genes and their colocation within the same genomic context. Mobile genetic elements (MGE)s linked with resistance genes are colored blue.
Genomic rearrangements of resistance genes on IncC plasmid backbones
IncC plasmids exhibited a variety of configurations of resistance genes across different isolates. Among the 300 genes found in the plasmid fragments, 172 showed variable presence: 122 genes were present in 15% to less than 95% of genomes, and 50 genes were found in less than 15% of strains. Of these, 64 genes had functional annotations, including 25 mobile genetic elements and nine AMR genes. Regions containing resistance genes in IncC plasmids from strains in BAPS1–5 clones displayed various rearrangements, as shown by multiple alignments of plasmid fragments (Fig. 5B). In one plasmid (from isolate K_074), these changes resulted in the complete loss of resistance genes (Fig. 5B). Further alignment at the gene-level also revealed rearrangements in the plasmid backbone due to mobilization of resistance genes, sometimes leading to inversion of entire virulence islands (Fig. S4). The variation in gene order among plasmids within the same clone suggests that structural changes and recombination of plasmids occur concurrently with clonal expansion. The reconstructed synteny (pangenome) graph, where nodes represent genes and edges represent gene order (neighborhood), confirmed these findings. Resistance genes were predominantly situated in a highly interconnected part of the network, indicating numerous genomic rearrangements (Fig. 5C). In contrast, virulence genes had a consistent gene order across plasmids (Fig. 5C), suggesting that the genomic diversity of IncC plasmids in expanding clones is driven by the acquisition and loss of resistance genes.
Discussion
We present the genomic analysis of a nationwide collection of S. Minnesota in the poultry chain and revealed the population structure and diversity. Our results showed the emergence of new clones with local and global distributions, formed over the past 10 years. The epidemiology of the clones expanding both regionally and globally aligns with the import, export, and domestic production patterns of poultry meat, within Saudi Arabia. In 2020, Saudi Arabia produced 60% of its domestic poultry meat demand26. Brazil remained the largest exporter of poultry meat to the country, while the UAE and other GCC countries were the main importers26. The presence of countries like South Africa and the UK, which are not direct importers or exporters of poultry meat from Saudi Arabia, in the transmission network suggests that the dissemination of S. Minnesota is facilitated by global poultry meat production and trade chains, beyond direct country-to-country or within-country exchanges.
Our study examines the largest collection of S. Minnesota in a consistent sampling framework and hence yielded accurate estimates of population parameters. Previous population genomics studies in the UK and Brazil on S. Minnesota traced the contamination to Brazil and showed a recent emergence of S. Minnesota clades10,38. A study on a smaller collection of S. Minnesota in the UK traced the formation of S. Minnesota clades in the early 2000s, around the time of the introduction of the S. Enteritidis vaccine in Brazilian poultry in 200310. Isolates from the UK from this study grouped with BAPS2 isolates, showing epidemiological links between the two collections. Our study also reports genetic relatedness between isolates from human and food sources, although only one human sample was included. This potential link warrants a long-term surveillance study in both the animal and human sectors to assess whether the emergence of novel clades in food chains could pose a significant risk to human health.
Within the emerging clones, we observed multiple AMR genes, occuraing on different genomic contexts. This diversity highlights multiple evolutionary pathways for resistance, which are driven by widespread horizontal gene transfer and strong selective pressures from antimicrobial use in the poultry sector, leading to the persistence of these genes in the emerging clones39. Our analysis also identified a range of virulence genes, which may enhance invasion and adaptation in the primary host or the endurance of the strains in the environment, such as sopD in desiccation tolerance40. While the virulence mechanisms in S. Minnesota are not fully understood, the acquisition of a range of the iron chelator genes, identified in our study, may facilitates Salmonella colonization and virulence in poultry, as previously observed in S. Heidelberg and S. Kentucky41,42.
Our results underscore the key role of IncC plasmids in the recent evolution of S. Minnesota clones by providing a high-resolution population map of IncC plasmids. IncC plasmids pose a significant public health threat due to their broad host range and prevalence in animal, human, and environment36,43. The emergence of IncC plasmids in these reservoirs within enteric bacteria is associated with antimicrobial use in the agricultural sector44. Recent experimental research has shown that rearrangement of IncC plasmids in AMR-encoding regions may occur in lab strains during the plasmid transfer process, potentially enhancing the fitness of these strains45,46,47. The occurrence of different configurations of IncC plasmids within and between clones suggests that plasmid recombination may serve as an adaptive mechanism in S. Minnesota in response to strong antimicrobial therapy in naturally occurring strains. Serovar switching and the emergence of new clones and lineages have been ongoing in Salmonella populations over the past decades, attributed to multiple factors, including vaccines and antimicrobial treatments13. The variational presence of resistance genes of IncC plasmids, which co-occur with virulence genes on the same mosaic plasmid, may drive the rise of novel clones within the S. Minnesota serovar with enhanced resistance and virulence ability.
Despite the breadth of the study, we highlight some limitations. Firstly, our collection mostly included multidrug-resistant strains. Although this allowed us to identify multiple drug resistance genes in depth, we could not assess the extent to which the emergence of new clones is driven by the selection for resistant strains. Moreover, the scarcity of samples from human sources prevented us from obtaining a full picture of the implication of the animal strains in human settings. Expanding the scope to include a broader collection, encompassing susceptible strains, will help determine whether the broader population structure of S. Minnesota remains consistent with our findings. Future studies may also adopt the One Health approach, examining human, food, and animal isolates within a unified consistent framework, to provide a comprehensive view of the diversification, virulence, and survivability of S. Minnesota. Such studies will also enable the estimation of key epidemiological parameters, including the rate at which the AMR genes and multidrug resistant strains are introduced from food products into human settings. These insights are essential for effectively treating, managing, and preventing illnesses in both human and animal sectors48.
Methods
Ethical approval
The study received ethical approval from the Institutional Biosafety and Bioethics Committee (IBEC) of King Abdullah University of Science and Technology (No. 22IBEC046) and the Institutional Review Board (IRB) of the General Administration of Research and Studies, Ministry of Health, Saudi Arabia (No. 23-23 M).
Sample collection and isolation
Between 2020 and 2022, the Microbiology Reference Laboratory at the Saudi Food and Drug Authority (SFDA) received 859 Salmonella isolates from chicken product samples, including both processed and unprocessed meat. This collection was part of several monitoring and surveillance programs conducted in accordance with the sampling guidelines outlined in the World Health Organization guidelines49. A total of 259 isolates were identified as S. Minnesota, while the remaining isolates were from other Salmonella serovars. Among these, 172 isolates originated from domestically produced poultry samples obtained from various supermarkets across Saudi Arabia, while the remaining 87 isolates were sourced from imported poultry products from Brazil. Isolates were retrieved from 17 suppliers (brand code). This study also included a single S. Minnesota isolate recovered from a patient admitted with clinical Salmonellosis to a hospital in Jeddah, Saudi Arabia. Informed consent was obtained from the participant prior to sample collection.
Isolation and preliminary identification of Salmonella from chicken meat samples were carried out according to ISO 6579-1:2017/Amd 1:2020 (International Organization for Standardization, Geneva, Switzerland) standards50 in certified SFDA-affiliated laboratories. This isolation method included mixing the food samples (25 g of chicken) with a pre-enrichment medium (Buffered Peptone Water), followed by several other steps for Salmonella spp. detection. Upon receipt of positive bacterial isolates at the reference SFDA laboratory from the labs, we conducted confirmatory identification using Matrix-assisted laser desorption/ionization-time of flight. Isolates were also subjected to Salmonella real-time PCR 7500 using the MicroSEQ™ Salmonella spp. detection kit (Thermo Fisher, United States) in food. Furthermore, we conducted serotyping to confirm the accuracy of the isolates using the Kauffman-White scheme. Slide agglutination tests were performed with commercially available mono- and poly-O group Salmonella antisera (A, B, C, D, E; Remel, Europe Ltd., United Kingdom). After confirmation, the isolates were preserved in our Biobank for subsequent analyses.
Antimicrobial susceptibility testing
The antimicrobial susceptibility testing for all S. Minnesota isolates was conducted using the microbroth dilution method with the Sensititre EUVSEC3 panel manufactured by TREK Diagnostic Systems (Thermo Fisher Scientific). Inoculation and incubation procedures followed the manufacturer’s guidelines. The panel included 15 antimicrobials from various classes: aminoglycosides (amikacin, gentamicin), penicillins (ampicillin), macrolides (azithromycin), cephalosporins (cefotaxime, ceftazidime), carbapenems (meropenem), quinolones (ciprofloxacin, nalidixic acid), polymyxins (colistin), phenicols (chloramphenicol), tetracyclines (tetracycline), glycylcyclines (tigecycline), and folate pathway inhibitors (trimethoprim, sulfamethoxazole). These antimicrobials are included in European antimicrobial surveillance programs, particularly the European Committee on Antimicrobial Susceptibility Testing. Escherichia coli ATCC 25922 served as the quality control reference strain. Minimum inhibitory concentrations (MICs) for each antimicrobial were interpreted according to Clinical and Laboratory Standards Institute (CLSI) guidelines51. For streptomycin, azithromycin, and cefoxitin, National Antimicrobial Resistance Monitoring System (NARMS) guidelines were applied due to the absence of CLSI interpretative breakpoints. Tigecycline interpretation followed FDA criteria, as no CLSI or NARMS breakpoints were available52.
DNA extraction and whole genome sequencing with short-read sequencing
Genomic DNA was extracted using the DNeasy Power Soil kit following the manufacturer’s instructions (Qiagen, CA, United States). The purity of genomic DNA was assessed by measuring the A260/A280 ratio (target ≥1.8) using the QIAxpert system (Qiagen, CA, United States), and DNA concentration was quantified with the Qubit system (Qubit™ fluorometer, Invitrogen, CA, USA) according to the manufacturer’s protocol. Libraries were prepared using the Nextera XT DNA sample preparation kit and the Nextera XT Index Kits (Illumina, Inc., San Diego, CA, United States). Following index PCR, samples were purified with 45 μl of Agencourt AMPure XP magnetic beads at a sample to beads ratio of 3:2 (Beckman Coulter, Brea, CA, United States), normalized based on Qubit quantification, and pooled. Subsequently, libraries were sequenced in a 250 bp paired-end-read format using the Illumina NovaSeq 6000 kit with 5% PhiX control (Illumina Inc., San Diego, CA, United States), following the manufacturer’s instructions.
Short-read sequencing data analysis
Sequence read quality control and assembly quality assessment were conducted using fastQC v.0.11.3 (http://www.bioinformatics.babraham.ac.uk/projects/fastqc/) and Trimmomatic v.0.36 software. Short reads underwent de novo assembly using the Unicycler v0.5.0 pipeline (https://github.com/rrwick/Unicycler) with default parameters. Contigs shorter than 200 bp were excluded from the assemblies. We employed srst2 v0.2.0 (www.github.com/katholt/srst2)53 with a sequence similarity and coverage threshold of 90% to analyze assemblies against the PlasmidFinder (v2.1.1)54, VFDB (v6.0)55, and CARD (v3.2.8)56 databases for detecting plasmid replicons, resistance and virulence genes, respectively. Resistance genes were confirmed with AMRFinderPlus (V.3.11.11)57. We evaluated the odds ratio of resistance phenotype associated with the presence of each resistance gene using the odds-ratio function from the Epitools package (v0.5.10.1) in R. Resistance mutations were identified using staramr v0.7.1 (https://github.com/phac-nml/staramr). To reconstruct the pangenome, assemblies were annotated using Prokka v1.14.558. The annotated assemblies were then analyzed using Panaroo (v1.3.4) with default parameters to recosctruct the pangenome59. For phylogenetic analysis, reads were aligned to the reference genome of S. Minnesota (accession number: CP017720.1) using the Snippy pipeline (https://github.com/tseemann/snippy) with default settings. The FastTree package (version 2.1) was used with its default settings and the Generalized Time-Reversible model for nucleotide evolution to construct an approximately maximum-likelihood phylogenetic tree from the Single Nucleotide Polymorphism (SNP) alignment of the core genomes60.
Contextualization of the samples
To contextualize our collection, we retrieved all available genomic data as of February 21, 2024, from EnteroBase (www.enterobase.warwick.ac.uk)61 and Pathogen Detection Databases (www.ncbi.nlm.nih.gov/pathogens). After removing duplicates and excluding data with insufficient metadata on country and date of isolation, we curated a dataset comprising short-read sequencing data from 507 isolates. These short-read sequences were aligned to the reference genome as previously described. We calculated pairwise SNP distances between strains and performed hierarchical clustering using the BAPS method44, as implemented in R62, with one round of iteration to identify clusters within the dataset (Only isolates with dates of isolation were included). We reconstructed the minimum spanning tree for the BAPS groups by first computing the average pairwise SNP distance between genomes in different BAPS groups and then using the average distance matrix between BAPS clones as input for the neighbor-joining tree function in the ape package (V.5.0)63. The information of the retrieved genomes is provided in Supplementary Table S1.
Phylodynamics analysis
We conducted phylodynamic analyses to estimate the epidemiological parameters for the BAPS clones containing isolates from the current study (BAPS clones 1–4). We extracted Saudi genomes and mapped the short reads against a local reference genome for each BAPS clone. The local reference genome was constructed by concatenating the genomic contigs of the genome with the best assembly statistics (i.e., highest N50). After mapping the short reads, we extracted SNP sites from the multiple alignment of genomes and removed hypervariable regions using Gubbins (v3.3.1)64 with five iterations.
The resulting alignment was used for phylogeographic diffusion analysis with BEAST (v2.0) [45]. We employed the MASCOT (Marginal Approximation of the Structured Coalescent) tool, which is integrated into the BEAST package and uses a structured coalescent approximation65,66 to infer ancestral migration histories. This method is commonly applied to quantify the geographic spread of pathogens between cities by leveraging both sample locations and sequence data. We used the city of isolation as a discrete state for each taxon. For the prior model, we used a constant population size model with a uniform distribution for the clock rate. We opted for a symmetric model with a uniform distribution for the discrete trait (i.e., city of isolation)67.
We ran the Markov chain Monte Carlo (MCMC) chains for 108 iterations and assessed the convergence of the chains by ensuring that the effective sample size (ESS) for key parameters exceeded 200. We removed the first 10% of trees as the burn-in. The remaining trees were merged using the TreeAnnotator tool included in the package, and the mean and 95% highest posterior density (HPD) intervals for key epidemiological parameters were extracted from the output file. We extracted substitution rates and ages for the BAPS clone trees. For examining the population size changes over time, we fitted a nonparametric growth model to sample population sizes on the dated phylogenetic tree for the BAPS1–4 clones. We therefore used the skygrowth.mcmc function and visualized the results with the plot function within the skygrowth package (v0.3.1)68.
To examine the global dissemination of BAPS2, BAPS3, and BAPS4 clones, which included genomes from both Saudi and non-Saudi sources, we conducted the discrete-state BEAST analysis using the country of isolation as the geographic state and we used the same prior models and parameters as above. Convergence was successfully achieved for the BAPS2 and BAPS4 clones but not for BAPS3. We used TreeAnnotator to generate dated phylogenetic tree and visualized the results with the ggtree package (v3.8.2) in R69.
Transmission analysis
We reconstructed networks of potential recent transmission events among strains within each BAPS clone using the R package adegenet (V.1.3-1)70. The tool inferred maximum likelihood networks based on pairwise SNP distances between samples, while considering their isolation dates. To compute these distances, we took the SNP alignment for each BAPS clone after removing hypervariable sites, as detailed above. Subsequently, we utilized the distdna tool in the ape package in R with default parameters for each BAPS clone. We then fed the distance matrix and dates of isolations into the seqTrack function in the adegenet package. For defining the networks, we applied a cutoff of 10 SNPs, which, based on the estimated recent substitution rate of the core genome of S. Minnesota (detailed in the Results), corresponds to SNPs accumulated over ~5 years. The resulting networks were visualized with the igraph library in R.
Long-read sequencing and plasmidome analysis
We performed third-generation long-read sequencing to recover full plasmid fragments. For library preparation, we utilized 96-plex Rapid Barcoding Kits to enable efficient multiplexing. The concentration and purity of DNA were determined using Qubit HS dsDNA kits and spectrophotometry at 260/280 nm. Libraries for sequencing various isolates were prepared, multiplexed using 96-plex Rabid Barcoding Kits, and loaded onto MinION flow cells (Oxford Nanopore Technologies) for a 48-h run following the manufacturer’s protocol. Subsequently, hybrid assembly was performed from short and long read sequencing data with Unicycler using the conservative mode to reconstruct the plasmid genomic fragments, which were examined and verified using Bandage (v0.9.0) [48]. Annotation of the assemblies to identify potential plasmids was conducted using Prokka, and the plasmid pan-genome was reconstructed using Panaroo59. To visualize the network, Cytoscape (v3.10.1) was employed (available at https://cytoscape.org). Plasmids were visualized and annotated using the Proksee portal and its built-in tools (www.proksee.ca)71. Gene-level alignment and visualizations were performed using the pyGenomeViz (v1.0.0) package in Python (https://github.com/moshi4/pyGenomeViz). The assembled genomic fragments for the plasmids were then analyzed for the presence of complete origin of replication sequences, virulence factor genes, and AMR genes with blast searches against the aforementioned databases.
To cluster plasmid fragments, we extracted all plasmid genomic fragments containing a known plasmid replicon and then computed sequence similarity using an alignment-free approach. We therefore generated k-mers of size 50 for each plasmid. Subsequently, we constructed a distance matrix and computed pairwise Jaccard distances, defined as (1-,{|intersection; of; kmers|}/{|union; of; kmers|}), between all plasmid fragments. Using fviz_nbclust in R, we employed k-means clustering and identified five clusters as the optimal number, i.e., the number that maximized the within-cluster sum of squares, with the elbow method. Upon further inspection, two highly similar plasmid sequence clusters were merged to yield final four clusters, which were characterized. To obtain the phylogenetic distribution of plasmid in the entire S. Minnesota population, we mapped the short reads for the strains against the representative plasmid fragment from each cluster using Snippy, as detailed above, and used the cut-off of 90% coverage for detection of the plasmid. For further annotation, we searched the NCBI nucleotide BLAST database for similar sequences in the public repository that matched our plasmids.
Statistical significance tests
To evaluate the significance of the ratio differences, the one-way proportion test was conducted in R. The one-way Wilcoxon signed-rank and Fisher’s exact tests were employed to determine the significance of mean and distribution differences, respectively. For comparing the significance of various parameters derived from the Bayesian analysis, the 95% credible intervals (HPD) were examined, representing the shortest range encompassing 95% of the probability density.


Responses