Global atmospheric distribution of microplastics with evidence of low oceanic emissions

Introduction
Plastic, which was invented by Belgian chemist Leo Hendrik Baekeland in 1907, revolutionized the materials industry: it emerged as a superior alternative to metals and biological materials in the interest of resource conservation1. However, serious concern has been expressed about the exponential growth in plastic consumption. Since World War II, more than 8300 Tg (million tons) of plastic have been manufactured, with the annual production having increased exponentially from under 2 Tg/year in 1950 to 390 Tg/year in 20212,3. Around 60% of plastics have been discarded in the environment4. By 2016, among these plastic pollutants, approximately 6.5–27% consisted of microplastics, defined as plastic particles <5 mm5. These tiny particles can enter the atmosphere from aquatic and terrestrial sources, contributing to the global plastics cycle6. Since the first observation of microplastics in the atmosphere conducted in 20157, these particles have been detected at various locations, with concentrations decreasing from densely populated to remote areas. Atmospheric microplastics are believed not only to have a potential impact on climate8 but also pose a threat to the human respiratory and digestive system9. Once they enter the bloodstream, they can infiltrate the circulatory system, triggering heart attacks and strokes10. Additionally, they can affect other organs through oxidative stress, inflammation, and immune dysfunction. They also alter the biochemical and energy metabolism, impair cell proliferation, and disrupt microbial metabolic pathways. They affect organ development and are a source of carcinogenicity11. Therefore, a better understanding of microplastic sources with accurate estimations of atmospheric emission fluxes and global transport is crucial as a prerequisite for the implementation of monitoring and control measures of microplastic wastes.
Until now, the establishment of emission inventories of microplastics has faced major challenges, mainly due to the large differences (up to 4 orders of magnitude) in the estimation of the fluxes from the ocean6,12,13,14,15. In 2020, Allen et al. discovered that the ocean emits microplastics in the atmosphere16. Initially, model inversions assumed high fluxes from the oceans relative to the continental sources (i.e., road sources and dust sources from agriculture, bare soils, landfills, residential activities, etc.)6,13,14. For microplastic particles smaller than 70 μm, Brahney et al. and Evangeliou et al. infer from model inversions global oceanic microplastic emission fluxes of approximately 8.6 and 2.4 Tg/year, respectively6,13. These estimates were based on the deposition values measured in remote areas of the western United States, with a relatively wide confidence interval ranging from 0 to 22 Tg/year. According to both studies, more than 93% of global atmospheric microplastics are emitted by the oceans. Considering the same particle size range, Fu et al. formulated a model inversion based on available worldwide observations14. This recent study led to considerably lower ocean emissions of the order of ~0.17 Tg/year.
Recently, an increasing number of physical sea–air transfer mechanistic studies inferred that the earlier ocean emissions of microplastics were formerly overestimated. Yang et al. performed an analysis of the microplastic transfer between seawater and air based on laboratory simulations of sea spray aerosol formation12. They concluded from a bottom-up calculation that the global ocean emissions of microplastic particles smaller than 70 μm amount for only ~8 × 10⁻⁴ Tg/year, which is four orders of magnitude lower than the estimates from the first models. Subsequently, a growing amount of bottom-up research studies have revealed that the ability of sea spray to transfer microplastics to the atmosphere was substantially lower than initially estimated. Harb et al.17 and Shaw et al.18 reported transfer rates of ~2 × 10⁻⁶ Tg/year for microplastic particles with diameters smaller than 10 μm and ~0.1 Tg/year for those smaller than 200,000 μm, respectively. Additionally, through the analysis of the maximum potential for sea spray aerosol to carry microplastics, and through theoretical calculations of sea–air transfer mechanisms, Yang et al. constrained the oceanic emission flux of microplastic particles smaller than 70 μm to account for <0.01 Tg/year15. This study compared different reported oceanic emission fluxes and concluded that the estimates by Yang et al. and by Harb et al. (i.e., sub-70 μm microplastic particles sources of ~8 × 10⁻⁴ Tg/year and sub-10 μm particles sources of ~2 × 10⁻⁶ Tg/year), are consistent with physical mechanisms.
In short, there is a substantial discrepancy between the model inversions and the calculations based on physical mechanisms. However, the results from physical mechanism calculations seem to align more closely with observations of lower ocean emissions of atmospheric microplastics. Therefore, we adopt the low oceanic emission rates as derived in the bottom-up mechanistic approach12 of Yang et al. to simulate the global distribution of atmospheric concentrations of microplastic particles with our global atmospheric model. We examine the spatial dispersion of microplastics across geographical areas and investigate their distribution at various altitudes. We compare the model concentrations with field observations to validate the low ocean emissions adopted in our modeling study.
Results
Global distribution of microplastics in the atmosphere
We use the three-dimensional MOZART-4 model to simulate the global distribution of microplastics and to assess the importance of long-range transport of the particles. We assume the major source of microplastics to be continental emissions (~10 Tg/year) with a relatively insignificant source from the ocean (~8 × 10⁻⁴ Tg/year). These particles are grouped in 6 size bins with diameters centered at 0.5, 1.5, 5, 10, 35, and 70 μm. The simulations are performed over a 2-year period with the global dynamics representative of the years 2013 and 2014. The smaller particles (0.5–10 μm) are assumed to be in the form of quasi-spherical debris, while the larger particles (35–70 μm) are in the form of elongated fibers. This particular model setting is referred to as the base model. Since fibers settle more slowly than spherical particles of an equivalent diameter (defined as the diameter of a sphere having the same volume as a particle with any shape), they are expected to reside longer in the air and are transported over longer distances19.
Figure 1a, b show the simulated horizontal distributions of the near-surface mass densities of the total microplastic particles with equivalent diameter ranged from 0.5 to 70 μm. Spatial distributions for each individual size bin are shown in Figs. S1 and S2 of the Supplementary Information. The mass concentration of microplastic particles varies by 3 orders of magnitude across the different geographical regions, ranging from ~8 × 10⁻³ to 2 μg/m3, with the smallest particles (0.5 μm) being the most numerous and most uniformly distributed. Additionally, the concentrations of microplastics are observed to be higher above the land than above the ocean. Elevated concentrations of microplastic particles are notably present in areas with high populations, including the southeastern United States, the Mediterranean, the Middle East, the Indian peninsula, and southeastern Asia. As shown in Fig. 1a, the highest concentrations of microplastic particles are found near the surface around 30°N latitude, where the population density is highest20. A similar result was obtained by Brahney et al.6.

a. Horizontal distribution (base case) of mass density (μg/m3) for sub-70 μm microplastic particles in the near-surface layer of the model (altitude of 0–50 km). b Vertical and latitudinal distribution (base case) of zonal mean mass density for sub-70 μm microplastic particles. Similar plots for each size bin are provided in Figs. S2 and S3. c, d Percentage difference in the mass concentrations for particles represented in the base versus the spheres case, for the same conditions as for (a) and (b). The percentage difference is expressed as (base−spheres)/base.
The fact that the smallest particles included in the model (diameter <1.5 μm) exhibit a more horizontally uniform distribution than the larger particles emphasizes the size dependence of atmospheric dispersion of microplastics. Particles with equivalent diameters ranging between 5 and 10 μm are present primarily over continents and in offshore regions, while particles within diameters ranging between 35 and 70 μm tend to remain closer to their emission sources (Fig. S2e and f). In other words, as the atmospheric settling velocity of particles (see the “Methods” section) is strongly size-dependent, the large microplastic particles are more rapidly deposited on the surface in the vicinity of their sources, while the smallest particles are more likely to be transported globally.
Our model also provides a first insight into the vertical dispersion of microplastic particles in the atmosphere (Fig. 1b). In general, microplastic particle concentrations decrease as the altitude increases. Figure S3 shows that, within the altitude range of 0–32 km, microplastic particles with diameters of 0.5–1.5 μm are vertically dispersed more uniformly relative to the larger-size particles, exhibiting higher concentrations at high altitudes. At high altitudes, the concentrations are highest near the equator, with the smaller particles displaying higher mass concentrations compared to larger microplastic particles. Interestingly, a large number of particles with a diameter of 70 μm reach the 15 km altitude. This indicates that even the largest particles are carried to the tropical upper troposphere by strong upwelling motions and convective activity. When accounting for particles with diameters smaller than 70 μm, our model simulations indicate that ~0.03 Tg of microplastics are suspended in the atmosphere. The atmospheric burden of microplastics for each of the 0.5–70 μm size bins is provided in Table S3.
Finally, in order to assess the effect of particle shape on the distribution and deposition of microplastics, we performed an additional model simulation in which all particles are assumed to be spherical debris. We refer to this particular model setting as spheres. We show in Fig. 1c and d the differences between the two model cases. When the large particles are represented as fibers rather than spheres, an enhanced number of them are lifted to nearly 20 km altitude and are transported to the ocean, especially to the Arctic region. Yang et al.’s experiment found that fibers are difficult to release from seawater into the atmosphere12, yet a significant amount of microplastic fibers have been detected in offshore air20,21,22. Our model shows that the total atmospheric burden of particles is higher, and the number of particles transported from the continents to the oceans is larger when these particles are assumed fibers rather than spheres.
Atmospheric microplastic size distribution
To properly compare the model results with actual observations, the particle size range (1–5000 μm) of microplastics provided by our model (0.5–70 μm) needs to be harmonized with the size ranges of the observed particles. Since different instruments used for these measurements are characterized by different detection limits of particle sizes, they capture different fractions of the particles’ size distribution. For example, detection thresholds of FTIR, Raman, and SEM-EDX instruments, usually in the range 1–100 μm23, can be very different. As a result, significant discrepancies exist between the microplastics’ number densities measured by these different instruments, even at identical locations. Therefore, the concentrations derived by the model, which cover the particles with a limited size range from 0.5 to 70 μm, cannot be directly compared with the measurements that cover the particles with sizes in the wider range of 1–5000 μm.
Observed atmospheric microplastic abundances are conventionally reported in number densities (number of microplastic particles per cubic meter of air, MP/m3). Through examining data reported in the literature for suspended particles20,21,22,24,25,26,27,28,29,30,31,32,33,34,35,36,37,38,39,40,41,42,43, it is found that the number density of the microplastics decreases with the size of the particles following a logarithmic rule. Since the larger particles tend to settle more rapidly than the smaller particles, the size distributions of deposited and suspended particles are different. The size distributions reported here only address suspended microplastics and do not include information on the particles deposited on the surface. We deduce a probability density of microplastic particles for the atmosphere as a function of the size of the particles based on the literature. Most observation sites (28 out of 49) have reported size distributions based on the largest dimension of the microplastic particles, without considering their specific shapes. A relation was derived from the data at the midpoints of each size bin interval to obtain the probability distribution curve44,45 shown in Fig. 2. The uncertainties of the fitted parameters were derived from the standard errors of the covariance matrix obtained during the nonlinear least-squares fitting process.

Values obtained by summarizing the size distribution of atmospheric suspended microplastics across different size bins, as observed at the locations indicated on the right side of the figure20,21,22,24,25,26,27,28,29,30,31,32,33,34,35,36,37,38,39,40,41,42,43. Each bin is represented by horizontal lines in the figure, with the dots indicating the midpoint of each bin.
With the high correlation (R2 ~ 0.7) found in Fig. 2, the proposed relation provides a good representation of the size distribution for atmospheric microplastics. Since the adopted relation is based on global suspended microplastic data from 49 locations, encompassing varying shapes and including remote, rural, and urban areas, it is possible to estimate the concentrations of microplastics at different sizes from the concentration derived at a specific size interval using this function. This greatly facilitates comparisons between measurements performed worldwide by different devices with varying detection size limits. Here, we refer to this function as the number-based size distribution of atmospheric microplastics (NSDAM). NSDAM is used to extrapolate the calculated concentrations of microplastic particles with the 0.5–70 μm size range to the concentrations of particles observed in all the size ranges covered by the respective instruments. This extrapolation is then used to evaluate our model results.
Model evaluation
We evaluate our calculated airborne microplastic number concentrations with available observations. Using this NSDAM, we extrapolate the modeled concentrations of 0.5–70 μm microplastics to the sizes that are detected by the instruments but are not explicitly accounted for by the model16,20,21,22,24,25,26,27,28,29,30,31,32,33,34,35,36,37,38,39,40,41,42,43,46,47,48,49,50,51,52,53,54,55,56,57,58,59,60,61,62,63,64,65,66,67,68,69,70,71,72,73,74,75,76,77,78,79,80,81,82,83. The observations of microplastic particles covering similar size ranges often differ by three orders of magnitude, even if they are conducted in the same city (e.g., Beijing26,46 and Shanghai24,25,26). Therefore, in our analysis, differences between the observed and modeled data within three orders of magnitude are considered to be acceptable. Our simulations agree surprisingly well with most of the 146 observations, even at an elevation up to 3.5 km42. Two point-by-point comparisons between the observations and the modeled values are shown in Fig. 3a. The mean fractional bias (MFB) is 80%, and the Pearson correlation coefficient (PCC) is 0.8 (see Eqs. (3) and (4)), indicating that our model results are consistent with the reported observations at a large number of sites. Relative to the previously global microplastic models6,13 by Brahney et al. and Evangeliou et al. the agreement found in our model is enhanced. Fu et al.’s inverse model fit the observations well, even though their concentration data points differ from the observations within three orders of magnitude14. However, since their model is based on an inverse approach using observations, it naturally aligns more closely with the observed data. Therefore, in comparison with other studies, our compiled emissions inventory derived from a bottom-up analysis (see the “Methods” section) appears to match observed concentrations relatively well.

a Kernel density estimation. b Scatter plot of model versus observation. Modeled concentrations are fitted to the observed size range according to NSDAM. The colored line represents the line of best fit using an orthogonal regression. The graph refers to 146 data points [MP/m3 or μg/m3]16,20,21,22,24,25,26,27,28,29,30,31,32,33,34,35,36,37,38,39,40,41,42,43,46,47,48,49,50,51,52,53,54,55,56,57,58,59,60,61,62,63,64,65,66,67,68,69,70,71,72,73,74,75,76,77,78,79,80,81,82,83.
Surface deposition of microplastics
We now investigate the impact of microplastic pollution at the Earth’s surface in various regions of the world by computing the global distribution of the particle’s deposition rates. The geographical distribution of the deposition rate (expressed here in mass) is shown in Fig. S5. The highest deposition rate occurs in Eastern North America, Europe, and Southeast Asia. More details are provided in Table S1.
The difference between the emission (see geographical distribution in Fig. S6) and deposition rates, which represents the net exchanges (in mass) of microplastics at the surface, is shown in Fig. 4. This figure highlights that, with our assumptions, the continents, and particularly the densely populated areas, are generally a source of atmospheric microplastics, while the oceans represent a sink. The largest sinks are in the coastal regions since, due to their limited buoyancy, the largest and heaviest microplastic particles predominantly settle in offshore areas. Smaller and lighter particles can be carried to more distant regions. As a result, coastal areas experience a higher rate of microplastic sedimentation compared to open oceans. Furthermore, the oceans in the northern hemisphere are subjected to greater microplastic sedimentation than those in the southern hemisphere.

The net exchange rate represents the difference between the surface emission and deposition rates.
The deposition of microplastic particles in polar regions represents a growing concern. Our model suggests that 5 × 10⁻⁵ and 8 × 10⁻⁸ Tg/year of microplastic particles with diameters of 0.5–1.5 and 5–70 μm are deposited on the surface of Antarctica, respectively. In the Arctic ice-covered areas, where the extent of both sea ice and land ice sheet reached its maximum in the year 2002, the deposition of 0.5–1.5 and 5–70 μm microplastic particles amounts to 9 × 10⁻⁴ and 3 × 10⁻² Tg/year, respectively. The relatively high deposition rate in the Arctic compared to Antarctica is likely due to the proximity of the emission sources (Europe, North America) and to the presence of human settlements in high-latitude regions of the Northern Hemisphere, where direct microplastic emissions occur in significant quantities. In Antarctica, a continent distant from human settlements, only the smallest particles (in the 0.5–1.5 μm range) that are transported over long distances are reaching the area. These results highlight the global impact of microplastic pollution and demonstrate that microplastic emissions have far-reaching effects, especially in the case of the smallest particles. As shown in Fig. 5, ~3% of the total global deposition of sub-70 μm microplastics reaches the polar regions.
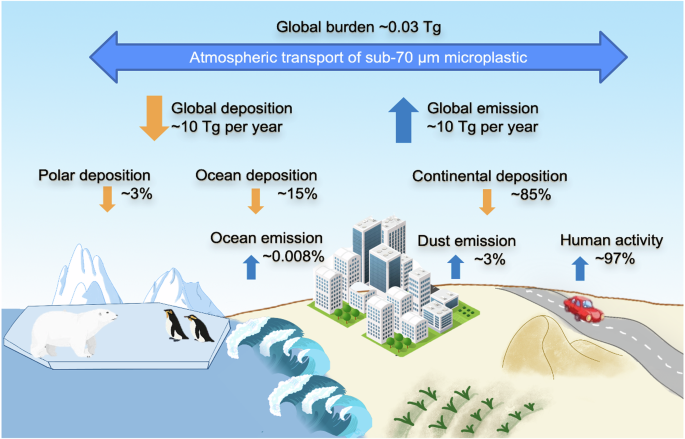
The yellow arrows represent the deposition. The blue arrows represent the emissions.
Global budget and atmospheric residence time of microplastic particles
We summarize our model results by showing in Fig. 5 a schematic with our estimate of the global budget of microplastic particles in the atmosphere. With the assumptions adopted here, the global emission of microplastic particles (~10 Tg/year) is attributed primarily to continental sources, accounting for nearly ~100% of the total emissions. Among this, human activities contribute to ~97% of the emissions, while dust particles account for ~3%. Ocean emissions represent only ~0.008% of the total flux from the atmosphere into the ocean. About ~85% of microplastics are deposited on the continent and ~15% onto the ocean. The deposition in the polar regions, involving primarily the smallest particles, accounts for ~3%. From the atmospheric burden and emissions estimated for the different size bins of the particles, the atmospheric residence time ranges from 1 year in the case of particles with 0.5 μm diameter to about 1 h for particles with 70 μm diameter. When integrating oversize, the mean residence time is close to 6 months for the smallest particles (0.5–1.5 μm) and 2.6 h for the largest particles (5–70 μm).
Discussion
In summary, our model simulations based on low oceanic emission flux values12 provide global distributions of microplastic particles that are consistent with 146 observational data points. They suggest that the role of the ocean sources is low and highlight the importance of long-range transport for particles emitted on the continent. The model, with its emission sources located primarily in densely populated regions, highlights the substantial exposure risks for a large fraction of the human population. Although the ocean contributes only about 0.008% as a source of atmospheric microplastics, it plays a crucial role as a sink, absorbing ~15% of the total atmospheric microplastic deposits.
Regarding the three-dimensional distribution of atmospheric microplastics, 5–70 μm large particles predominantly settle on land and near coastlines, whereas the 0.5–1.5 μm smaller ones are transported over long distances to the open ocean and polar regions, resulting in a more uniform distribution throughout the global atmosphere. With about 10 Tg/year of emissions and deposition per year, the atmospheric burden of the sub-70 μm particles is close to 0.03 Tg. Effective mitigation of microplastic-related risks for human health and ecosystems hinges on a comprehensive understanding of atmospheric microplastic dynamics.
However, with limited experimental data available and the simplifications introduced in our model, we should highlight some limitations in our study:
First, the largest uncertainty in our modeling study arises from insufficient information on emission fluxes. While we adopt for the model simulations the lowest reported oceanic emission fluxes, the continental emissions encompass many sources that are not yet fully quantified, including industrial production, commercial activities, and daily residential activities. Consequently, our estimates of continental emission sources can have significant errors. Despite this uncertainty, our study has demonstrated that low oceanic emission fluxes combined with high continental emission fluxes provide a good fit for global observations. However, the exact range of this uncertainty on emissions cannot yet be rigorously determined, so more work is needed to address this particular problem.
Second, microplastic particles with diameters smaller than 20 μm that are deposited on the surface can be remobilized by strong winds, which provides a source of resuspension, believed to represent <60% of the deposition84. In our simulations, we have neglected resuspension since this contribution is smaller than the error associated with the primary emission rates85.
Third, in-cloud scavenging contributes to the deposition of microplastics but is significant only for particles with diameters smaller than about 1 μm86,87,88,89,90,91. Besides, as plastic particles are generally hydrophobic and do not easily become cloud condensation nuclei92, they were found in very low concentration inside clouds93. In-cloud scavenging is therefore ignored in our simulations.
Fourth, it is important to note that the current modeling approach does not account for the chemical and physical aging processes that influence the transport dynamics of microplastics. These aging processes are influenced by factors such as humidity, ultraviolet radiation, secondary aerosol formation, and bacterial activity, among others. The lack of relevant mechanistic studies on microplastic aging limits our ability to accurately incorporate these processes into the models. Therefore, the current modeling results may not fully capture the complete behavior and fate of microplastics in the atmosphere.
Methods
Microplastic size distribution
The global size distribution of microplastics in the atmosphere as reported in Fig. 2 is based on observations of atmospheric suspended microplastics from various locations worldwide, is expressed as a probability density function44,45.
where (d{({{{Probability}}})}_{i}) is the probability density of the size interval i [μm−1] and ni is the number density of particles in the same interval. N is the total number density of particles. This function captures the number percentage (frac{{n}_{i}}{N}) of microplastics in the atmosphere corresponding to each particle size interval ((d{({{rm {Size}}})}_{i})). Previously reported size distributions are mostly based on the largest dimension of the microplastic particles, without distinguishing between different shapes21,30,31,32,34,37,40,41,42,43.
Model description
The transport and fate of microplastic particles in the atmosphere is simulated by the Model for Ozone and Related Species, version 4 (MOZART-4), an offline global chemical transport model developed at the National Center for Atmospheric Research (NCAR)94. In this study, the global model simulations are performed over a period of 2 years with a spatial horizontal resolution of 0.50° × 0.63°, or ~50 km, and with 48 vertical levels. Dynamical forcing by meteorological quantities required to simulate the long-range transport of particles is taken from the GEOS5 Atmospheric Forcing database for the years 2013 and 201495.
The equivalent diameter bins adopted in the model are centered at 0.5, 1.5, 5, 10, 35, and 70 μm. This selection is based on the following reasons: First, suspended particulate matter typically has a diameter of <100 μm96,97, and particles smaller than 50 μm are entrained into the boundary layer and can subsequently be transported over long distances98. Therefore, we select particles smaller than 70 μm for global atmospheric transport simulations to cover the main size range of microplastics involved in atmospheric transport. Second, this size range is consistent with the commonly reported size ranges in atmospheric modeling and emission flux studies applied to microplastics6,12,14.
The microplastic shapes considered in our model simulations are debris and fibers, which represent the observed particles in more than 90% of the cases26,27,28,35,36,39,41,42,56,57,58,59,99. We represent debris as spheres100,101. For these particles, the adopted settling velocity follows Stokes’ law86 and is therefore proportional to the square of the particle’s diameter. By assuming that the plastic density is close to 1 g/cm3 6, the resulting velocities derived for each size bin are provided in Table S2. It aligns with the reports by Tatsii et al. regarding the settling velocity of spheres19.
Fibers are defined as particles with an aspect ratio larger than 337,46. As the cross-sectional diameter of plastic fibers currently found in the atmosphere is >10 μm20, the aspect ratio cannot reach 3 for the particles with equivalent diameters of 0.5, 1.5, 5, and 10 μm. Therefore, we assume that the fiber shape applies only to particles whose equivalent diameters cover the 35 and 70 μm size bins. According to Yuan et al., most fibers have an equivalent diameter in the range of 30–50 μm, while fibers with an equivalent diameter of <20 μm do not exist56. Particles tend to settle with their largest projected area normal to the line of motion102. Therefore, elongated fibers experience greater drag during settling than agglomerated fragments of equivalent volume103. As a result, fibers have a lower settling velocity compared to debris and are transported to larger horizontal distances104 relative to debris/spheres with an equivalent diameter. For fibers with a 70 μm equivalent diameter, the settling velocity is 3.8–8 cm/s according to Tatsii et al.19, and 2–6.1 cm/s according to Xiao et al.105 For fibers with a 35 μm equivalent diameter, the settling velocity is 1.8–3.6 cm/s according to Xiao et al.105. Here, we adopt the midpoint of these ranges for the settling velocity of the fibers, as detailed in Table S2.
Washout (wet scavenging of particles by precipitation) is derived by a simplified (linear) formulation, in which a loss term with a diameter-dependent loss coefficient is added to the conservation equations. This loss coefficient (varLambda (D)) (s−1) is calculated by87
where 0 < α < 1 represents the ratio between convective to total precipitation rates. Coefficients a(D) and b(D) represent the size-dependent scavenging rates for heavy and light precipitation, respectively. Deposition parameters for each particle size bin are listed in Table S2. Rainout (in-cloud scavenging processes by which aerosols act as cloud condensation nuclei) is not explicitly considered in our simulations.
Surface emissions of microplastics
As mentioned above, we explore here the consequences of assuming a very low contribution of ocean emissions to atmospheric microplastics following the experimental study of Yang et al. The low oceanic emissions calculated through the physical mechanism of particulate emissions, amount to 8 × 10⁻⁴ Tg/year (unless specified otherwise, the emission fluxes mentioned below refer to microplastics in a size range of 0–70 μm)12.
The considerably larger terrestrial sources include primarily the mobilization of windblown dust and the contribution of human activities. According to the inversion models of Evangeliou et al. and Fu et al. windblown dust emissions are estimated to be 0.1 and 0.11 Tg/year13,14, respectively. Based on the recent estimate by Yang et al.106, the total soil-to-air particulate emission ranges from 0.0002 to 0.6 Tg/year. Here, we use for this particular category of emissions the midpoint value of this range and we adopt 0.3 Tg/year as the total emission flux.
Emissions resulting directly from human activities are more complex to quantify and include wear and tear of vehicle tires and brakes, agricultural production, industrial production, commercial activities, daily residential activities, etc.6,13,14,107. However, only the emissions from vehicle tires and brakes (0.115 Tg/year14, <10 μm of 0.43 Tg/year88, and <100 μm of 0.28 Tg/year13) and agricultural production (0–0.45 Tg/year6,13,14) are available. So far, emissions from industrial production, commercial activities, and daily residential activities have not been quantitatively analyzed, due to the difficulty in separating and analyzing the emissions from these sources. However, it has been established that most of these particles are released in the atmosphere in the form of fibers26,27,28,35,36,39,41,42,56,57,58,59,99. Since, according to Yang et al. fibers are not easily emitted through water-to-air transfer12 and are not produced in significant amounts by agricultural greenhouse film debris or vehicle tire wear and break debris, it is speculated that industrial production, commercial activities and daily residential activities are the major sources of fiber emissions in the atmosphere.
While the contributions of atmospheric sources of the ocean and windblown particles are negligible (~0.3 Tg/year), we assume that the emissions from human activities amount to 10 Tg/year, which is at the upper bound of the total emission estimates from previous studies (0.3–8.6 Tg/year)6,13,14.
In summary and based on our analysis and assumptions, oceanic sources, microplastic dust windblow, and emissions from human activities contribute respectively to ~0.008%, ~3%, and ~97% of the total emissions (Fig. 5). Recent studies indicate that airborne microplastic concentrations over land are an order of magnitude higher than those over the oceans. Additionally, airborne microplastic concentrations above roads are twice as high as those in other terrestrial outdoor environments108. Combining the emission data (Fig. S6), emission fluxes are particularly high in densely populated areas, with human activities being the dominant source of atmospheric microplastics.
Mean fractional bias and Pearson correlation coefficient
The mean fractional bias (MFB) and Pearson correlation coefficient (PCC), which are used to assess the model performance, are defined by
where ({C}_{{{m}}}) and ({C}_{{{O}}}) represent modeled and measured quantities and (N) is the total number of observations. MFB is a symmetric performance indicator that gives equal weights to under- and over-estimated concentrations (minimum to maximum values range from −200% to 200%)13. PCC is a measure of the linear correlation between the modeled and observed datasets109. The modeled concentration is derived by combining the concentration from the 6 size bins, and by utilizing the NSDAM relation. This approach ensures that the modeled concentration aligns with the observed data within the same diameter range.


 region")

Responses