Global distribution and predictive modeling of Vibrio vulnificus abundance

Introduction
Human-induced greenhouse gas emissions are influencing our climate1, already resulting in a 1.2 °C increase in the global mean temperature since the pre-industrial era2. Despite the Paris Climate Agreement’s objective to restrict the rise in global average temperature to two degrees at maximum3, there is likely a 1.5 °C increase by the early 2030s1.
The impacts of climate change may be particularly pronounced along the world’s coastlines, critical interfaces between natural ecosystems and human populations, representing key sources of economic activity, tourism, and leisure4. Besides the known threat of sea-level rise and increased storm and flood intensity, there is also a rising concern regarding human disease from pathogens5, such as Vibrio spp. These gram-negative bacteria, commonly present in marine and estuarine waters6, flourish in warm environments7.
Of particular concern is Vibrio vulnificus, the most lethal human pathogenic Vibrio, which favors temperatures >15 °C and mesohaline conditions8. Climate change will likely increase both the geographic range and prolong the growth period of V. vulnificus, leading to an increase in both skin and food-borne infections in temperate regions at higher latitudes6,7. Foodborne infections can result in symptoms such as fever, chills, hypotensive septic shock, and may ultimately lead to death9, while skin infections can swiftly progress to necrosis, necessitating urgent surgical tissue removal or limb amputation in approximately 10% of cases10 and have mortality rates as high as 18%11. Fatalities may occur within 48 h of exposure12.
Despite the expected increase in range and growing season, the associated poleward spread of infections, and the known lethality, drivers of V. vulnificus likely global distribution – or the distribution itself – are not fully understood. While not all V. vulnificus are pathogenic, there is a clear relationship between overall abundance and pathogenic strains13. Amplicon sequencing allows for taxonomic composition analysis of prokaryotic communities, but studies are generally limited in their temporal and spatial extent14,15,16. The steadily increasing volume of data available in public archives presents opportunities for large-scale re-analyses of thousands of datasets. This approach also enables the determination of the relative abundance of V. vulnificus within the overall bacterial population and assesses the extent of its spread and co-occurrence with other species at an increased spatiotemporal scale across a wide range of environmental conditions—from tropical regions to latitudes as high as the northern Baltic Sea. However, a comprehensive re-analysis of environmental amplicon data to monitor the spread of this pathogen is still missing.
We inferred the global distribution of V. vulnificus from 70,640 archived amplicon sequencing runs, hereafter referred to as datasets, in combination with freely available remote sensing data. This allowed the modelling of relative V. vulnificus abundances based on environmental factors at the global scale, the localization of global hotspots, and the observation of shifts in spatial distribution over time.
Results
We investigated the global distribution of V. vulnificus using publicly available sequencing datasets. Originally, 2,647,697 archived datasets were screened based on associated metadata, resulting in 70,151 datasets acquired from the European Nucleotide Archive (ENA). An additional 415 datasets were included from Riedinger et al. 202414 and 74 from study accession PRJNA1011541 from the Baltic Sea. The analyzed datasets, all within 50 km of a coast, ranged in latitude from 78° S to 83.1° N and spanned to globe laterally. Our analysis revealed the near global presence of V. vulnificus, with 1997 datasets where V. vulnificus presence was identified. Among these, 676 datasets were amplified in the V3-V4 region, while 1321 datasets were amplified in the V4 region. Hotspots of relative V. vulnificus abundance were found along the East Asian, US-east, and southern Baltic Sea coastlines (Fig. 1a). The southernmost V. vulnificus presence was detected in 2019 (study accession: PRJNA903199), while the northernmost was identified in 2012 (study accession: PRJNA322089, though this instance was host-associated). When considering only non-host-associated samples, the northernmost presence was detected in 2021. Datasets where V. vulnificus was detected were found increasingly northward every year between 2013 and 2021 except in 2015 and 2020. The datasets with the highest relative abundance were concentrated in the tropics, with 45% of all detections occurring in tropical regions. The majority (80%) of all V. vulnificus detections were in the northern hemisphere, with a median relative abundance of 0.004%. In contrast, detections in the southern hemisphere had a higher median relative abundance of 0.02%. The highest observed relative abundance of V. vulnificus (3.23%) was recorded in French Polynesia in the year 2016. The median relative abundance of V. vulnificus varied per year, ranging from 0.0029% in 2021 to 0.011% in 2022. However, there was no discernible trend indicating an increase or decrease in relative abundance over time. The global median relative abundance was 0.0056%. The proportion of datasets where V. vulnificus was detected was highest in 2021 and 2018 and lowest in 2013 (Supplementary Fig. 1).

The size of the dots, as a continuous scale, represents % V. vulnificus of the total bacterial community as assessed by 16S rRNA gene sequencing (a) Worldwide spatial distribution and relative abundance over time, with white dots representing all 70,640 initially selected coastal data points. b Relative abundance of V. vulnificus over time by latitude. c Relative abundance of V. vulnificus versus SST and chl-a. d Relative abundance of V. vulnificus versus both north-south and east-west current speeds.
Environmental factors shaping V. vulnificus distribution
V. vulnificus was detected at satellite-derived sea surface salinities (SSS) of 4.33 and 39.80. Occurrence at the lowest SSS was in 2021 in a river mouth draining into the Baltic Sea near Peenemünde, Germany, and at the highest SSS in a bay near Hurghada, Egypt, in the northern Red Sea. Among the datasets containing V. vulnificus where sea surface temperature (SST) data were acquired, 99.4% had SSTs above 15 °C, 99.1% had SSTs above 18 °C, and the median SST was 19.8 °C. V. vulnificus was detected between 5.4 °C in Portsmouth, UK, in March 2022 (Study accession: PRJNA587708) and 32 °C in a sewage outflow in Jeddah, Saudi Arabia, in October 2015 (Study accession: PRJNA386576). High relative abundances were typically linked to elevated SST (Fig. 1c). Generally, chlorophyll-a (chl-a) values ranged between 0.029 and 30.54 μg L−1 with a relative abundance of V. vulnificus of 0.0032% at the highest chl-a concentration. Considering current speeds (Fig. 1d), 94.3% of the datasets with V. vulnificus originated from locations where currents were observed to be under 1 m/s along both the north-south and east-west axes. Generally, higher relative abundances were associated with lower current speeds. No V. vulnificus was detected in areas with east-west currents exceeding 1 m/s or north-south currents exceeding 1.8 m/s.
Predicting V. vulnificus abundance
The relative abundance of V. vulnificus was predicted using a random forest (RF) model based on remote sensing data for 1208 datasets, amplified either in the V3-V4 or V4 region, with complete predictor values, and using the prokaryotic community data from 676 datasets amplified only in the V3-V4 region. The model based on the remote sensing data explained almost 50% of the variance in samples were V. vulnificus was detected, both on the test dataset and using 10-fold cross-validation (Fig. 2a, SI Table 1). SST was found to be the best predictor, followed by chl-a and SSS (Fig. 2b). E-W Ekman drift held the lowest explanatory power for the relative abundance of V. vulnificus. Members of the prokaryotic community predictive for V. vulnificus were represented by 400 sequence-based taxonomic features. In the top 10 predictors, six representatives of the Vibrionaceae family were found, four of which belonged to the genus Vibrio and two to the genus Catenococcus. Further, two Pseudoalteromonadaceae Pseudoaltermonas, Rhodobacteraceae Marivita, and Flavobacteriaceae NS3a marine group were found to be important.
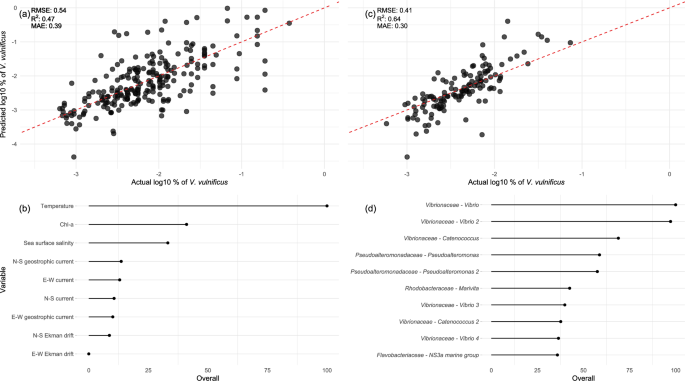
Performance and feature importance of the global V. vulnificus model based on remote sensing data (a, b) and on the prokaryotic community (c, d). a, c Model prediction on the y-axis compared to the values in the test set (x-axis), the red-dashed line is the 1:1 line. Performance measures on the test dataset are given. b, d Feature importance scaled between 0 and 100, of the top predictor variables.
Using satellite data from August 2021, the global model shown in Fig. 2a, b was employed, as an example, for the Baltic Sea (Fig. 3). The Baltic Sea provides excellent environmental conditions for V. vulnificus in summer, over the full known salinity range of V. vulnificus, and has relatively comprehensive V. vulnificus infection data sets available for Sweden and Germany and to a lesser extent other Baltic Sea countries17. The 85 recorded infection cases can thus be used to indicate possible utility of our model for infection risk prediction for a wide range of environmental conditions. The V. vulnificus suitability was predicted to be highest at the southwestern and southeastern Baltic Sea coast, and the lowest in the Gulf of Bothnia and the Gulf of Finland. The southern coast is also the region with the highest infection rates recorded over the past three decades. The high-risk areas were associated with moderate SSS (Supplementary Figure 3b) and high SST (Supplementary Figure 3c). Current speeds in the Baltic Sea were generally low in August (Supplementary Figure 3d), and chl-a values, integrated over the same period, did not exhibit a clear relationship with V. vulnificus suitability (Supplementary Figure 3a). Since phytoplankton blooms are characterized by high chl-a concentrations over only short periods, the resulting signal when averaged over a month will be minimal. The regions classified as very low-risk have low SSS.
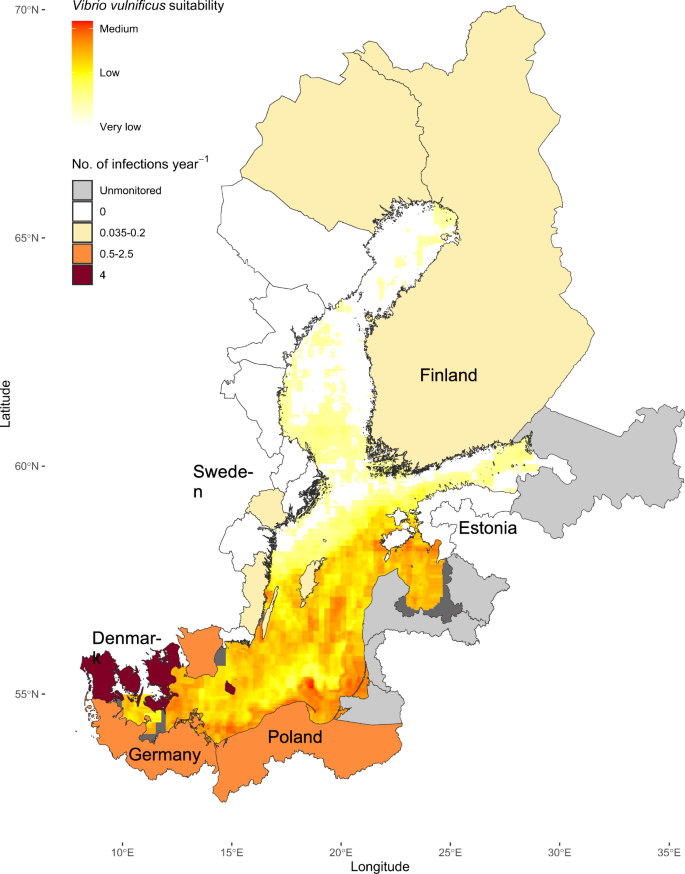
Infection cases in the Baltic Sea region normalized by dividing the total recorded cases by the official monitoring years, resulting in a per-year figure to allow for country-to-country comparisons based on Gyraite et al. 202417. The data for dark gray areas was incomplete. Very low suitability is defined as 0.0014 %, low suitability as 0.002%, and medium suitability as 0.0057% of the bacterial community predicted to be V. vulnificus in the colourscale.
Discussion
In this study, we obtained 1997 global 16S rRNA amplicon datasets from archived sequencing data, in which V. vulnificus could be detected. This resulted in a global overview of V. vulnificus occurrence, distribution, and changes in relative abundance. We modelled the relative abundance of V. vulnificus using a RF, providing high-resolution prediction of environmental suitability. Globally important prokaryotic predictors were determined using a combination of recursive feature elimination (RFE) and RF, indicating that decaying phytoplankton blooms might stimulate V. vulnificus proliferation.
The global patterns of hotspots on the East Asian, eastern US, and southern Baltic Sea coasts coincide with densely populated areas, indicating major risks for the coastal population there. As previous studies have proposed, high population density and the associated eutrophication itself might amplify V. vulnificus abundance, while also escalating infection risk through heightened exposure14. This has been noted on the US coast18, the Baltic Sea19, and the East Asian coast20. An aging population in the Baltic Sea region21, East Asia22, and the USA23 will exacerbate these infection rates, aligning with previous at-risk predictions24.
These problems will only further intensify due to the increased proliferation of V. vulnificus at higher temperatures, which was found to be the crucial factor in our study, aligning with existing literature25. This explains why most datasets with high relative abundance originated from the tropics, where runoff, estuaries or sewage can provide suitable salinities locally combined with very high temperatures. Known infections in this region are possibly low due to lower reporting standards compared to areas like the US and the Baltic Sea region.
Indications for the poleward expansion of V. vulnificus25 are visible both on the northern and southern hemisphere on a limited, compared to climatic cycles, temporal scale. This is provided by environmental data reflecting the predicted increase in V. vulnificus occurrence in high-latitude regions, for example in the northern Baltic Sea24. Sampling bias might contribute to the possible observed poleward shift in V. vulnificus detection, as the bacterium may have been present already in areas where it was detected or in more polar regions that went unsampled in earlier years. However, the substantial number of analyzed datasets where V. vulnificus was absent in polar regions each year compared to the northernmost positive detection (Fig. 1a & Supplementary Figure 2) suggests a possible shift. This possible shift cannot be directly tied to climate change due to the limited timespan of the available data. There was no notable change in the median relative abundance of V. vulnificus per year over the 10-year period. However, the proportion of detections reached its peak in 2021, followed by 2018 (15.3 and 6.3% respectively; Supplementary Figure 1), coinciding in 2021, with a higher frequency of detections between latitudes 53°N and 66°N.
The importance of chl-a in addition to SST, when predicting relative V. vulnificus abundance, is in accordance with recent literature14,15. The relationship between chl-a and V. vulnificus is non-linear and potentially dependent on other environmental parameters, as a direct relationship was not detected. Possibly, it is not the high concentrations of phytoplankton itself that lead to high relative V. vulnificus abundances but rather the breakdown of it and the release of dissolved organic matter14,26. This would also explain why lower current speeds, while having limited importance in the model, might favor a higher relative abundance of V. vulnificus. The more stagnant waters are usually more stratified and, consequently, they foster larger surface blooms27 which after depletion of the local inorganic nutrients, decompose. The organic nutrients, presumably important for the rapid growth of V. vulnificus14,28, subsequently lead to an increase in the relative abundance.
The ability of early microbial colonizers to predict the relative abundances of V. vulnificus lends support to this theory. Members of the genus Vibrio are typically among the first to colonize new particles29. As some of the fastest-growing bacteria30, they can form massive but short-lived blooms under favorable conditions31. This is consistent with the strong predictive capacity of Pseudoalteromonas, which has been linked to decaying blooms through its role in cell lysis32, resulting in increases in Vibrio33 and the Roseobacter clade (Rhodobacteraceae Marivita)34. Flavobacteriaceae, previously identified as a key predictor of V. vulnificus in RF models14, also play a role in the rapid succession of bacterioplankton species following spring blooms35. Environmental conditions, primary production and the degradation of biological matter likely influence the proliferation of V. vulnificus differently across varying SSTs and current speeds. Following the findings of our models, it is reasonable to expect that the poleward trend of V. vulnificus will be exacerbated by predicted increases in (harmful) algal blooms at higher latitudes36,37. This underscores the benefit of incorporating additional parameters beyond SST and SSS into V. vulnificus suitability modeling.
To train the model, datasets without V. vulnificus were removed, as absence is ambiguous, while presence is more definitive. The lack of detection could be due to insufficient sequencing depth, an incomplete comparison database, or DNA loss from extraction biases. Although restricting the model to presence-only observations introduces a bias, it allows us to disentangle the factors influencing the proportion of V. vulnificus, as this approach a priori excludes any conditions that are not conducive to its presence. Despite the model performance, issues with using remote sensing data to predict V. vulnificus remain. Due to a preference for brackish waters, V. vulnificus are often found in (small and shallow) estuaries where conditions can rapidly change with the tides, making daily remote sensing measurement imprecise. Additionally, the applied bounding box method, while necessary to ensure consistent input data across all datasets, can result in the inclusion of satellite data from outside the estuary. However, the extensive amount of data available from archived and satellite sources helps to compensate for the increased noise in the dataset. The broad geographical distribution of the dataset allows the model to also approximate the effects of extreme weather events for many locations. For instance, temperatures in the tropics represent extreme heatwaves for marginal seas like the Baltic Sea, while Baltic Sea temperatures are equivalent to extreme cold for tropical regions.
The comparison of predicted environmental suitability for V. vulnificus in the Baltic Sea, averaged over August—the month with the highest infection risk—with reported infection cases demonstrates a possible use case for high risk regions. Assuming SSS38, SST39, phytoplankton dynamics, and current speed40 patterns are relatively regular, a similar risk profile for the Baltic Sea can be assumed each summer. The risk profile predicted by the model aligns with the recorded infections per year. Monitoring efforts remain incomplete in numerous countries and are entirely absent in large portions of the eastern Baltic Sea region. Gyraite et al. 202417 predicted unreported cases in Lithuania and Poland over the last three decades, identifying regions that align with suitable conditions according to our model. Additional validation is advisable using the increasing number of infection cases with a known origin as they become available. The similarity in regional patterns does, however, indicate that the proposed model may have a role in infection prediction as well as V. vulnificus environmental suitability prediction.
Methods
The full workflow is schematically represented in Fig. 4, outlining the analysis described in more detail in the following section. R41 was used for machine learning and data processing, Bash for bioinformatics workflows, and Python42 for remote sensing tasks.
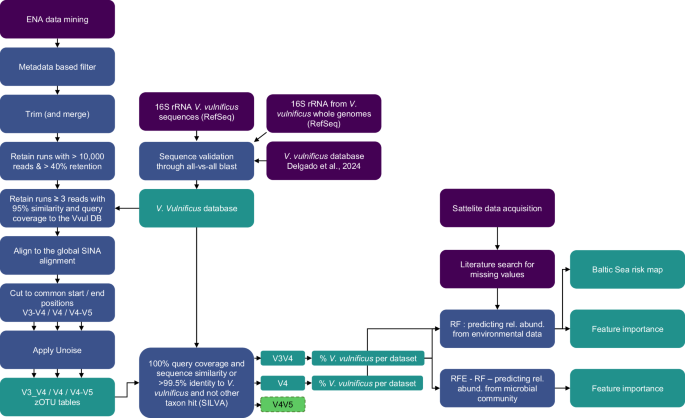
Initial data acquisition (purple), processing steps (blue), final products (teal).
Obtaining raw reads and initial data selection
Metadata for raw amplicon reads (2,647,697) with specific criteria (tax_tree(408169) AND library_strategy = “AMPLICON”, AND library_selection = “PCR” AND library_layout = “PAIRED” AND instrument_platform = “ILLUMINA” AND library_source = “METAGENOMIC”) were obtained through an advanced search on the ENA on October 24, 2023. These underwent an initial metadata-driven selection, excluding data sets lacking latitude and longitude information. Subsequently, a positive selection based on presumed environmental origin (NCBI taxon_id) and negative keyword-based selection was performed on completed descriptive columns (https://git.io-warnemuende.de/riedinge/datamining_vulnificus_DR_CH), and those with non-marine and/or non-prokaryotic sample submission checklists, host_tax_ids, or non-16S rRNA amplified datasets were excluded. Datasets further than 50 km from the coast were removed using a high-resolution coastline (10 m) dataset from natural earth (V. 4.1.0). Sequencing data generated for both Riedinger et al. 202414 and an associated study (study accession PRJNA1011541) were additionally included. In total 70,640 runs, for which Fastq files were retrieved, were retained for initial analysis. These are referred to as datasets.
Trimming, merging, and filtering of raw reads
Despite restricting the data selection to paired-end runs, data retrieved from the sequence read archive was available in both merged and unmerged form. Merged and unmerged reads were quality trimmed using a sliding window approach implemented in bbduk.sh of the bbmap software suite version-39.0143, with a window size of 4 and average quality 15, and unmerged datasets were subsequently merged. Reads shorter than 248 base pairs were discarded and datasets with < 10,000 reads or more than > 60% of reads lost during quality control were removed. The remaining datasets were then compared (blast-2.13.044) to a custom database comprising of 238 16S rRNA V. vulnificus sequences sourced from RefSeq45 and from a custom V. vulnificus database46. Only datasets with ≥3 reads which had more than 95% similarity and query coverage to the custom database were retained and reformatted to fasta files for further analysis. This data collection represented 26357 datasets of likely 16S rRNA origin, which might contain V. vulnificus. Datasets were processed using Snakemake version 6.15.147 as a workflow manager on the compute cluster Emmy of the Gesellschaft für wissenschaftliche Datenverarbeitung mbH Göttingen (GWDG), Germany, of the Alliance for National High-Performance Computing (NHR).
Alignment and identification of the amplified region
Using ARB (V. 7.0)48, positions were identified where V. vulnificus could be differentiated from its closest relatives, such as V. pommerensis and V. navarrensis. This was achieved by comparing V. vulnificus type strains to known V. pommerensis and V. navarrensis sequences and type strains of sister branches (Vibrio thalassae, Vibrio madracius, Vibrio mediterranei, and Vibrio shilonii). Position 10266 within the SILVA alignment was identified as the most divergent between V. vulnificus and the other sequences. Position 15968 in the SILVA alignment further allows for the distinction between V. vulnificus and V. pommerensis and V. navarrensis only while 16,421 to 16,427 allow for the differentiation between V. vulnificus and type strains of the sister branches mentioned above. Consequently, only the V3-V5 regions are suitable for the differentiation between V. vulnificus and other Vibrio species based on the 16S rRNA gene. Retained datasets were aligned to the global SILVA49 alignment using SINA50 (V. 1.7.2) and revealed three distinct clusters covering the identified positions (Supplementary Figure 4), presumably generated using 3 primer pairs binding to Escherichia coli 16S rRNA positions 341 – 806, 515 – 806, and 515 – 926, corresponding to the hypervariable regions V3-V4, V4 and V4-V5. These were cut using seqtk51 (V. 1.3.) to the corresponding SILVA alignment positions (6472 – 23441, 13862 – 23446, and 13862 – 27656). This resulted in 25730 datasets left for analysis, 10703 in the V3-V4 region, 5444 in the V4, and 9583 in the V4-V5.
Denoising and V. vulnificus detection
Per amplified region, reads were dereplicated and denoised into zOTUs using the UNOISE52 algorithm implemented in VSEARCH (V. 2.27.0)53. After dereplication, singletons were removed and UNOISE was used to denoise reads into zOTUs (minsize = 10 and alpha = 3). The remaining reads with an abundance between 2 and 9 were mapped to the generated zOTUs52. The zOTUs were then compared to the SILVA database (V. 138.1) and the custom V. vulnificus 16S rRNA gene database. Only zOTUs with either 100% query coverage and similarity to the custom database or those with > 99.5% similarity and no other species hit in SILVA were classified as V. vulnificus. Only datasets with at least three V. vulnificus reads were retained for further analysis. No such zOTUs were found in the V4-V5 datasets and therefore datasets amplified in this region were not included in the further analysis
For all samples where V. vulnificus was detected, the relative sequence abundance of all zOTUs identified as V. vulnificus were summed and taxonomy was assigned to the remaining zOTUs using DADA254 (V. 1.26) assign_taxonomy() with SILVA49 (V. 138.1) as the reference database. A bootstrap cutoff of 50 was chosen, and all chloroplast, mitochondrial, and eukaryotic zOTUs were removed.
Remote sensing data
To retrieve satellite-based environmental data for datasets where V. vulnificus was detected, the E.U. Copernicus Marine Service was used. Chl-a, SST, SSS, Ekman currents, geostrophic currents, and general current values were obtained (Table 1).
Only datasets with valid collection dates (a distinct year, month, and day) were included, due to many datasets being coastal there was no value for some of the parameters from satellite-based measurements. A bounding box method was applied by averaging satellite-derived values found within a 10 × 10 km square surrounding the original sampling point. When data was missing after remote sensing and screening the metadata available from ENA, the original publication linked to the archived dataset was used to find environmental data if possible.
Machine learning
The relative abundance of V. vulnificus was predicted using RF (Caret55 V. 6.0.94), (i) based on the satellite data, for a combined dataset of V3-V4 and V4 V. vulnificus detections and (ii) based on the prokaryotic community using only the V3-V4 datasets where V. vulnificus was detected. The inclusion of only those datasets introduces a positive sampling bias and means the models are in essence predicting not the presence, but the relative abundances when the conditions for the presence of V. vulnificus are met. The data for both models was split into train/test sets (0.8/0.2) and validated, using the log 10 transformed data target variable, once using 10-fold CV on the training set, and once on the test set. The prediction based on remote sensing data was performed without any further feature selection with 9 predictors on 1208 datapoints (mtry 5, ntree 1000). To improve both prediction accuracy and decrease runtime when using the prokaryotic community, a two-step feature selection was implemented on the train dataset. First zOTUs not present in at least 30 samples were removed from the feature space. The impact on the structure of the total prokaryotic community was estimated to be minimal based on the limited effect on the difference between Bray-Curtis dissimilarity before and after the filter (Supplementary Fig. 5). A further selection was made on the zOTUs with RFE56 using 10-fold CV. 400 optimal features were selected and used to train a RF (mtry = 20, 1000 trees). Important variables were selected using the varImp() function.
The satellite-based model was subsequently used to predict the V. vulnificus suitability in the Baltic Sea in August 2021. Since the training data lacks negative datasets, the model invariably predicts some level of suitability. Consequently, the category labeled “very low” (depicted as white in the plot) corresponds to the lowest 25th percentile of these predictions. This corresponds to a relative abundance of V. vulnificus in the prokaryotic community < 0.0014 %. The highest predicted value, defined as medium suitability is 0.0057%, which is 15% of the global average relative abundance.


Responses