Global hake production and trade: Insights for food security and supply chain resilience
Introduction
The role of international food trade in supporting food and nutrition security worldwide is increasingly acknowledged. While trade optimises food distribution, diversifies diets, and stabilises prices1,2, disparities in governance, infrastructure, and market access often skew these benefits3,4,5. Low-income and vulnerable countries are particularly exposed to negative shocks in the food trade system, making equitable distribution of food a significant challenge6,7,8.
Within the intricate web of global trade, hake emerges as a species of significant economic and nutritional value, impacting international market dynamics and dietary preferences worldwide. Primarily belonging to the genera Merluccius and Urophycis, hake is extensively traded on the international stage and is a critical component of the global white fish market. Its trade volumes and values, which between 2016 and 2022 accounted for 2.23% and 2.19% respectively of the global trade in frozen fish, underscore its significant commercial role relative to other major seafood commodities such as yellowfin tuna, which represented 4.3% by weight and 5.43% by value9. This study aims to explore the intricacies of the global hake trade network (HGTN), emphasizing its pivotal role in the broader context of global fisheries and trade policies.
Food security, as defined by the Food and Agriculture Organization (FAO), is a condition that exists when all people, at all times, have physical, social, and economic access to sufficient, safe, and nutritious food that meets their dietary needs and food preferences for an active and healthy life. The international trade of aquatic products is crucial for enhancing global food security, expanding consumer choices, and driving economic growth, particularly in lower-income countries10. This sector not only generates significant export revenue and employment but also addresses nutritional needs, especially in regions like Africa, where the import of nutrient-rich small pelagic species plays a pivotal role in enhancing food security and providing access to essential micronutrients9. Seafood, one of the most globally traded food commodities, is susceptible to various negative shocks such as fishery collapses, natural disasters, oil spills, policy shifts, and disease outbreaks in aquaculture, which threaten its stability and availability11. Moreover, as the global population is projected to reach nearly 9.8 billion by 2050, the escalating demand for nutritious food sources such as seafood further exacerbates these challenges (United Nations).
Global trade agreements and organisations such as the World Trade Organisation (WTO) have significantly broadened the reach of the seafood trade by reducing barriers and promoting interregional exchange. While these developments have been crucial for economic growth and market access9,12, they also present challenges for resource management and the traceability of fisheries. The liberalization of trade has the potential to complicate the tracking of seafood products, making mechanisms like traceability and catch documentation even more essential. These mechanisms are the cornerstone of food safety regulations and key initiatives in the fight against illegal, unreported, and unregulated fishing. Alongside these, certification schemes and ecolabels play a critical role in safeguarding consumer protection and ensuring sustainable resource use. They help maintain a balance between the benefits of market access and the imperatives of environmental and consumer safety9.
The global decline of fish stocks within biologically sustainable levels—from 90 percent in 1974 to 64.6 percent in 2019—highlights the escalating pressures on marine resources, with significant implications for global food security and local economies13. The resilience of seafood trade networks, increasingly recognized as fundamental to sustaining global food supplies amid ecological and economic shocks, refers to the capacity of these networks to maintain their functionality and structure in the face of external stresses4,6. Such resilience is crucial in the fisheries sector, where sustainability of fish stocks is directly impacted by market demands and regulatory frameworks14,15.
In the Southwest Atlantic, for example, the Argentine hake (Merluccius hubbsi) catch increased significantly by 26 percent from 2017, marking it as a crucial species in terms of catch volumes for the FAO area9. This improvement exemplifies how effective fisheries management can enhance sustainable fisheries practices. Conversely, in the Mediterranean and Black Sea, most commercially important stocks, including hake (Merluccius merluccius), are fished beyond biologically sustainable limits, with an overall fishing mortality nearly 2.5 times higher than sustainable reference points9.
Substantial research underscores the multifaceted impact of global trade networks, highlighting both their benefits and vulnerabilities, as well as the complex interdependencies they create among producers, intermediaries, and consumers Stoll et al.16,17,18,19. For example, analysis of lobster trade routes has revealed that regional market shifts or policy changes can have extensive effects on global markets, affecting stakeholders from producers to consumers across different continents (Stoll et al.16). Similarly, studies on the octopus trade demonstrate that the dominant exporters and importers may not necessarily control the market; often, it is the entities within expansive and diversified commercial networks that bridge major economies or regions, effectively directing the flow of goods19. Employing network analysis to explore these complex trade dynamics allows for a deeper understanding of how distant feedback loops and trade dependencies influence global markets17,18. This methodological approach is essential for developing strategies that promote effective and sustainable fisheries management and inform sound policy decisions19,20,21,22,23. Hake, being a major commodity in the seafood market, is subjected to varying fishing pressures and regulatory environments across its range. The species’ trade patterns provide critical insights into overexploitation risks and opportunities for implementing sustainable practices. By analysing these networks, stakeholders can identify key countries and links that are crucial for the flow of hake, pinpointing where interventions might be most effective. This analysis helps in understanding how disruptions in one part of the network, such as overfishing in a primary export region or policy changes in a major import country, can ripple through to affect global supply chains.
This paper, therefore, seeks to address three interconnected objectives. First, it aims to delineate the structure and characteristics of the global hake trade network, highlighting the interplay between trade dynamics and fisheries management. Second, it endeavours to assess the resilience of this network, with a particular focus on its capacity to withstand and adapt to ecological and economic shocks. Lastly, it seeks to contribute to the discourse on sustainable fisheries management by examining how trade networks can be leveraged to promote more equitable distribution of resources and enhance global food security.
Through this comprehensive analysis, the paper aspires to provide actionable insights and recommendations that can inform policy decisions and management strategies aimed at sustaining the viability of hake fisheries and ensuring the long-term resilience of global seafood supplies.
Material and methods
Firstly, our study conducts a comprehensive analysis of hake fishery production from 1950 to 2020. We traced the development of hake catches across various species, continents, and subcontinents, highlighting significant trends, shifts in species dominance, and the emergence of key producers. We derived fishery catches statistics from the FAO’s FishStatJ global capture production database24 and integrated these with export and import data from the United Nations Commodity Trade Statistics Database25 to estimate global per capita hake availability (Table 1). Secondly, we focused the analysis on the HGTN between 2016 and 2020, particularly for the genera Merluccius and Urophycis, leveraged data from the same UN database25. Using network analysis and advanced graph visualisation techniques, our study not only elucidates the complex patterns and dynamics of the HGTN but also identifies its principal players.
Here the concept of food supply, defined as the quantity of food available for human consumption, was central26. We focused on understanding primary consumers in the hake trade network to analyse hake market dynamics comprehensively. Given that official databases often lack detailed per capita consumption data for individual hake species, we estimated national food supply by considering production, imports, and exports relative to population size (apparent food supply=production+imports–exports/human population) from 2016 to 2020. This estimation method, adapted from the FAO’s approach for food balance sheets, reflects the total quantity of hake produced, imported, and exported26. However, unlike the FAO’s comprehensive method, our calculation does not account for stock changes and non-food uses26. Although our method potentially overestimates average consumption, it provides a necessary balance between data availability and reliability, as outlined in Table 2. It is important to note, as per FAO guidelines, that the actual amount consumed may be lower than our estimated supply due to losses at various stages, including household consumption26.
Our study uses network analysis and advanced interactive graph visualization techniques to disentangle the complexities of the global hake trade network. We collated data on frozen hake trades, which predominantly constitute the market27,28, across 193 countries or territories from 2016 to 2020. This was achieved using UN Comtrade commodity codes 030366, 030378, and 03047425. To facilitate accessibility and comprehension of this trade database, we developed an interactive web application: https://mares-imedea.shinyapps.io/Hake_Global_Trade_Network/. This advanced yet user-friendly spatially-explicit tool displays maps with various centrality measures and allows users to explore and download the clean, processed, and filtered database on hake trade. This platform enables anyone to effectively visualize the quantity, monetary value, and directional flow of hake trades, thereby revealing the network’s structure and dynamics.
In conducting our study, network analysis was crucial in identifying essential nodes and clusters within the global hake trade, shedding light on influential players and potential trade flows. To determine the nodes’ and edges’ significance, we applied centrality measures including degree, strength (weighted degree), betweenness, and Page’s Rank, each offering distinct insights18,29.
Degree centrality was crucial in identifying hubs that if disrupted, could substantially impact the network’s coherence, reflecting on the network’s resilience. Strength (weighted degree) illuminated the economic throughput within each node, thus informing us of the network’s efficiency in terms of trade volume and value. Betweenness centrality allowed us to locate nodes that function as vital bridges in trade pathways. High betweenness scores indicated points of potential vulnerability, where disruptions could wave through the network, emphasizing the network’s ability to withstand shocks. Page’s Rank identified nodes of influential prominence, often indicative of strong interconnectivity and robust trade links, serving as a metric for resilience through distributed influence and importance within the trade network.
These centrality measures afforded us a comprehensive view of the hake trade network’s structure and function, offering fundamental indicators for the network’s capability to maintain functionality and facilitate efficient trade under varying conditions18,30. The nuanced understanding these metrics provide for assessing the network’s resilience and efficiency is elaborated in Table 3.
Hierarchical clustering, employing Ward’s method, was used to group traders within the global hake trade network31. This approach aimed to minimise within-group dispersion, effectively revealing patterns and relationships that might otherwise be obscured in the complexity of international trade. By focusing on import and export links, quantified as in-degree and out-degree respectively, we gained valuable insights into the network’s structural dynamics. This aspect of our analysis was crucial in understanding how hake trade flows are organised and how different countries or regions contribute to the overall network. The statistical significance of these clusters was verified using a similarity profile method (permutations = 999, expected clusters = 1000).
Furthermore, we used a Sankey diagram to effectively communicate the complexities and intricacies of the trade flows within the hake market between countries. Sankey diagrams are adept at depicting such connections and magnitudes, making them an ideal choice for representing the multifaceted nature of international trade flows in a manner that is both informative and accessible to a wide range of audiences.
Analyses were performed using the R language and environment32. Network analysis employed the “igraph” package v.1.2.52733, hierarchical clustering utilised “flashClust” v.1.01-22834, and network visualisations were created with “ggplot2” v.3.2.135, “ggmap” v.3.0.036, “ggraph” v.2.0.01337 and “ggtree” v3.0.238. Figures 1, 2S1 and S2 were created with Python using Matplotlib39 and Seaborn libraries40.
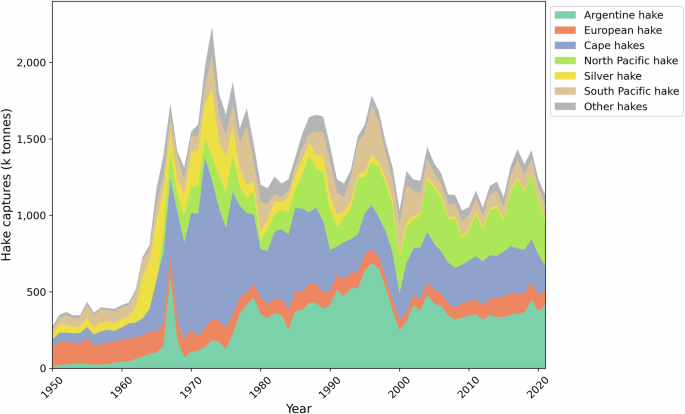
The “other hakes” group encompasses Benguela hake, Deep-Water Cape hake, Hakes not elsewhere included, Offshore silver hake, Panama hake, Patagonian hake, Senegalese hake, Shallow-water Cape hake, Southern hake, Brazilian codling, Carolina hake, Gulf hake, Red hake, Southern codling, Spotted codling, Urophycis not elsewhere included, and White hake. Values are given in tonnes. Data source: FAO. Created with Python using Matplotlib library.
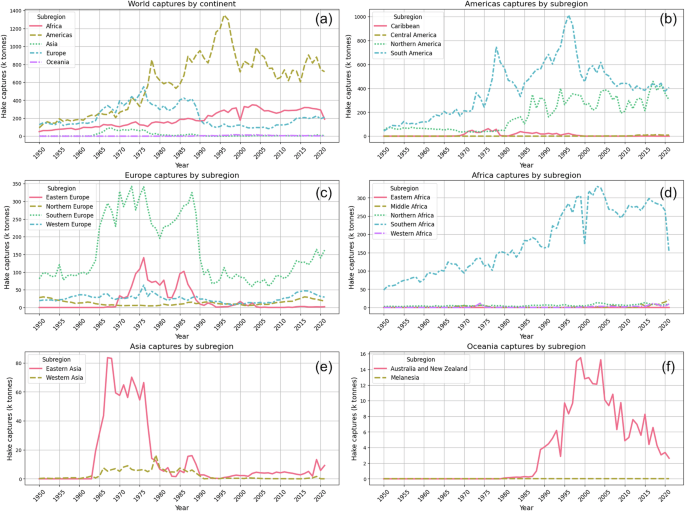
Hake catches over time by region—(a) global overview by continent and (b–f) detailed breakdown by continent and subcontinent (unit: kilo tonnes). Note that Y-axis scales vary between subplots. Data source: FAO. Created with Python using Matplotlib and Seaborn libraries.
Results
Global hake catches
The analysis of FAO databases reveals that 6 out of 22 hake species, namely Argentine hake (Merluccius hubbsi), Cape hake (Merluccius capensis), North Pacific hake (Merluccius productus), South Pacific hake (Merluccius gayi), silver hake (Merluccius bilinearis), and European hake (Merluccius merluccius), accounted for 94% of total catches from 1950 to 2020. Peak catches occurred in the 1970s, reaching 23 million tonnes in 1973 (Fig. 1).
European and South American fleets dominated hake catches until the late 1970s, after which South American fleets, notably from Argentina and Peru, took the lead, a position they maintain today (Fig. 2a). This shift is evident from the surge in South American catches during the late 1970s and early 2000s (Fig. 2b and Table S1). Argentina and the USA led the American continent in catches for the period 2016-2020 (Table 2, Figure S1), while European catches, despite being stable initially, have shown a decline since the early 1990s (Fig. 2c). Spain recorded the highest volume of hake catches in Europe from 1950 to 2020 (Table 2, Table S1, Figure S1).
The role of Africa, especially the southern region represented primarily by South Africa, is noteworthy. Here, hake catches have increased since the 1950s, with a significant rise in 1990 when Namibia’s catches increased (Figure S1). These catches experienced a decline in mid-2005 and have since stabilised, surpassing European catches (Fig. 2). South Africa and Namibia together accounted for 21% of Africa’s catches from 2016 to 2020 (Table 2). Asia and Oceania, though smaller in catching volumes, have shown fluctuating trends, with peaks and subsequent falls (Fig. 2e, f). Japan led the catches in Asia until the 1980s, followed by the Republic of Korea, while the leader in Oceania was New Zealand (Table 2, Table S1).
It is important to note, according to the FAO26 statistics office, that the reported national data encompass all quantities caught by fishing vessels registered under the flag of the reporting country, whether landed domestically or abroad. This data excludes catches by foreign vessels that are landed in domestic ports (Table 2). This delineation helps clarify the ownership and origin of catch data, essential for understanding the dynamics of global fisheries and managing marine resources effectively.
Global hake trade and supply
In terms of international trade from 2016 to 2020, Europe emerged as the dominant importer, outperforming other regions (Figure S2). North America and Africa displayed high export volumes, whereas Asia and Oceania had lower values. Europe is a significant net importer, while Africa and North America are predominantly export-oriented. Asia shows a balanced trade profile, slightly inclined towards imports. In South America, both exports and imports were low and comparable throughout the period.
The GDP, betweenness centrality and hake supply connection
The Falkland/Malvinas Islands, Namibia, Argentina, Saint Kitts and Nevis, Montenegro, Spain, Portugal, and Lithuania stand out for their high per capita hake supply. This supply is also substantial in South Africa, Uruguay, and Chile (Table 2). An interesting correlation emerges between countries with high network intermediation (betweenness), ample hake supply, and Gross Domestic Product (GDP) (Fig. 3). Countries with higher GDPs generally, display greater volumes of hake supply (linear model: GDP ~ food supply, adjusted R2 = 0.24, p-value < 0.001), indicative of a correlation between economic affluence (i.e., GDP) and hake trade network intermediation (linear model: GDP ~ betweenness, adjusted R2 = 0.58, p-value < 0.001). Notably, the USA and China are positioned at the upper end of the GDP spectrum yet demonstrate moderate normalized betweenness, suggesting significant hake supplies but less centrality in the trade network. In fact, there is an overlap between food supply and catches in the USA, except for the periods between 1985 and 1992 and from 2012 onwards, which coincide with increased exports (Figure S1). European countries show varied levels of both GDP and hake supply, with Spain (ESP) exhibiting a high betweenness, underscoring its pivotal role in the hake trade. The case of Spain is noteworthy, as the food supply has consistently exceeded the catches across the data series. From 1976 to 1990, this supply was primarily supported by catches. However, from 1990 onwards, Spanish catches have been significantly lower than imports, with the latter sustaining the supply over the last three decades (Figure S1). African nations, like South Africa (ZAF) and Namibia (NAM), also appear as key nodes, with substantial hake supplies and high betweenness, highlighting their importance in the hake market. Namibia and Argentina are both exporting countries with food supply below the level of catches (Figure S1). In contrast, countries with lower GDPs, such as Senegal (SEN), show lower hake supply but not necessarily lower betweenness, pointing to strategic niches within the trade network. This visualization underscores the nuanced interplay between a country’s economic status, hake supply capacity, and its role within the global trade network of this commodity.
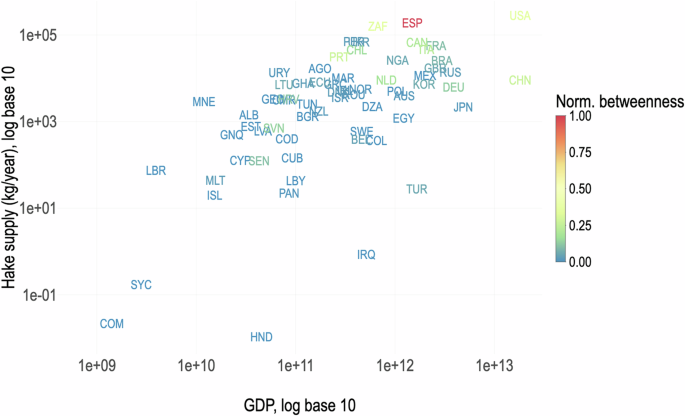
This figure illustrates two significant correlations: (1) between higher GDP and greater hake supply (linear model: GDP ~ food supply, adjusted R2 = 0.24, p < 0.001); and (2) between higher GDP and increased network centrality (betweenness) (linear model: GDP ~ betweenness, adjusted R2 = 0.58, p < 0.001). The hake supply (catches and imports minus exports) and Gross Domestic Product (GDP) are displayed on a logarithmic scale. The normalised betweenness centrality is weighted by hake trade volume (tonnes). Each country is represented by its ISO3 code, as listed in Table 1. The figure was generated using the R package ‘ggplot2’ v.3.2.113.
Current trends in hake trade
Our findings indicate a growth in total hake transactions in both volume and value, although the growth transactions rate has declined since 2016 (Figure S3). In 2016, the total volume of hake traded was 319 tonnes, with a value of 908 USD million. This volume increased by 47% in 2017 (469 tonnes), with an estimated value of 1.21 USD billion (33% annual increase). In 2018, there was a modest volume increase by 5%, reaching 497 tonnes and a value of around 1.34 USD billion (11% annual increase). In 2019, the volume continued to grow by only 0.3%, reaching 499 tonnes, while the value suffered a slight decline with a total of 1.32 USD billion. However, in 2020, a decline in the volume of hake trade was observed, falling to 429 tonnes, while the value remained around 1.18 USD billion.
Degree centrality and trade clusters
Cluster analysis, using a degree threshold, has revealed stable and frequent trade relations within the global hake market. We observed a positive correlation between the number of trade connections a country maintains and its total export and import flows (linear model: Degree ~ country exports, adjusted R2 = 0.30, p-value < 0.001; and linear model: Degree ~ imports, adjusted R2 = 0.35, p-value < 0.001). Prominent and stronger links, which signify regular and intense bilateral trade, point to key trade flows and strategic partnerships, or possibly, preferential trade agreements between countries. In the HGTN, which includes 193 diverse traders, we identified 14 distinct clusters (as shown in Fig. 4). The foremost cluster comprises Spain, the USA, Argentina, and China, creating a broad and varied trade sub-network that spans Europe, North America, South America, and Asia. These nations, marked by a higher number of connections, serve as pivotal trade hubs, playing a crucial role in facilitating the exchange of goods and services across multiple regions. Additionally, the second and third most significant clusters include both developed and developing countries, namely Germany, the Netherlands, Canada, France, and Portugal, as well as South Africa, Uruguay, and Namibia. These intricately linked clusters demonstrate specific trading patterns, indicative of either regional trade agreements or the influence of geographical factors on bilateral trade dynamics. Furthermore, the analysis allows for the identification of major export and import pathways, such as the pronounced trade flow from Namibia to Spain, illustrating not only the volume of trade but also the strategic trade relationships between countries.
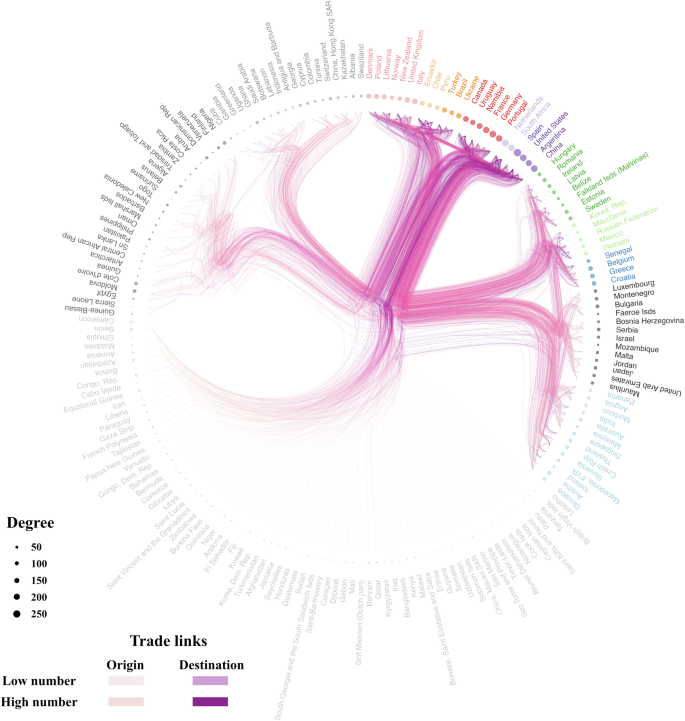
The 193 traders of the HGTN as nodes (circles) and their trade links as lines. The colour and the size of the nodes represent, respectively, the cluster membership and relative importance of the trader in the HGTN, estimated from the number of trade links with other traders (i.e., degree). The colour of the edges represents the origin, destination, and proportion of trade links for all years between each pair of traders. The clusters were made using Ward’s method. The figure was created with R packages: “ggraph” v.2.0.0 and “ggtree” v3.0.2.
The most important hake exporters and importers
Analysis of the top 100 trade mass flows in the international hake market reveals significant insights (Fig. 5). Despite its extensive network, China is not a major mover of large hake quantities or currency. In weighted network analyses, China appears as the least significant partner in the main trading cluster, which includes Spain, Argentina, and the United States. Interestingly, China’s trade is mostly characterised by hake imports from Canada, a unique aspect of its trade pattern. In contrast, Argentina, Spain, and the United States are prominent as the leading producers and exporters of frozen hake, both in terms of weight and value. They have significant export relationships with each other and with other nations like Ukraine, Portugal, Brazil, and Russia. Namibia also plays a key role as a hake producer and exporter, mainly exporting to Spain. Canada is notable too, exporting frozen hake to Ukraine and China. The United States is particularly active in exporting fish to Ukraine and Nigeria, indicating substantial involvement in these markets. Ukraine emerges as a major importer of hake, with minimal exports, likely due to high domestic consumption. Spain serves as a crucial hub, connecting South American and African hake supplies with European markets. It receives significant hake quantities from Namibia, Argentina, and the Falkland/Malvinas Islands, with a considerable portion re-exported to countries like Ukraine, Portugal, Italy, and Serbia. This highlights Spain’s pivotal role in the global hake trade network. Similarly, South Africa acts as a connective node, importing hake from Namibia, Canada, and the US, and predominantly supplying Spain, Portugal, and Italy. The trade dynamics between South Africa and Namibia are noteworthy, with a significant quantity of hake possibly being re-exported after processing or value addition. This analysis underscores the complexity and interconnectedness of the international hake trade, emphasising the crucial roles played by the US, Spain, Canada, and South Africa in shaping the hake trade dynamics.
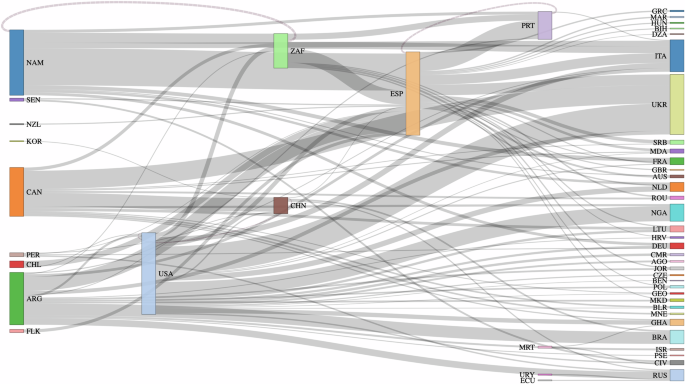
Countries (nodes) are represented by rectangles or text. The size of the rectangle is proportional to the quantity (mass) of hake traded. Arrows or arcs are used to show the flows between them. The diagram shows the 100 largest flows (tonnes) between countries in the world. Countries are represented with the ISO 3166-1 alpha-3 international standard codes. The interactive diagram can be accessed at: https://mares-imedea.shinyapps.io/Hake_Global_Trade_Network/.
The combined volume and value of imports and exports serve as robust indicators of a country’s engagement and intensity in international trade relations. This is encapsulated by the centrality metric known as ‘Strength,’ which denotes the extent of a nation’s active involvement and its influence in bilateral trade dynamics. Countries with a high strength score are key players in the trade network, exerting significant control over the direction and magnitude of trade flows (Figure S4). This measure often correlates with the country’s economic and commercial prominence on a global scale. Key nations in this context include Spain, Namibia, South Africa, the USA, Argentina, and Italy, as detailed in Fig. 6 and Table S2. Spain leads in import volume, with transactions exceeding USD 1.68 billion, while Namibia (USD 1.45 billion), Spain (USD 881 million), and South Africa (USD 800 million) are the top exporters. Other major importers are Italy (USD 739 million), Portugal (USD 553 million), Ukraine (USD 464 million), Brazil (USD 224 million), and South Africa (USD 219 million). The trading relationship between Namibia and Spain was particularly noteworthy, with a total trade volume of USD 826 million from January 2016 to December 2020. Other significant trade flows during this period include Spain to Portugal (USD 338 million), South Africa to Spain (USD 263 million), Argentina to Spain (USD 208 million), the USA to Ukraine (USD 202 million), and Spain to Italy (USD 202 million) (Table S3).
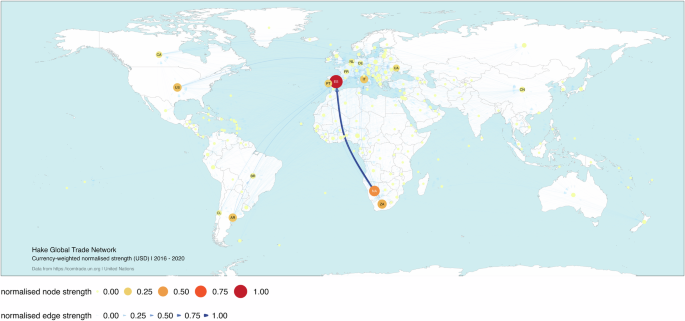
Global Hake Trade Network between Jan. 1, 2016, and Dec. 31, 2020. The numbers correspond to the normalised amount of currency (USD) traded. Each node represents a trader, and each edge represents the relationship between two traders. The size and colour of the node represent the relative importance of the trader in the network in terms of its strength. The width and colour of the edge represent the relative importance of the relationship between two traders in terms of their edge strength. This graph is based on UN Comtrade 030366, 030378, and 030474 commodity codes. The figure was created with R packages: “ggplot2” v.3.2.113, “ggmap” v.3.0.029 and “ggraph” v.2.0.030.
Betweenness centrality: Strategic positioning of countries in trade networks
The network visualisations elucidate the complex structure of the global hake trade from 2016 to 2020. Evaluating the betweenness centrality measure, weighted by the traded mass, the graphic portrays the efficiency of trade connections, accentuating countries that command strategic positions within the network (Figure S5). Spain, the USA, South Africa, Portugal, China, and Italy facilitate cost-effective transactions and maintain competitive market access, irrespective of their trade volume. When the centrality is weighted by trade value instead of mass, a distinct set of countries come to the fore (Figure S6). Spain, South Africa, the USA, Portugal, China, and Canada are particularly prominent, denoting their significant roles in the network by facilitating high-value trade flows. In this refined analysis based on trade value, Spain remains a key intermediary, while South Africa’s position is reinforced, reflecting their enhanced role in high-value trade. Canada’s prominence is more pronounced, indicating their critical involvement in high-value transactions within the global network. These countries’ ability to optimise trade costs becomes even more apparent when considering the monetary aspect of trade connections. Canada emerges as influential node that was not as emphasised in the mass-based evaluation, suggesting their strategic importance in the network’s financial structure. These insights underline a nuanced landscape where some countries hold strategic economic influence, not immediately apparent when only considering the physical volume of trade. Their nodes and connecting edges in the visualisation are marked by their relative size and colour intensity, directly correlating with their pivotal role in the hake market’s value chain (Figure S5, Figure S6 and Table S2).
Page’s Rank as a measure of influence and robustness
Countries with a high Page’s Rank typically exhibit a considerable number of inward relationships (imports) from countries that hold a prominent position in global trade, characterised by a substantial flow of exports and imports. This high Page’s Rank suggests a resilient trade network as the loss of a connection with a partner would have minimal impact on import volumes, thanks to the country’s diversified trade networks (Fig. 7 and Figure S7). Comparative analysis between Page’s Rank weighted by mass and by value for the period from 2016 to 2020 reveals a European dominance in the hake trade network. Spain (in-degree = 47), Italy (in-degree = 38), and Germany (in-degree = 43) demonstrate their strategic trade centrality across both metrics. Notably, Portugal emerges as a central player when value is considered, indicating its significant role in higher-value transactions within the network. The consistent high ranking of Spain, Italy, Serbia, and Germany, alongside Montenegro—predominantly EU countries—underscores EU’s substantial influence in the hake trade market. Serbia and Montenegro maintain their crucial positions, while Côte d’Ivoire, though influential in terms of mass, is replaced by Portugal in the value-weighted ranking, highlighting the different facets of trade importance. These EU nations, forming a core part of the network, illustrate the region’s robust trade architecture, capable of withstanding disruptions and maintaining trade efficiency. Occupying such central positions in the global hake trade network, these countries reinforce the network’s resilience and highlight their strategic economic roles (Table S2, Fig. 7 and Figure S7).
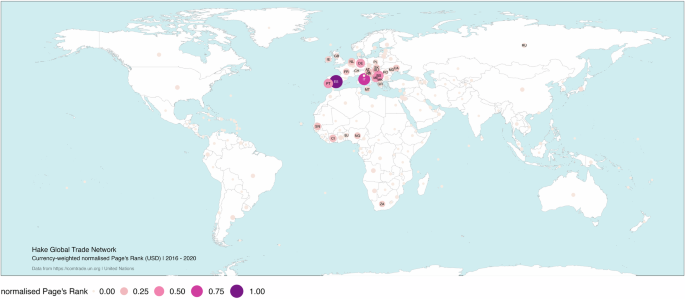
Global Hake Trade Network between Jan. 1, 2016, and Dec. 31, 2020. The numbers correspond to the normalised amount of currency (USD) traded. Each node represents a trader. The size and colour of the node represent the relative importance of the trader in the network in terms of its Page’s Rank. This graph is based on UN Comtrade 030366, 030378, and 030474 commodity codes. The figure was created with R packages: “ggplot2” v.3.2.113, “ggmap” v.3.0.029 and “ggraph” v.2.0.030.
Discussion
Global Population Growth and Marine Food Potential
The urgency to meet the nutritional demands of a rapidly increasing global population, expected to reach 9.8 billion by 205041, cannot be overstated. In this context, the potential of marine foods, including species like hake, emerges as a pivotal element in addressing global food shortages and malnutrition challenges. Studies like Costello et al.42 have highlighted the significant opportunities marine resources offer for supporting food security, particularly in regions facing acute nutritional deficiencies. Marine ecosystems, once thought to be an endless source of resources, have the inherent capacity to augment global food supplies. Specifically, hake species, due to their widespread distribution and significant biomass, have the potential to be a key contributor to this endeavour. Our analysis revealed that 6 out of 22 hake species (including the genus Urophycis) accounted for 94% of total catches from 1950 to 2020, underlining the species’ global significance in fisheries (Fig. 1). However, the contribution of hake to the increase in aquatic food production may be constrained due to the overexploitation and full exploitation of most hake stocks. These species, typically large and long-lived top predators within marine demersal ecosystems, have exploitation rates that are heavily influenced by the historical fishing practices and the health of the ecosystems. Our results showed a notable growth in total hake transactions in both volume and value, although the growth rate has stabilized since 2016 (Figure S3). This scenario raises concerns about the sustainable management of hake fisheries to support future food security.
The contribution of marine foods like hake to global nutrition is also underscored by their high protein content and essential fatty acids, which are crucial for human health. These nutritional attributes make them an ideal candidate for addressing the protein requirements of a growing population. Yet, the declining trend in global hake catches since their peak in the 1970s (Fig. 1) highlight a critical challenge in harnessing this potential. The decline in hake catches is juxtaposed with the increasing demand for protein-rich foods globally. As human diets evolve with growing economic prosperity in various regions, the demand for seafood is expected to rise, further straining the already overexploited marine resources43. This scenario presents a complex challenge: balancing the need for increased marine food production with sustainable fishing practices to ensure the long-term viability of these resources.
As we move towards a future where food security becomes increasingly critical, it is imperative to adopt sustainable marine resource management strategies. These strategies should not only focus on optimising yield but also on preserving marine biodiversity and ecosystem health. The sustainable management of hake fisheries, therefore, becomes a case study within of the broader challenge facing global marine food resources. Efforts to increase aquatic food production through advances in fisheries, aquaculture, and mariculture are promising43. However, these need to be coupled with stringent conservation measures and effective management policies to address the dual challenges of food security and environmental sustainability.
Hake Overexploitation and Sustainability Challenges
The sustainability of hake populations is a critical concern in the face of escalating global demand for seafood. A simple visual examination of hake fisheries production data reveals that despite their considerable contribution to marine food resources, hake species contend with the dual challenges of overexploitation and catch fluctuation (Fig. 2). Significant spikes and subsequent declines in hake catches are observed across various regions, including South America in the early 2000s (Fig. 2b), Southern Europe in the late 1990s (Fig. 2c), Southern Africa in the late 1960s (Fig. 2d), Eastern Asia in the 1960s and 1970s (Fig. 2e), and the Australia and New Zealand subregion around 2006 (Fig. 2f). These shifts could suggest overfishing but also warrant consideration of additional potential factors, such as changes in regulations, enforcement of quotas, conservation efforts, and ecological dynamics that could influence these trends. These patterns are concerning as they directly impact the species’ demography and, consequently, their reproductive viability and population health9. For instance, in 2019, South Pacific hake (Merluccius gayi) and Southern hake (Merluccius australis) were identified as overfished. Additionally, silver hake (Merluccius bilinearis) and white hake (Urophycis tenuis) failed to show a significant recovery in the Northwest Atlantic. Moreover, European hake (Merluccius merluccius) in the Mediterranean and Black Sea exceeded biologically sustainable limits9.
The patterns observed in hake fisheries mirror a broader trend in global fisheries, where overexploitation often results in reduced catches and jeopardises long-term sustainability44. This is particularly evident in the EU context, where our analysis shows a consistent decline in hake catches since the early 1990s, with Spain recording the highest volume of catches (Table 1, Fig. 2c). Such trends point to the need for re-evaluating current fishing practices and implementing more sustainable approaches. In addition to the ecological impacts, overexploitation has significant economic ramifications. The stability of hake catches has led to fluctuations in market prices and supply uncertainties, affecting the livelihoods of those dependent on these fisheries. The observed stability and subsequent decline in hake catches, particularly in regions like Europe, have economic implications that extend beyond the fishing industry, impacting food security and trade dynamics globally45.
The ecological consequences of overfishing are not limited to the species targeted. The removal of top predators like hake can lead to trophic cascades and imbalance in marine ecosystems46,47. This highlights the interconnectedness of marine species and the importance of maintaining ecological balance to ensure the sustainability of fisheries. Addressing these challenges requires a comprehensive approach that encompasses both regulatory measures and community engagement. Effective fishery management policies, including catch limits, size restrictions, and closed seasons, are essential to prevent overfishing and allow stock recovery48. Additionally, promoting responsible fishing practices and raising awareness about the importance of sustainable seafood consumption are vital steps towards mitigating the overexploitation of hake and other marine resources49.
In this context, the concept of “sustainable commoditization” as proposed by Belton, Reardon, and Zilberman50 becomes particularly relevant. They advocate for a model where seafood production not only meets the growing global demand but does so sustainably by integrating efficient production processes with sustainability principles. This approach aims to balance food security needs with environmental conservation, emphasizing the development of robust supply chains and regulatory frameworks that support sustainable practices across the Global North and South. Such strategies are vital to ensuring that seafood commoditization contributes to economic growth while minimizing negative environmental impacts.
Global Trade Dynamics and Dependency
The global trade dynamics of hake have evolved significantly over the past decades, reflecting broader changes in the seafood industry and international market dependencies. Our study indicates that Europe, particularly Spain, has emerged as a dominant importer in the hake market, underscoring a major shift in global seafood trade (Figure S1 and Figure S2). Furthermore, hake are often harvested in multispecies fisheries utilizing non-selective methods like bottom trawling. This shift highlights the growing dependence of developed countries on seafood imports to satisfy domestic demand, a trend that has been steadily increasing due to declining local catches and heightened consumer preferences for diverse seafood products45. In the case of Spain, only 8% of the hake consumed in this country is caught in its territorial waters27.
The intensification of international trade, especially in hake, has been driven by a range of factors, including overfishing in traditional fishing grounds, regulatory changes in fisheries management, and the globalisation of food systems. The effect of overexploitation in developed countries has led to reforms aimed at reducing fishing pressure and rebuilding fish stocks. This globalisation of food commodities creates opportunities for the import of essential nutrients, especially in developing countries where domestic resources may be limited1,2. However, as our findings show, these reforms have also resulted in a reduced domestic seafood production, thereby increasing the reliance on imports from other regions, especially from countries like Namibia, Argentina, and South Africa (Table 2, Figs. 2c and 4). Additionally, nutrient flows do not always align from countries with surplus nutrient production to those with deficits. In low and lower-middle-income countries, the role of trade in filling nutrient gaps is generally marginal and cannot reliably compensate for domestic shortfalls51.
This increased dependency on imports has significant implications for global trade dynamics. The rise in import and export activities across all regions from 2016 to 2018, followed by a decrease from 2019, reflects not only the fluctuations in hake availability but also the impact of global events such as the COVID-19 pandemic (Figure S2, Figure S3). Developed countries, in their quest to maintain high seafood consumption levels, have thus turned to developing nations to bridge the gap in domestic supply. This trend is particularly evident in Europe, where imports have far outnumbered exports, creating a heavy reliance on hake sourced from other parts of the world.
The transition from domestic production to increased imports in developed countries has created a complex network of trade relationships. As our cluster analysis reveals, countries like Spain, Argentina, and the USA have become central nodes in this network, facilitating significant trade flows across continents (Fig. 4). These countries, due to their strategic geographical locations and historical trade links, play a crucial role in the global hake market, influencing both the supply and pricing of hake internationally.
Moreover, the global trade in hake is not merely an economic transaction but also a reflection of geopolitical relationships and regional alliances. Countries with a high degree of network intermediation, such as Spain, have been able to leverage their trade relationships to secure a steady supply of hake, thereby influencing global market dynamics (Fig. 3 and Figure S5). This scenario underscores the interdependence of nations in the modern era, where international trade acts as a critical facilitator connecting diverse regions and influencing food and nutrition security1,2. However, this increased interdependence also raises concerns about the resilience of global food systems to shocks, such as ecological disruptions or political changes. The fluctuations in trade volumes and the uneven distribution of trade benefits highlight the vulnerability of countries, particularly those heavily reliant on seafood imports, to external factors.
Economic Disparities and Trade Benefits
The global hake trade exhibits significant economic disparities, manifesting an uneven distribution of benefits among nations. Our analysis reveals a clear correlation between a country’s economic status, as measured by GDP, and its role within the hake trade network, influencing the distribution of trade benefits (Fig. 3). This pattern underscores a broader dynamic in global trade, where wealthier nations frequently secure superior positions, enabling them to access resources and maximize trade opportunities effectively. Developed countries, particularly those with robust economic and trade infrastructures such as Spain, have substantially benefited from the hake trade. Their prominent role as major importers in the global market (Figure S1 and S4) not only ensures a consistent seafood supply but also grants them considerable influence over global market prices and trade policies.
Conversely, developing nations, despite their significant contributions to the global hake supply, often occupy a less favourable position. For example, Watson et al.10 highlight that lower-income countries export high-value seafood to alleviate poverty and ensure food security by importing lower-value seafood. This strategy reflects deliberate trade adjustments aimed at achieving broader economic and social goals, such as poverty alleviation and enhancing food security. However, this exchange of nutrients between nations presents challenges, particularly for low and lower-middle-income countries. They struggle to offset domestic nutrient deficits through imports, a dilemma that frequently results in irreversible nutritional shortfalls51.
Countries like Namibia and Argentina, which are key hake exporters, face the challenge of balancing their economic growth with the sustainability of their natural resources. The export-driven approach of these nations, while beneficial in the short term, raises concerns about the long-term impacts on their fisheries and local economies (Table 2, Fig. 3, Figure S1). Moreover, the reliance of developing countries on export revenues from hake trade can make them vulnerable to market fluctuations and external economic pressures. The disparities in the hake trade network also reflect a broader issue of inequitable resource distribution in global trade. While some countries reap significant economic benefits, others struggle to gain equitable access to resources and markets. This imbalance poses a challenge to achieving sustainable and inclusive growth in the global seafood industry.
Moreover, the socio-economic impacts of the seafood trade, especially on small-scale fisheries, highlight significant inequities in benefit distribution. Drury O’Neill et al.52 have shown that although the seafood trade generates considerable economic value, the benefits are disproportionately skewed towards actors higher up in the value chain, such as processors and retailers, rather than local fishers. This disparity underscores the need for market structures that foster fair trade practices and bolster the livelihoods of small-scale fishers, who play a vital role in the sustainability of marine resources.
Trade resilience and food security
The resilience of global trade networks, especially in the realm of hake trade, is integral to sustaining food security. Our study highlights those countries like Spain, which have diversified their trade networks, exhibit greater resilience against disruptions in the seafood market (Fig. 7). This resilience is vital in ensuring a consistent supply of food, particularly in areas heavily reliant on seafood imports for nutrition. The relationship between trade resilience and food security is intricate, influenced by geopolitical, ecological, and economic factors that impact trade stability.
The COVID-19 pandemic, for instance, presented significant challenges but also catalysed innovative adaptations in the seafood industry. Love et al.53 documented how disruptions, while causing substantial losses, also fostered innovative responses such as the adoption of direct-to-consumer sales platforms. These innovations not only buffered against global disruptions but also opened new opportunities for market expansion. Stoll et al.54 further observed the effectiveness of alternative seafood networks during the pandemic, proposing them as models for a more resilient seafood trade system. In response to these challenges, developed regions are expected to shift towards more self-reliant seafood trade models, while developing regions might struggle due to their dependence on seafood exports, a scenario discussed by Wei et al.55.
Our findings indicate that countries with prominent roles in the hake trade network, such as Spain, Italy, and Germany, demonstrate strategic trade centrality crucial for a stable food supply (Table S2, Fig. 7, Fig. S7). Their capacity to maintain steady import volumes despite potential trade disruptions underlines the importance of establishing robust and varied trade connections.
Moreover, our analysis of the hake trade network underscores the importance of regional trade clusters and mutual trade agreements in enhancing food security. Countries within these clusters, often bound by cultural ties and historical trade relationships, benefit from a fairer distribution of resources and improved self-reliance. This aspect is particularly important for low or lower-middle-income countries facing acute food security challenges. Yet, the global hake trade is not immune to shocks, such as ecological disturbances or political shifts. These events can cause ripple effects on food prices and availability, impacting both exporters and importers. The vulnerability of global trade to such disruptions emphasises the necessity for adaptive and resilient trading systems capable of responding to and mitigating potential impacts on global food security3,4,8,20. Additionally, there is a growing need to re-evaluate international trade rules and shift towards shorter-distance trade, which emphasizes exports and imports between proximate countries within the same continent. Intra-regional trade remains vital for low and lower-middle-income countries. Enhancing regional integration through bilateral and regional trade agreements and investments in regional connectivity could improve nutrient adequacy at the regional level51.
Adapting Hake Fisheries to Global Shifts: Challenges and Strategies
The global hake market, deeply impacted by shifting dynamics such as the COVID-19 pandemic, has seen significant trade volume fluctuations27. This volatility highlights the fragility of international seafood markets and underscores the need for resilient supply chains. In developing countries, particularly in regions like Namibia, the challenge extends to balancing lucrative international trade with addressing local nutrient deficiencies, as emphasised by Hicks et al.56. The sustainable exploitation of local hake populations could significantly contribute to meeting the nutritional needs of coastal communities reducing the dependency of local food security from global markets stability.
Moreover, the complexity of global hake trade is magnified by bilateral and private fisheries agreements, which often dictate seafood transfer patterns, influencing both global and local market dynamics45. These agreements, along with the broader trade policies, play a significant role in shaping the accessibility and sustainability of hake fisheries.
Considering these challenges, aligning hake fisheries management with the Sustainable Development Goals, particularly the Zero Hunger Goal, becomes crucial. This alignment necessitates a balanced approach, ensuring that the exploitation of hake stocks for international trade does not compromise the ecological sustainability and food security of local populations.
Conclusions
This study has elucidated the multifaceted nature of the global hake trade and its implications for food security and sustainability. Our analysis underscores that while the hake trade offers significant opportunities for addressing global food shortages, it is fraught with challenges related to overexploitation, sustainability, and economic disparities. The increasing global population and the rising demand for nutritious food sources make the sustainable management of hake fisheries more critical than ever41,42,43.
The findings reveal a complex interplay between global trade dynamics, economic disparities, and trade resilience, each contributing to the broader narrative of food security. Developed countries, especially those like Spain, have emerged as significant players in the hake market, influencing trade patterns and resource distribution globally ([45; Fig. 5). Meanwhile, the dependence on hake imports in these countries underscores the need for diversified and resilient trade networks to mitigate the risks associated with market and ecological disruptions.
In conclusion, the hake trade exemplifies the challenges and opportunities inherent in global seafood markets. Sustainable management practices, equitable trade policies, and resilient trade networks are imperative for ensuring the long-term viability of hake fisheries and contributing to global food security. This study highlights the need for a collaborative approach to address these challenges, involving stakeholders across the spectrum, from fishers to policymakers.
Responses