Global warming risks dehydrating and inflaming human airways

Introduction
Many human respiratory diseases, including asthma, allergic rhinitis, and influenza, become exacerbated on exposure to extreme atmospheres1,2,3. Such atmospheres can include air that is cold (<0 °C)4, hot (>35 °C)5 or dry (<40% RH at any temperature)6. While seemingly dissimilar, these atmospheres share in common the risk of exposing human upper airways to high vapor pressure deficit, or VPD7.
VPD is a thermodynamic atmospheric property that characterizes water evaporation propensity8, or “air dryness.” Defined as the difference between water saturation pressure and vapor pressure9, VPD grows (Fig. 1A) with rising temperature (T, °C) at fixed relative humidity (RH), which is a condition that has characterized the earth’s atmosphere over the last century of global temperature rise10.

A Water saturation and vapor pressure versus temperature for air with 40% RH. A rise in temperature from 20 °C to 40 °C results in a rise of VPD of 1.52 kPa at constant 40% RH. B Laryngeal VPD (Δ) ranges (ellipses) following nasal and mouth breathing of cold and hot air. Nasal tidal breathing generally assures laryngeal RH of 90% or greater19, keeping upper-airway Δ low (<0.5 kPa). C Given the direct exposure of the larynx to atmospheric conditions on mouth breathing, global warming raises the risk of high laryngeal Δ and inflammatory compression of laryngeal-tracheal epithelial cells by transpiration. Original artist drawing by Heejin Gregory. D Transpiration occurs when the rate of diffusion of soluble mucin molecules is near to or less than the rate of evaporative convection, such that mucin gathers near the evaporating surface, overlaps and gels. The Penman-Shuttleworth71 equation provides a relationship between (the time-averaged) evaporation rate, Δ and air velocity associated with the jet of air that forms in the larynx on inhalation, which increases with ventilation rate (VR). The ratio of evaporative convection to mucin diffusion is defined by the Peclet number, Pe. As Pe nears and surpasses unity, transpiration occurs, making Pe a kind of “transpiration” number. See Supplemental Note 1.
Rising atmospheric VPD with global warming11, amplified by extreme weather events12, stresses cellular matter within leaves, which evaporate water by a process called transpiration13. During transpiration, water evaporates over the surface of a hydrogel membrane. Macromolecules within the hydrogel accumulate by convection near the evaporating surface to generate osmotic pressure differences that can, in the case of the leaf, attain thousands of atmospheres14. Such large osmotic pressure gradients pull water from distant roots15 in proportion to local VPD (Fig. 1A) while compressing cells within the leaf up to a threshold VPD, above which the stomata close and the leaf typically wilts16.
Recently, we have observed that water evaporates from upper airway mucosa by this same process of transpiration17. Epithelial cell compressions above 1 kPa are predicted18 to occur upon exposure to the larynx of VPD > 1.5 kPa. Such high laryngeal VPD is rarely attained on nasal breathing19, while can be achieved on the mouth breathing20,21 of typical indoor cooled or heated air (see Fig. 1B). With the growing prevalence of chronic mouth breathing in the human population owing, in part, to obesity22, allergic rhinitis23, and aging24, the mucus transpiration hypothesis raises the possibility of a global warming threat to human respiratory health.
The hypothesis that mucus transpiration may be a source of inflammation in human airways is grounded on the assumption that healthy airway mucus, a dilute solution (Fig. 1D) comprising salts (0.9% w/w), globular proteins (~ 1.1% w/w) and mucin macromolecules (~ 0.5% w/w)25, exhibits the transpiration behavior of cross-linked hydrogels, as has been studied for over a century since Darwin26. We aimed to test this hypothesis, specifically whether mucus transpiration occurs, and might be a source of the kPa compressions that have previously been observed to inflame airway epithelial cells and contribute to the pathogenesis of chronic respiratory disease27. On the basis of our theoretical and experimental findings, we used climate model simulations28 to explore future human airway inflammation consequences in the Continental United States.
Results
Upper airway mucus exhibits transpiration behavior
Water evaporates from the larynx and trachea as from a relatively flat layer of water (Fig. 1D). Evaporation rate q (m/s) grows proportionally with laryngeal VPD (Δ) (kPa) and ventilation rate VR (L/min) (Fig. 1). Evaporation ebbs and flows with the ebb and flow of breathing, while, on time-average, over many identical breaths, water moves at a steady rate through airway surface liquid (ASL) from airway epithelia toward the airway lumen. This motion occurs at the average rate, q, of evaporation itself, such that ASL volume is conserved in normal, healthy, hydrated airways (Fig. 1D). Analyses of inhaled air conditioning20,29 generally characterize ASL transport per generation in this single dimension of evaporative water movement, as do airway-liquid-interface (ALI) culture models2,25,27, given that lateral movement by mucociliary clearance is relatively slow. Explicit values for Δ and q as a function of temperature and relative humidity are provided in Table 1 for breathing conditions relevant to human airways. In the dilute conditions of healthy hydrated mucus, the time-averaged steady-state water motion toward the evaporating surface of the upper airways drags macromolecules, including globular proteins (mass fraction φ* ~ 0.01) and mucin strands (mass fraction, φ* ~ 0.005)25, toward the airway surface from the periciliary layer (PCL), and to a degree that is characterized by a Peclet number Pe (= qh/D), with h the mucus thickness (~20 um at the reference state) and D the diffusivity of the particular macromolecule at infinite dilution. This convective drag can be shown by continuum mechanics to yield (see Supplemental Note 1) a remarkably simple relationship for the osmotic pressure drop across the mucus as a consequence of water evaporation
with π* the osmotic pressure of the uniform layer concentration, φ*, as well as the following relationship for the total pressure elevation within the ASL relative to the non-evaporative state (*) [δP = P(q) – P*(q = 0)] (Supplemental Note 1)
Mucus transpiration therefore results in an ASL pressure elevation, altering mucus structure and compressing airway epithelia, in all human breathing conditions other than slow nasal breathing. In the slow nasal breathing case, for which the laryngeal evaporation rate q ~ 0.02 μm/s, the Pe values for the most sluggish of mucus macromolecules (D ~ 2 × 10⁻¹² m2/s) are small (Pe = 0.2), such that slow nasal breathing can be considered as a reference “non-evaporating” state.
Mucus transpiration is predicted to thin airway mucus and compress airway epithelia
We sought to determine ASL structure evolution and ASL compression δP relative to the non-evaporating (or slow nasal breathing) state (*) in a range of VPD human breathing conditions by analytical and numerical solution of the full underlying continuum mechanic equations as described in Supplemental Note 1.
Given that globular proteins tend to diffuse in crowded biological systems in a manner closely resembling the diffusion of hard spheres30, we used a hard-sphere model of diffusion in concentrated systems31 to evaluate the steady-state stratification behavior of globular proteins. We used this same model to analyze the hard-sphere stratification of larger pathogen- and mucin-sized nanoparticles, including mucin itself below its overlap mass fraction (φc ~ 0.006)24. Above the mucin overlap mass fraction, where mucin exhibits the “sticky” behavior of a reversible hydrogel32, we used a small-deformation hydrogel network model (previously shown to qualitatively describe transpiring hydrogel behavior)13 to evaluate steady-state mucin stratification for small mucin-hydrogel deformations. Our principal results are presented in Fig. 2.
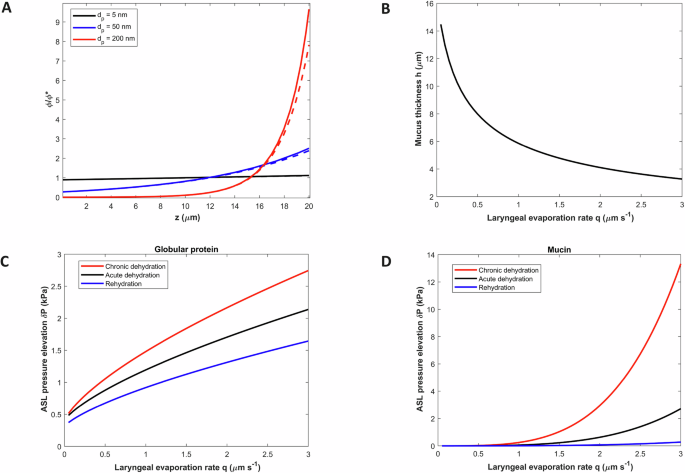
A Mass fraction φ versus diffusing sphere size and distance from the PCL (z = 0) for q = 1 μm/s. Dashed lines represent predictions based on low Pe analytical predictions (Supplemental Note 1). B Steady-state, time-averaged mucus thickness as a function of laryngeal evaporation rate. C Total pressure elevation of ASL (relative to the base case) due to globular protein osmotic pressure increase for cases of: chronic dehydration (MUC5AC predominated, mucin hydrodynamic diameter 300 nm) (35); acute dehydration (MUC5B predominated, mucin hydrodynamic diameter 200 nm); rehydrated mucus assuming 10% topical deposition of 5% hypertonic salt aerosol72. D Total pressure elevation of ASL due to mucin osmotic pressure gradient versus laryngeal evaporation rate for the same 3 cases as stated above.
Figure 2A illustrates the stratification of macromolecules (modeled as spherical nanoparticles) near the evaporating mucosal surface for circumstances reflecting fast tidal mouth breathing of cold dry air (Methods). Very small spheres with diameter characteristic of a globular protein (5 nm) aggregate very little owing to their high mobility. However, the more sluggish particle with diameter characteristic of a mucin strand (200 nm) strongly accumulates near the evaporating surface (Fig. 2A), and in a manner closely approximated by the (small Pe) analytical formula φ/φ* ~ exp[Pe(z/h)] (Supplemental Note 1). Above a critical height zc where overlap (φ = φc) occurs, mucin exhibits reversible hydrogel behavior. This increases osmotic water pull through the mucin hydrogel layer relative to the dilute layer and rapidly thins the dilute layer on a timescale D/q2 in the range of seconds to a minute. The accumulation of mucin mass near the evaporating surface further thins or “squeezes” the hydrogel, by mucin mass conservation, leading to a steady-state mucus height (Supplemental Note 1)
where Pe0 = qh0/D, and h0 is the non-evaporating height. For very small evaporation rates (q ~ 10−8 m/s, Pe0 <<1) Eq. 3 simplifies to leading order to h ~ (φ*/φc) h0, expressing a loss of thickness that reflects evaporation of the dilute mucin layer. In the case where macromolecule concentration is elevated in the mucus layer, as occurs in diseases such as cystic fibrosis, chronic obstructive pulmonary disease, and asthma, φ*> φc, Eq. 3 applies by setting φ*/φc = 1. The height loss (φ*/φc) h0 occurs on a time (t) scale far shorter than the relaxation time scale (τ) of mucus squeezing, which, as elsewhere13, we assume to follow a simple relaxation process
Figure 2B presents the steady-state mucus height h(q) [Eq. 3] for the full range of laryngeal evaporation rates relevant to human breathing in the normal airway mucus case. Compression of the mucus due to mouth breathing of dry air augments the mass fraction of globular proteins, increasing the globular protein osmotic pressure π*(h0) = π0 to π*[h(q)], where π*[h(q)] = π0(h0/h). Water mass transported osmotically into the mucus layer as a consequence of this increased globular protein mass fraction is evaporated on the time scale D/q2 given the higher water velocity in the mucin hydrogel relative to the dilute mucin layer. Globular protein mass fraction therefore remains elevated and osmotic compression δP of airway epithelia is sustained. The disappearance of the dilute layer adds further compressive stress by the mucus hydrogel acting on the elastic cilia and osmotically active tethered mucin within the PCL.
Figure 2C presents the osmotic globular protein compression (see Methods) across the full range of evaporation rates for: an acutely dehydrated case, a chronically dehydrated (or diseased) case, and a rehydrated case. Epithelial cell compression elevation δP exceeds the inflammatory 1 kPa threshold for the condition of chronic dehydration at q ~ 0.5 μm/s (normal tidal mouth breathing of air <30% RH), and for acutely dehydrated airways, at q ~ 0.7 μm/s (fast tidal mouth breathing of similarly dry air). With rehydration of the mucus layer, compression δP remains below the inflammatory 1 kPa threshold in all tidal breathing conditions (q < 1 μm/s) (Fig. 2C). These same cases are shown in Fig. 2D for the (direct) mucin contribution to δP (see Methods). Mucin aggregation dominates compression of upper-airway epithelia (Fig. 2D vs 2 C) in strenuous exercise conditions (q > >1 μm/s), reaching, in conditions reflecting diseased airways, or chronically dehydrated airways during exercise in cold and hot air (Table 1), an ultra-high epithelial cell compression of 3 kPa associated with bronchoconstriction33. Rehydration reduces compression in all cases.
Given the reduced mucociliary clearance rates that accompany airway dehydration34, we preliminarily explored (see Supplemental Note 2) whether the acute capture and retention of inhaled airborne particles might promote acute inflammation, concluding that, while unlikely on the normal tidal mouth breathing of even very dirty air, acute inhalation of smoke from the burning of biomass fuels or aerosolized nanoparticle drugs and vaccines might easily promote large acute inflammatory stresses (Supplemental Note 2).
Airway epithelia exhibit inflammatory mucus transpiration behavior in vitro
We sought to compare predicted mucus transpiration behavior with experimental data gathered by exposing a cell culture model of the human bronchial epithelium, comprising normal human tracheo-bronchial (HTB) cells grown at an air-interface, to air at 37 °C and variable states of dryness (30%, 60%, and 95% RH, corresponding to VPD 4.40 kPa, 2.51 kPa, 0.31 kPa) for 2 h in a humidity-controlled confocal microscope chamber with minor air circulation (Methods). We repeated the same experiment for HTB cells with concentrated mucus φ* > φc to deduce, by comparison, the implicit behavior of the mucus height h(q) (Methods). Our results are presented in Fig. 3.
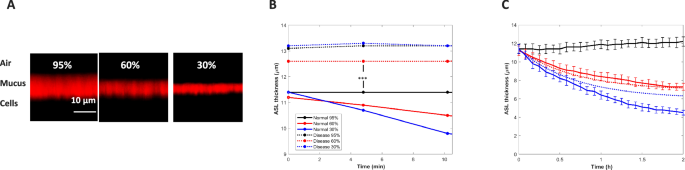
A XZ-confocal microscope images of the ASL (stained with 0.01% Texas Red-dextran, 70 kDa) over HTB cells with a normal (10 mg/ml total organic solids), non-diseased, mucus layer after 2 h of exposure to 95% (0.3 kPa), 60% (2.5 kPa) and 30% RH (4.4 kPa). B Comparison of the short-time behavior of ASL height for normal versus diseased (39 mg/ml total organic solids) mucus layers (*** p < 0.001, comparison of average diseased versus normal heights at all RH combined, using a two-tailed t test).These heights permitted estimation of initial mucus height as follows: PCL/osmotic pressure measurements (Methods) revealed an initial PCL thickness hPCL ~ 6.8 μm (at the lowest osmotic pressure of 100 Pa). Measured PCL height diminished (Methods) with increasing osmotic pressure as reported elsewhere (11). Since the concentrated mucus HTB cell system experiences no dilute layer height loss at short times (t << τ), the initial ASL height is hASL ~ h0 + hPCL, from which it follows that h0 ~ 6.2 μm (13.0 μm–6.8 μm). For the normal airway mucus system, it follows from Eq (5) that hASL ~ (φ*/φc)h0 + hPCL yielding φ* ~ 0.0044. The latter theoretical value for the normal airway mucin mass fraction is within the expected range. C Measured time-course of normal human mucus height change at the three VPD conditions with theoretical predictions (dashed lines, τ = 0.5 h). Black = 95%RH, Red = 60%RH, Blue = 30%RH.
Following 2 h of exposure, the normal ASL layer [combining the mucus layer, of thickness h(q) and the PCL of thickness hPCL(q)] thinned as VPD increased (Fig. 3A). At all states of air dryness an immediate loss of height appeared in the normal ASL layer (mean 11.3 μm) compared to the concentrated (more slowly thinning) mucus layer (mean 13.0 μm) as revealed by the early-time behavior of ASL thinning t <<τ (Fig. 3B). To determine the contribution of PCL height loss to overall ASL height loss, we directly measured PCL height in the HTB cell system as a function of mucus osmotic pressure (see Methods). Figure 3C presents the full time course of normal ASL thickness change for the 3 VPD conditions of the experiment. Theoretical predictions are based on predicted values of h(q) (given φ* = 0.0044) from Eq. 3 at the evaporation rates of the 60% RH (q = 0.12 μm/s) and 30% RH (q = 0.21 μm/s). Predicted values of hPCL follow from the measured hPCL values at the osmotic pressures for the corresponding evaporation rates. The values of h(q) and hPCL(q) were assumed to follow the same relaxation process of Eq. 4 with τ = 42 min. Closest alignment between theoretical predictions and experimental results is observed at lowest deformation (60% RH case), consistent with the small-deformation approximation of the theoretical analysis and its lack of accounting for mucus hydrogel compression of the PCL at high evaporation rate.
We hypothesized that the mucus thinning observed in Fig. 3 would result in elevated inflammatory cytokine secretion at the lowest RH, given that the predicted ASL compression at 30% RH is in the range for which secretion of inflammatory cytokines has previously been reported27—notably ~ 1 kPa @ 30% RH (q = 0.21 μm/s), in comparison to ~ 450 Pa @ 95% RH (q = 0.04 μm/s) and ~750 Pa @ 60% RH (q = 0.12 μm/s).
To test this hypothesis, we exposed normal HTB cells grown at an air-interface to 37 °C air for 3 h at RH of 95% (Δ = 0.3 kPa), 60% (Δ = 2.5 kPa) and 30% (Δ = 4.4 kPa) in a transwell system. We measured basolateral concentrations of IL 1-β, TNF-α, IL-33, IL-6, and IFN-γ at time points of 0 h, 1 h, 2 h, and 3 h (Methods). Table 2 summarizes the results of these experiments.
Cytokine levels trended higher at all RH/VPD conditions over the first 3 h of dry air exposure (Table 2). Highest mean concentrations for all cytokines occurred at the 30% RH (~ 1 kPa cell compression) condition at 3 h (Table 2). TNF-α and IL-6 mean concentrations changed significantly from 1 h to 3 h (p < 0.05) at all three VPD conditions within each group. Increase in both cytokine concentrations at 30% RH exceeded increase at 60% RH [TNF-α (p = 0.001), IL-6 (p = 0.02)]. TNF-α elevation at 30% relative to 95% was also significant (p = 0.02) while IL-6 concentration elevation at 30% RH did not statistically different from IL-6 increase at 95% RH (p = 0.82). IL-33 concentration increased significantly (p = 0.006) at 30% RH from 1 h to 3 h, with marginal (insignificant) increases at 95% RH (p = 0.05) and 60% RH (p = 0.15). IL-1β had only marginal (insignificant) increase from 1 h to 3 h of exposure at 30% RH (p = 0.15). IFN-γ increases from 1 h to 3 h at all three RH conditions were insignificant. Changes in cytokine secretion are presented for each sample in each group in the Supplemental Material. Changes in cytokine secretion are presented for each sample per group in the Supplemental Material. Exposing the ALI cultures to the highest (4.4 kPa) and lowest (0.3 kPa) VPD conditions for 3 h resulted in minor cell death and no differences between the groups (see Supplemental Fig. 2).
Intermittent tidal breathing of dry air inflames hypersensitive airways in vivo
We sought to determine whether the inflammatory consequence of mucus transpiration as theoretically predicted and observed in our in vitro experiments, would be revealed during intermittent normal tidal breathing of air with VPD > 3 kPa in a mouse model. We chose to compare wild-type (WT) mice with mice genetically-modified (Scnn1b-Tg)35 to exhibit airway surface dehydration, mucus stasis, and inflammation commonly associated with chronic respiratory diseases. Adult WT and Scnn1b-Tg littermates (n = 5/group) were exposed to short intervals (15 min each) of room-temperature air (25 °C) either at 46%–57% RH or dry air (<20% RH, VPD > 3 kPa) twice a day for 14 days (Methods). Twenty four hours after the last exposure, lung tissue (left lobe) and bronchoalveolar lavage (BAL, right lobes) were collected for evaluation of histopathology and differential cell counts as previously described35. Figure 4A–I summarizes the principal results of these studies. BAL differential cell counts suggested a sporadic but substantial influx of eosinophils and lymphocytes in the lungs of Scnn1b-Tg mice exposed to dry air (Fig. 4A–D) as compared to Scnn1b-Tg mice exposed to standard air conditions. WT mice did not exhibit any inflammatory cell infiltration or histological change upon this dry air exposure regimen. Scnn1b-Tg mice exposed to dry air were more likely (3 of 5 littermates versus 0 of 5 littermates for all) to exhibit focal, parenchymal consolidation (Fig. 4F) consistent with eosinophilic crystalline pneumonia36 (Fig. 4G–I) which has previously been associated with aggravated inflammation in the Scnn1b-Tg mouse model35 and is consistent with the increased incidence of eosinophilia in Scnn1b-Tg BAL upon dry air exposure. Dry air exposure did not impact mucous cell metaplasia, i.e., intraepithelial mucus, or airway mucus plugging as measured by quantitative morphometry37. in the conducting airways of Scnn1b-Tg mice (Fig. 4E). Altogether, these findings suggest that repetitive exposure to dry air, although for short intervals, can elicit inflammatory responses in vivo, as suggested by our in vitro experiments (Table 2), and to greatest degree for dehydrated airways, as suggested by our theoretical predictions (Fig. 2C).
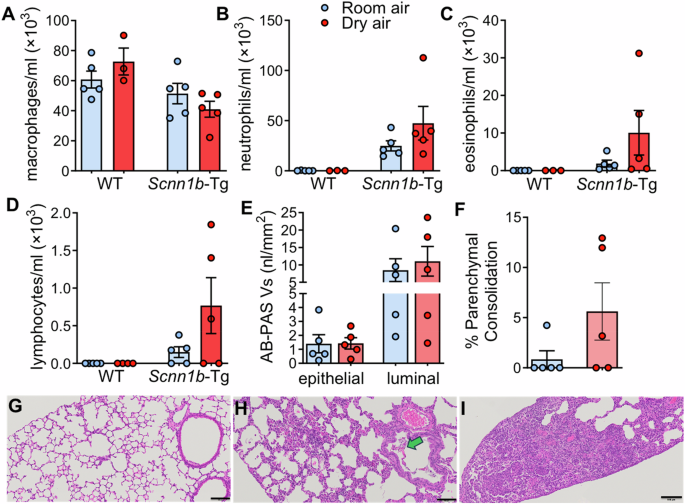
A–D Differential cell counts in BAL from Scnn1b-Tg (n = 5) and WT (n = 5) littermates exposed to normal and dry air. E Morphometric quantification of intraepithelial and luminal AB-PAS+ mucus volume density in the conducting airways of Scnn1b-Tg exposed to room or dry air. F Morphometric analysis of parenchymal consolidation in Scnn1b-Tg exposed to room or dry air. G–I Representative micrographs of absent (G), moderate (H) and severe (I) parenchymal consolidation in Scnn1b-Tg exposed to dry air. These lesions are consistent with eosinophilic crystalline pneumonia (YM1/YM2 chitinase crystals, green arrow). Scale bars = 0.1 mm.
Rising VPD with global warming increases human airway inflammation risk
Given our theoretical and experimental findings, we sought to assess the increased risk of breathing-induced inflammation of human airways as a consequence of rising VPD accompanying global temperature increase by performing a land-only simulation for the continental US. We conducted a 40-year historical experiment (1980–2019, called Recent Past) and future experiment (2060–2099, called Late 21st century) under the Representative Concentration Pathway (RCP) 8.5 scenario28 (see Methods). Our findings are shown in Fig. 5.
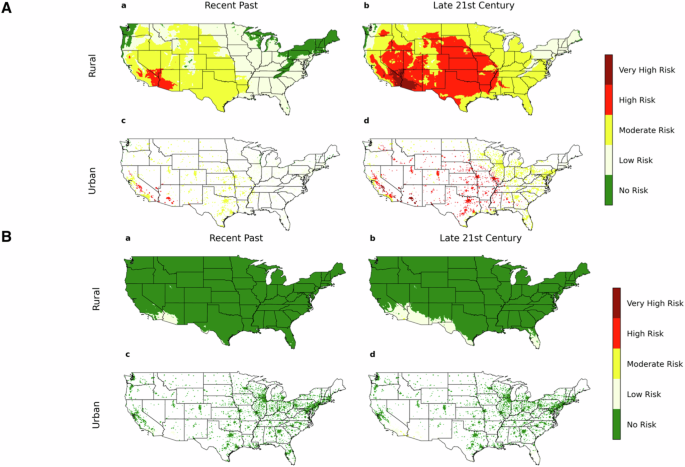
Projections of environmental (outdoor air) VPD for the continental US over the time periods 1980–2019 (Recent Past) and 2060–2099 (late 21st century) based on a climate model simulation. Numerical simulations for urban/rural VPD are carried out using CESM version 2.1.328 as further described in the Methods. A Summer months (June, July, August) for (a) recent past and (b) late 21st century in rural and urban regions are compared with (B) winter months (December, January, February) for (a) recent past and (b) late 21st century. Dark green denotes no risk (VPD < 750 Pa), light yellow denotes low risk (750 Pa <VPD < 1.5 kPa), dark yellow denotes moderate risk (1.5 kPa <VPD < 3.0 kPa), red denotes high risk (3.0 kPa <VPD < 4.5 kPa) and dark red denotes very high risk (VPD > 4.5 kPa).
During summer season (June, July, August) in the recent 40-year period (Fig. 5A), VPD reached high (>3 kPa) or very high (>4.5 kPa) levels over respectively 4.3% and 2.8% of the US urban and rural land surface, while in the latter 40 years of the century (2060–2099), 32.8% and 40.6% of the US urban and rural land surface, respectively are predicted to reach an average VPD in the high (>3 kPa) or very high (>4.5 kPa) ranges. Risk of high VPD is greater in urban than rural communities in most regions of the US, while given that a preponderance of rural land mass is in the high risk region of the US in the late 21st century (Fig. 5A), VPD risk for the entirety of rural communities in the Continental US is similar to the entirety of urban communities. Winter (December, January, February) VPD (Fig. 5B) is very low relative to the summer season given the low (outdoors) ambient temperatures. While outdoor winter VPD in the Continental US is predicted to remain relatively low through the 21st century (Fig. 5B), laryngeal VPD will be far higher in winter air given the heating of cold dry air that occurs in the winter heating of indoor air as well as in mouth breathing (Fig. 1B and Table 1).
Discussion
We have determined that airway mucus thins and concentrates on encounter with dry inhaled in the manner of a transpiring hydrogel13. Above a threshold atmospheric dryness, this mucosal transpiration behavior promotes inflammation, as in the case of the dehydrated leaf. Chronic airway exposure to the risks of high VPD air has been growing for decades on account of the human population shift to indoor living38, and the rise in prevalence of chronic mouth breathing21,22,23,24. Our study suggests that, as a consequence of global warming, these risks are likely to become severe (Fig. 5).
Mucus transpiration is a potential chronic source of the mechanical compression of airway epithelial cells that has been implicated in acute bronchospasm39,40 and associated with the pathogenesis of chronic respiratory disease41,42. We observed (Table 2) significantly elevated IL-6, TNF-α, and IL-33 secretions on exposure of a cell culture model of the human bronchial epithelium to dry air with VPD = 4.4 kPa (30% RH). These cytokines have been implicated in driving Type 2 eosinophilic and non-Type 2 inflammation that forms the basis of asthma43,44. They appear also to interact with sensory neurons at the level of the larynx and upper airway to initiate neural inflammation, laryngeal hypersensitivity, laryngeal obstruction and cough45. Our data are further in accordance with those of Kilic et al. 46 who reported the release of the epithelial alarmins, TSLP and IL-33, as a result of epithelial compression in ALI cultures of the airway epithelial cells.
We observed inflammatory cell infiltration in the lungs of mice following 14 days of intermittent acute dry air exposure (Fig. 4A–F). While mice are obligate nose breathers47, the small dimension of the nasal passage in the mouse48 renders the humidification capacity of the mouse nose similar to that of the human pharynx, where principal air humidification occurs prior to the larynx20 on mouth breathing. The presence of parenchymal lesions due to dry air (Fig. 4F) suggests that, with only 4 generations of airways49, the mouse respiratory system has high risk of exposure to atmospheric VPD, further noting that near complete humidification requires approximately 6 generations of human airway bifurcations20,49 during tidal breathing. The observation of consolidation in the mice genetically-modified to present dehydrated airways reflective of disease, with no consolidation in WT mice, is consistent with our prediction (Fig. 2C, D) that, on exposure to dry air, dehydrated mucus compresses airway epithelia to a greater extent than hydrated mucus, as well as reports that cough50 and bronchoconstriction51 on dry-air exposure increase with ventilation rate much more significantly in hypersensitive (asthmatic) airways than in normal healthy airways.
Our theoretical predictions of mucus thinning and airway epithelial cell compression (Fig. 2A–C) accurately describe our experimental data, without fitted constants, both quantitatively (up to highest deformation) (Fig. 2C) and qualitatively in terms of cytokine secretion (Table 2) and inflammatory cell infiltration (Fig. 2D–F). Our theoretical and experimental (in vitro) results further confirm the general transpiration behavior that has been reported on in the study of water evaporation/transpiration from artificial polymer beads13. Particularly, the latter thin and compress surrounding structures in the process of osmotic water pull in a remarkably similar way as observed in our transpiring mucus experiments (Fig. 2).
Limitations of our work include a theoretical focus on time-averaged breathing processes, which do not include phenomena associated with the ebb and flow of breathing. The question of the inflammatory impact of small but significant chronic compression of airway mucus into the bronchi and bronchioles during normal tidal breathing was also not addressed in our theoretical study. Given the inflammatory impact we observed in the intermittent 14-day exposure of Scnn1b-Tg mice (Fig. 4A–F), this question might be fruitfully explored in the future and potentially provide insight into tidal breathing origins of chronic respiratory disease. Our projections of risk of human airway inflammation with global warming did not account for extreme weather or indoor air inflammation risk—dimensions of global warming that are immediately felt today and may be severely felt in the coming years.
The primary conclusion of our study, that water evaporates from airway mucus to inflame human airways in atmospheric conditions increasingly common to the human experience, argues that these and other questions be answered for fuller understanding of the consequences of the breathing of air with elevated VPD, as well as urgent management of airway hydration for sustaining breathing with climate change.
Methods
Human bronchial epithelial cultures
Non-diseased airway epithelial cells were obtained from deceased donors under the auspices of the University of North Carolina Institutional Review Board. Epithelial cells were isolated from the large airways using previously published methods. Isolated primary cells were grown to ~80% confluence in collagen-coated flasks with the appropriate growth media52 prior to being passaged onto collagen-coated 1 cm2 supports (Costar Transwell; 3 µm pore size) at a density of ~1.25 × 10⁵ cells/cm2. The cells were cultured at air-liquid interface and maintained at 37 °C, 5% CO2, and 95% relative humidity (RH) until fully differentiated (21–28 days). During culturing, accumulated mucus was removed by PBS lavage once per week.
Mucus thickness studies
To ensure that the surface of the well-differentiated culture contained a mucus layer with a thickness and concentration that replicates a normal, non-diseased, airway53, the airway surface was washed 72-h prior to the study, and the mucus was allowed to accumulate53. The measurement of the airway surface layer (ASL) thickness was performed using a well-published approach25. To visualize the ASL, a 100 nL of a non-permeable fluorescent dye (70 kDa Dextran-Texas Red) was nebulized onto the culture surface 16 h prior to the experiment. The height of the ASL was measured using an inverted XZ-confocal microscope (SP5; Leica) at 5-minute intervals for a total of 2 h. The cultures positioned 250 µm above the microscope’s coverslip using a special chamber54 designed to ensure that basolateral media (Krebs buffered saline) was not limiting when exposed to low humidities. During the imaging, an environmental chamber ensured that cultures were maintained at 37 °C, 5% CO2, and appropriate experimental humidity (95, 60, or 30%). The resulting images were analyzed using custom Matlab code to automatically quantify the mean ASL height at each experimental time point55.
PCL thickness studies
The effect of altering mucus concentration, and hence mucus osmotic pressure, on the height of the PCL (hPCL) was performed using a previously published approach56. Briefly, a small amount of large (<75 nm) green-fluorescent dextran (FITC-labeled) combined with a very small (2 nm) Red fluorescent dextran (Texas Red-labeled) was added to a series of non-fluorescent dextrans of various osmotic pressures, as measured using a custom-designed oncometer56. This mixture of fluorescently-labeled and non-fluorescent dextrans was added onto the luminal surface of well-differentiated human airway epithelial cell cultures after the removal of endogenous mucus layer. XZ-confocal images were then obtained using a laser scanning confocal microscope (Model SP5; Leica) to measure the penetration depth of the large green dextrans, relative to the small dextran which can penetrate the entire PCL space. Images were obtained from cultures exposed to each of the osmotic pressures and analyzed using custom Matlab code. Here, the PCL height is determined as the difference in the penetration of the large green dextran relative to the red dextran. These measurements led to the following values of hPCL as a function of osmotic pressure: 6.8 μm ± 0.23 μm at 100 Pa, 6.5 μm ± 0.42 μm at 140 Pa, 6.4 μm ± 0.45 μm at 190 Pa, 6.2 μm ± 0.31 μm at 195 Pa, 5.8 μm ± 0.37 μm at 275 Pa, 5.3 μm ± 0.45 μm at 350 Pa, 5.0 μm ± 0.61 μm at 400 Pa, 4.4 μm ± 0.23 μm at 550 Pa, 3.7 μm ± 0.77 μm at 880 Pa, 3.1 μm ± 0.37 μm at 1375 Pa, and 2.9 μm ± 1.03 μm at 2870 Pa.
Determination of mucus and PCL thicknesses from the measured ASL thickness
We estimated the heights of the mucus and PCL layers post 2 h of dehydration by assuming steady state to be reached after 2 h exposure in the mucus thickness studies. We then used the theoretical prediction of the mucus height h(q) provided by Eq. 4 for the particular evaporation rate of the RH condition to predict the (globular protein) osmotic pressure at that evaporation rate q (Fig. 2B, C), and deduced the PCL height hPCL(q) from the measured dependence of hPCL on osmotic pressure. Figure 3C therefore presents the measured final ASL height hASL versus the predicted height based on h(q) + hPCL(q) at the particular RH or q value. We used globular protein osmotic pressure as an approximation of the mucus hydrogel osmotic compression of the PCL that is not accounted for in the small-deformation limit of the analysis (see Supplemental Note 1).
Cell death study
A live-dead assay (Thermo Fisher) was used to determine the number of necrotic cells when exposed to different humidities. Here, cell-permeable Calcein-AM stains live cells and impermeable Ethidium Homodimer−1 (EthD-1) labeled dead cells. Primary human airway epithelial cells cultures exposure to 95 or 30% humidity prior to staining with both dyes. XY-confocal images (Leica SP5; 20× objective) were obtained for each condition. As a positive control, cells were treated with 0.1% Nonidet P-40, a detergent that induces cell membrane rupture, to confirm the efficacy of the dead cell staining. The number of dead cells per image (frame) was automatically counted using image analysis software (ImageJ). Data is presented as Mean ± SD.
Luminex method for cytokine analysis
Samples stored at −80 °C were thawed in ice. All the samples were diluted five times using calibrator diluent (RD6-52) provided in the Luminex ®Human premixed multianalyte kit (Cat #LXSAHM, R&D system, USA). The Luminex assay was deployed as per the manufacturer’s instructions. At the end of the assay protocol, dual laser flow-based illumination was measured using an xMAP Intelliflex® reader. Known standards provided by the manufacturer were used to generate the standard curves. Final concentrations were calculated using Quantist™ software (Biotechne, USA).
Climate model simulations
The numerical simulations for urban/rural VPD are carried out using the Community Earth System Model (CESM) version 2.1.357. The land component in CESM2.1.3 is the Community Land Model (CLM) version 558. CLM uses a sub-grid technique to represent urban, natural vegetation, crop, and other land cover types such as glacier and lake within each grid cell. The urban land processes are parameterized by the urban surface scheme within the framework of CLM, known as CLM-Urban (CLMU). More detailed descriptions of CLMU can be found elsewhere59,60,61,62. The model treats natural vegetation and crop as rural land covers when computing the rural VPD.
We used CLM5 to perform historical and future land-only simulations forced by a high-resolution (12 km) hourly product63. A more detailed description of the forcing data can also be found at the data website (https://tgw-data.msdlive.org/). Based on the initial conditions provided by CESM, which have been spun up, we run CLM5 for additional 80 years at a spatial resolution of 1/8 degree over the U.S. for further spin up, recycling the historical and future atmospheric forcing twice, respectively. Finally, we conduct the 40-year historical experiment (1980–2019, called Recent Past) and future experiment (2060–2099, called Late 21st century) under the RCP 8.5 hotter scenario, respectively, using the initial conditions provided by the spin-up runs.
Exposure of Scnn1b-Tg and WT mice to normal or dry air
All mice were maintained and studied under protocols approved by the University of North Carolina Institutional Animal Care and Use Committee, according to the principles outlined by the Animal Welfare and the National Institutes of Health guidelines. Mice were housed in individually ventilated micro-isolator cages in a specific pathogen-free facility at the University of North Carolina at Chapel Hill, on a 12-h day/night cycle. Mice were fed a regular chow diet and given water ad libitum. 8 week-old WT and Scnn1b-Tg littermates (n = 5/group) were exposed in a pie cage to short intervals (15 min each, separated by at least 6 h) of room-temperature air (25 °C) either at 46%–57% RH or dry air (<20% RH, by connecting the pie cage directly to a compressed air cylinder, National Welders MBA300, interfaced with a regulator) twice a day for 14 consecutive days. Twenty four hours after the last exposure, lung tissue (left lobe) and BAL (right lobes) were collected using the split lung technique for evaluation of histopathology and differential cell counts.
Lung histology and morphemetry
Tissue processing for histological analyses were performed as previously described64. Briefly, lungs were immersion fixed in 10% neutral-buffered formalin for 48 h and processed for paraffin embedding. The left lung lobe was cross sectioned every 2 mm, starting at the hilum to systematically sample along the main stem bronchus. Sections were sections were stained with hematoxylin and eosin (H&E) for cellular morphology and Alcian Blue-Periodic Acid Schiff staining (AB-PAS) for glucoconjugates, to allow morphometric quantification of: (1) consolidated areas in the parenchymal region (traced with the ROI (region of interest) tool and thresholded for tissue detection to exclude the airspace’s); and (2) mucus cell metaplasia and airway mucus obstruction as measured by AB-PAS+ volume density (area of AB-PAS+ stain in the epithelial or luminal compartment, respectively, referenced to the subtending epithelial basal lamina65. Image analyses were conducted using Visiopharm software on whole slide scans acquired with a VS120 Slide Scanner (Olympus) at 20× magnification. Tissue blocks received a numerical code at time of embedding and scoring was performed by an investigator blinded to specimen genotype/treatment.
Numerical simulation
Fig. 2A, C, D. Figure 2A represents numerical solution of Eq. 1 to Eq (6) with Eq (25) in the Supplemental Material. Figure 2C plots π*[h(q)/h0−1] with π* = 350 Pa and h(q) determined by Eq (5) of the article. That is, given that, for globular proteins, Pe <<1 for all airway evaporation rates encountered in human breathing, the globular-protein contribution to the difference in total ASL pressure δP between the evaporative and non-evaporative states is predominately the difference in the (relatively uniform) osmotic pressure of the ASL at the height h(q) relative to the height h0. Figure 2C plots Eq (56) of Supplemental Note 1 for the chronic dehydration (mucin hydrodynamic diameter 300 nm, corresponding to D = 1.5 × 10⁻¹² m2/s) and the acute dehydration (mucin hydrodynamic diameter 200 nm, corresponding to D = 2.3 × 10⁻¹² m2/s) cases; and Eq (58) of Supplemental Note 1 for the rehydrated case, with D = 2.3 × 10⁻¹² m2/s. The model was solved using MATLAB (R2022a; The MathWorks, Inc., Natick, MA) and the computer code is available upon request.
Statistics
Statistical significance in Fig. 3B was determined by a two-tailed t-test with p < 0.05, and *** denoting p < 0.001. Error bars in Fig. 3C are 95% confidence intervals based on standard deviation values (n = 3). Ranges in the reporting of cytokine concentrations in Table 2 represent the high and low cytokine concentration among the group (n = 3). Ranges in the Change From 1 h to 3 h represent the high and low change in cytokine concentration from 1 to 3 h among the group (n = 3). The p values for Change Within the Group were determined by a single-factor ANOVA test (Microsoft 365, Excel version 2408) upon comparing 3 h cytokine concentrations with 1 h cytokine concentrations within the group (n = 3). The p values for Change Between Groups were determined by a two-factor ANOVA test (Microsoft 365, Excel version 2408) comparing 1 to 3 h cytokine concentration change for each group (n = 3) between groups (30 vs 60% and 60 vs 95%). Statistical significance in Table 2 was determined upon p < 0.05.
Reporting summary
Further information on research design is available in the Nature Portfolio Reporting Summary linked to this article.

Responses