Gravitational stability of iron-rich peridotite melt at Mars’ core-mantle boundary
Introduction
Seismological observations from the InSight mission on Mars proposed the possible presence of a silicate melt layer at the core-mantle boundary on Mars1,2. The basal silicate melt layer, thought to be enriched in iron and heat-producing elements, is likely formed through the fractional crystallization of Mars’ magma ocean. It has been suggested that this layer could be sufficiently dense to settle at the core-mantle boundary3 with minimal mixing with the overlying mantle. Its presence has the potential to have influenced the geochemical and geophysical evolutions of Mars’ interior, acting as a thermal boundary layer that mediates heat and materials exchange between mantle and core4.
Iron enrichment in SiO2-poor peridotitic silicate melt is considered as the key to form dense silicate melt layer gravitationally stable at the base of the Mars’ mantle3. However, it is important to note that previous studies discussed the gravitational stability of iron-rich peridotitic melt based on the density data calculated by first-principles simulations or by calculation software such as pMELTS5 because the density of iron-rich peridotitic melt has not been well investigated experimentally. To the best of our knowledge, there is a sink-float density measurement of a peridotite melt having moderate iron content (Fe/(Mg+Fe) ratio = 0.23) at high-pressure condition of ~16 GPa (ref. 6). The result shows density of ~3.6 g/cm3 at ~16 GPa, which is much lower than that of the Mars’ mantle at the corresponding depth of ~1350 km [~3.9 g/cm3 (ref. 1) and ~4.0 g/cm3 (ref. 2)]. The data implies that higher iron content in peridotite melt is required to yield density higher than that at the base of the Mars’ mantle, while the effect of iron content on the density of peridotitic melt has not been well understood.
Effect of compositions on the density of silicate melts has been investigated mostly for SiO2-rich silicate melts such as andesitic and basaltic silicate compositions7,8,9,10,11 at ambient pressure by using the double-bob Archimedean method7,8. However, it was difficult to investigate the density of SiO2-poor peridotitic melts due to two experimental difficulties. One is temperature limitation in common high-temperature furnaces. Previous density measurements have been limited to temperature conditions up to 1873 K (refs. 8,10). The temperature range is enough high to melt SiO2-rich silicate compositions, while liquidus temperatures of SiO2-poor peridotitic compositions are higher than 1873 K. Therefore, it is difficult to conduct melt experiment for peridotitic compositions. Another experimental difficulty is the high reactivity of iron in silicate melt with platinum crucible. Container material is essential to keep molten samples in common high-temperature furnaces, while it is challenging to avoid chemical reactions between iron-rich silicate melt and container material at high-temperature conditions. Refs. 10,11 adopted molybdenum as the crucible to reduce the reaction of iron in the density measurements of iron-containing basaltic melt samples. However, it would be challenging to avoid chemical reactions at very high-temperature conditions, which are required for the melt experiments of peridotitic compositions.
To overcome these experimental difficulties, we utilize an electrostatic levitation furnace (ELF) at the International Space Station (ISS) (refs. 12,13,14,15). The ELF at the ISS is capable of conducting high-temperature experiments at >3000 K by laser heating, which is high enough to melt peridotitic compositions and to investigate temperature dependence of the density of peridotitic melt at a wide range of temperatures. In addition, a containerless experiment by electrostatic levitation under the microgravity environment in the ISS overcomes the problem of a chemical reaction between melt sample and container material at high-temperature conditions. Thus, the ELF at the ISS opens the way to experimentally investigate the density of iron-rich peridotitic melt at high-temperature conditions. Here we report the density measurements of four iron-rich peridotitic melts (Mg0.8Fe0.2SiO3, Mg1.8Fe0.2SiO4, Mg0.7Fe1.2SiO4, and Mg0.9Fe1.6SiO4.5) at high-temperature conditions up to 2465 K, and we modeled densities of iron-rich peridotitic melts in the Mars’ mantle based on the effect of compositions and temperature on the density of peridotitic melt determined in this study, combined with a compression curve of a peridotite melt reported in ref. 6.
Results
We measured densities of Mg0.8Fe0.2SiO3, Mg1.8Fe0.2SiO4, Mg0.7Fe1.2SiO4, and Mg0.9Fe1.6SiO4.5 melts having Fe/(Mg+Fe) ratio of 0.10–0.63 and (Mg+Fe)/Si ratio of 1.00–2.52 (Supplementary Table 1). The density measurements were carried out by using the ELF at the ISS. The sample was levitated in an Ar gas environment under 2 atm pressure condition, and the levitated sample was heated by four lasers. The molten sample showed a perfect sphere shape as a result of the surface tension under the microgravity environment in the ISS (Fig. 1a), which enabled us to precisely determine the volume of the melt sample compared to the density measurement by aerodynamic levitation furnace on the ground16,17, because the melt sample in the aerodynamic levitation furnace is partially hidden by the gas nozzle and the shape is influenced by the gas flow and gravity on the ground. The volume of the melt sample was determined from the image analysis (cf. Methods), and the density of the melt was calculated by the volume and the mass, which was weighed on the ground after the sample return. Density measurements were carried out during cooling from the highest temperature until the crystallization, including the temperature range of supercooling. Figure 1b shows an example of the temperature path obtained in the experiment of the Mg1.8Fe0.2SiO4 sample. During cooling from 2465 K to 1718 K, images of the molten Mg1.8Fe0.2SiO4 sample were acquired at 60 frames/s camera speed. We obtained 101 data for the Mg1.8Fe0.2SiO4 melt in ~1.6 s duration of cooling.

a An example of image of the molten Mg1.8Fe0.2SiO4 sample acquired with ultraviolet black light. b Temperature path obtained in the experiment of the Mg1.8Fe0.2SiO4 sample during cooling from the highest temperature of 2465 K to the crystallization.
We measured densities of Mg0.8Fe0.2SiO3 melt at 1235–2206 K, Mg1.8Fe0.2SiO4 melt at 1718–2465 K, Mg0.7Fe1.2SiO4 melt at 1348–2360 K, and Mg0.9Fe1.6SiO4.5 melt at 1586–2297 K (Fig. 2). The experimentally obtained density (ρ) of Mg0.8Fe0.2SiO3, Mg1.8Fe0.2SiO4, Mg0.7Fe1.2SiO4, and Mg0.9Fe1.6SiO4.5 melts at the temperature (T) conditions of 1235–2465 K were fit into the following equation:
where Xi and Mi are the mole fraction and molecular weight of each oxide component, respectively. Vi,Tref is the partial molar volume of each oxide component at a reference temperature condition (Tref = 1723 K), and δVi/δT is the partial thermal expansivity of each oxide component. Table 1 summarizes the partial molar volumes at the reference temperature of 1723 K and the partial thermal expansivities for SiO2, MgO, and FeO components determined from our obtained densities of peridotitic melts.
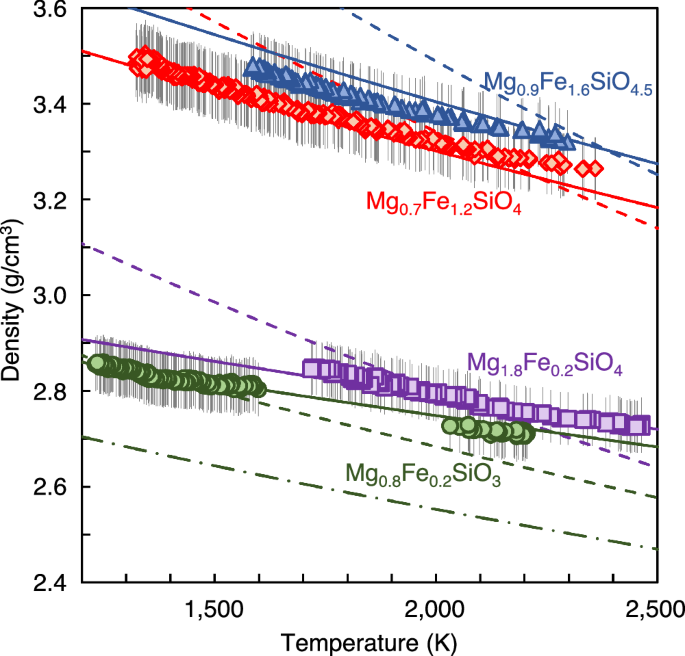
Vertical bars represent ±2 % uncertainty of the melt density measurement. Solid lines represent the density model determined from the experimental results of this study. Dashed lines are calculated by extrapolating the previous density model for SiO2-rich basaltic melt11, and dash-dot line shows density of Mg0.8Fe0.2SiO3 melt calculated by first-principles simulation18.
The partial molar volumes determined based on the density results of SiO2-poor peridotitic melts in this study show lower VSiO2 and higher VMgO and VFeO than those of the previous density model based on SiO2-rich basaltic melts data11 (Table 1). Our experimentally obtained density of Mg0.8Fe0.2SiO3 melt, which has relatively high SiO2 content, is similar to that calculated by the previous density model11 at the reference temperature of 1723 K (Fig. 2). In contrast, there are marked differences in the densities of SiO2-poor Mg1.8Fe0.2SiO4, Mg0.7Fe1.2SiO4, and Mg0.9Fe1.6SiO4.5 melts between our experimental results and the previous density model11 at the reference temperature of 1723 K. The density differences increase with decreasing SiO2 content, probably due to uncertainty caused by extrapolation of the previous density model for SiO2-rich basaltic melt11 to SiO2-poor peridotitic compositions.
In addition, we found marked differences in the temperature dependences of the densities of Mg0.8Fe0.2SiO3, Mg1.8Fe0.2SiO4, Mg0.7Fe1.2SiO4, and Mg0.9Fe1.6SiO4.5 melts between our experimental results and those calculated by the previous density model for basaltic melt11 (Fig. 2). Thermal expansivities of peridotitic melts obtained in this study are much smaller than those calculated from the previous density model for basaltic melt11. Our determined partial thermal expansivities of MgO (δVMgO/δT) and FeO (δVFeO/δT) are much smaller than those reported in the previous density model for basaltic melt11 (Table 1). On the other hand, although previous studies8,9,11 reported that partial thermal expansivity of SiO2 (δVSiO2/δT) is almost zero, we obtained a small positive value for δVSiO2/δT.
Furthermore, we compared the density of Mg0.8Fe0.2SiO3 melt experimentally determined in this study and that calculated by first-principles simulation18. Our obtained densities of Mg0.8Fe0.2SiO3 melt at 2000–2200 K were 7.1–7.5 % higher than those calculated by first-principles simulation18 (Fig. 2).
Figure 3 shows the effect of Fe/(Mg+Fe) ratio on the density of (Mg,Fe)2SiO4 melt calculated by our determined density model Eq. (1), which is compared to the previously reported densities of Mg2SiO4 melt (ref. 19) and Fe2SiO4 melt (ref. 20) at 0 GPa and 1818 K. The density of Mg2SiO4 melt is consistent between our model and the previous experimental result19 within a 0.1% difference, while the density of Fe2SiO4 melt shows a 2.6 % difference between our model and the previous experimental result20.
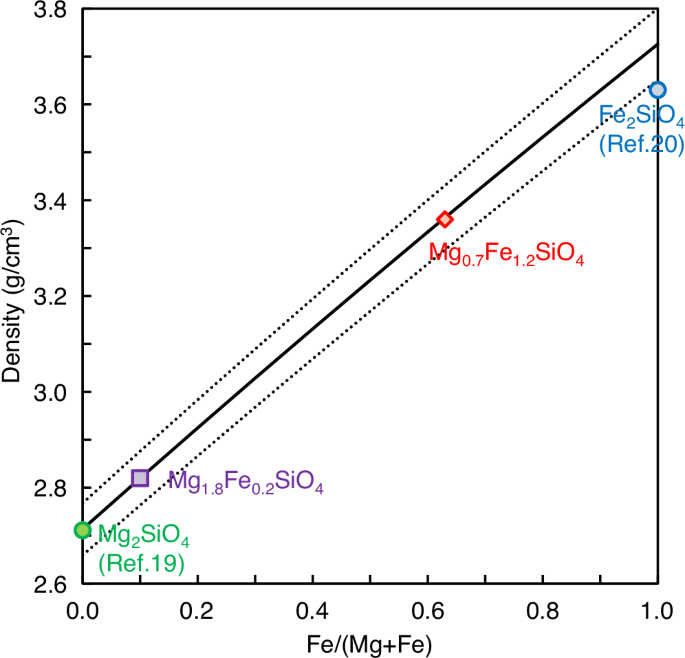
Symbols represent experimentally obtained density values of Mg2SiO4 (ref. 19), Mg1.8Fe0.2SiO4, Mg0.7Fe1.2SiO4 (this study), and Fe2SiO4 (ref. 20) melts at 1818 K, which are compared with our determined density model at 0 GPa (Eq. 1) (solid black line). The dotted black lines represent ±2% uncertainty due to the uncertainty of the melt density measurement in this study.
Discussion
Our experimental density data and the determined density model for peridotitic melt provide important constraints on the gravitational stability of iron-rich peridotitic melt at the core-mantle boundary of Mars. In order to discuss the effect of iron content on the density crossover between peridotite melt and Mars’ mantle, we modeled the density of a peridotitic melt composition of (Mg1-xFex)1.39SiO3.39 with varying x = Fe/(Mg+Fe) ratio between 0.2–1.0. The (Mg+Fe)/Si ratio of 1.39 is referred from the peridotite melt composition of ref. 6. We calculated densities of (Mg1-xFex)1.39SiO3.39 melts at 0 GPa and high-temperature condition of 2150 K by using our determined density model Eq. (1). The temperature condition corresponds to the temperature estimate of ~2000–2300 K at the core-mantle boundary of Mars1. Densities (ρ) of the (Mg1–xFex)1.39SiO3.39 melts at high pressures (P) were calculated based on the densities at 0 GPa and 2150 K (ρ0T) determined by our density model Eq. (1), combined with the third-order Birch-Murnaghan equation of state:
where the isothermal bulk modulus (KT0) of 17.9 ± 3.3 GPa and its pressure derivative (K’T0) of 10.1 are referred from the sink-float density measurement of peridotite melt at 2253 K (ref. 6). The equation of state of peridotite melt6 has relatively low compression curve compared to those experimentally determined for basalt melt21 at 2735 K and MgSiO3 glass22 at 300 K, and that calculated by first-principles simulation for MgSiO3 melt18 at 3000 K (Fig. 4a). On the other hand, the compression curve of peridotite melt6 is similar to the isentropic compression curves of MgSiO3 and Mg2SiO4 melts determined from shock compression data23 (Fig. 4a). The slight differences between the isothermal compression curve of peridotite melt6 and the isentropic compression curves of MgSiO3 and Mg2SiO4 melts23 (2.1 % and 3.5 % difference at 20 GPa, respectively) may be due to influence of temperature in the isentropic compression curve. In addition, ref. 23 only measured shock wave velocities, and other parameters (particle velocity, pressure, density, and internal energy) were calculated by impedance matching, using standard Hugoniot data for flyer and driver plates from ref. 24, which may be another uncertainty of the difference between the compression curves. Nevertheless, the comparisons indicate that SiO2-poor peridotitic melts have a lower compression curve than SiO2-rich basalt melt (Fig. 4a). In addition, Fig. 2 has shown a marked difference in the density result of Mg0.8Fe0.2SiO3 melt between our experiment and first principles simulation18. We therefore consider that the consistency between the isothermal compression curve of peridotite melt6 and isentropic compression curves of MgSiO3 and Mg2SiO4 melts23 indicates the validity of the equation of state of ref. 6 as the compression curve of peridotitic melt at the pressure range of the Mars’ mantle up to ~21 GPa.
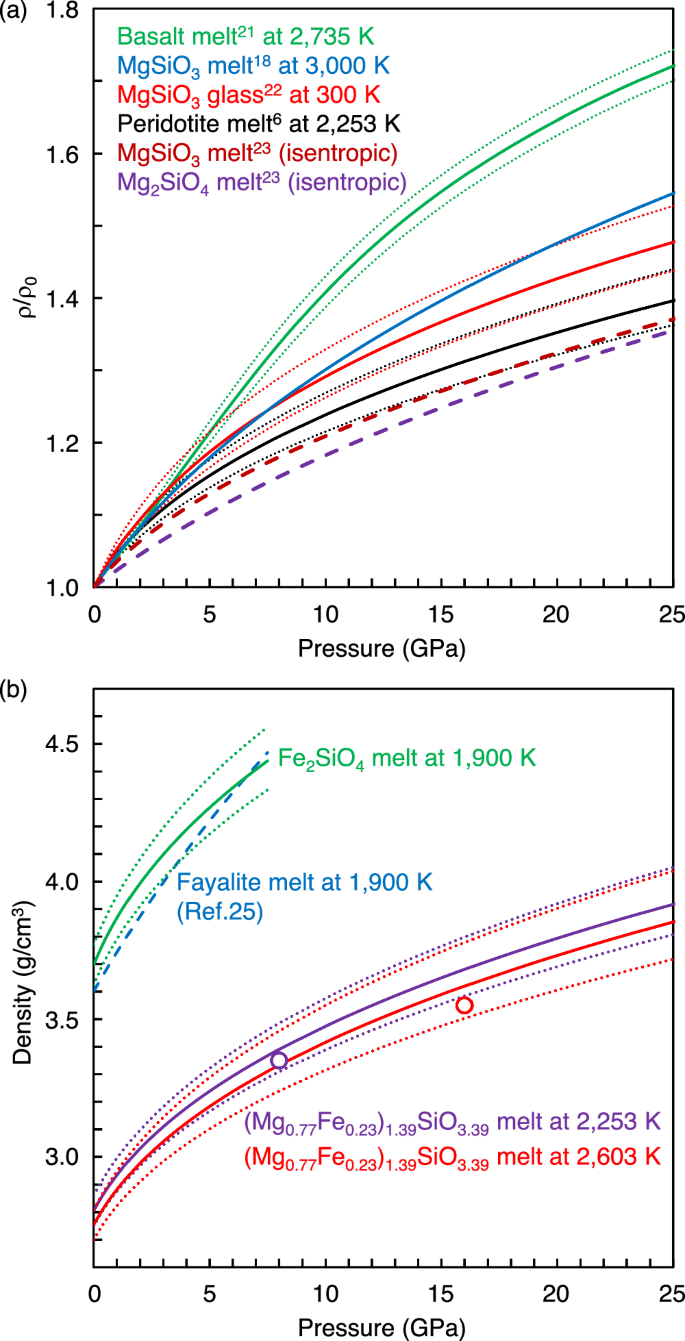
a Comparison of compression curves experimentally determined for basalt melt at 2735 K (ref. 21), MgSiO3 glass at 300 K (ref. 22), and peridotite melt at 2253 K (ref. 6), and that calculated by first principles simulation for MgSiO3 melt at 3000 K (ref. 18). In addition, isentropic compression curves of MgSiO3 and Mg2SiO4 melts determined from shock compression data23 are shown for comparison. Dotted lines represent ranges of uncertainties due to the uncertainty of the equation of state parameters. b Comparisons of densities calculated by the density model of this study [(Mg0.77Fe0.23)1.39SiO3.39 and Fe2SiO4 melts] (solid lines) with experimental results for a peridotite melt at ~8 GPa and ~16 GPa (circles) (ref. 6) and a fayalite melt up to 7.5 GPa (ref. 25) (blue dashed line). Dotted lines represent ranges of uncertainties in the density model of this study due to ±2 % uncertainty of our melt density measurement at 0 GPa and the uncertainty of the compression curve parameter6.
In order to check the influence of different compositions other than MgO-FeO-SiO2 on the density, we compared the density of (Mg0.77Fe0.23)1.39SiO3.39 melt modeled in this study with that of a peridotite melt6, which has the same Fe/(Mg+Fe) and (Mg+Fe)/Si ratios and contains 6.5 wt.% Al2O3 and 5.3 wt.% CaO. The comparison shows similar density values between (Mg0.77Fe0.23)1.39SiO3.39 melt and the peridotite melt within the range of uncertainties (1.3 % difference at ~8 GPa and 2.0 % difference at ~16 GPa) (Fig. 4b). In addition, we compared the density of Fe end-member Fe2SiO4 melt calculated by our model with an experimentally obtained equation of state of pure fayalite melt up to 7.5 GPa at 1900 K (ref. 25) (Fig. 4b). The comparison shows up to 3.2% difference between our model and the experimental result25, which is mainly attributed to the difference in the density of Fe2SiO4 melt at 0 GPa (Fig. 3). These data indicate that our (Mg1-xFex)1.39SiO3.39 melt density model represents density of peridotite melt, although extrapolation of our density model to Fe end-member composition may have ~2–3 % uncertainty (Figs. 3 and 4b).
Figure 5 shows comparisons of the densities of peridotitic (Mg1-xFex)1.39SiO3.39 melts with the x = Fe/(Mg+Fe) ratio between 0.2–1.0 with the density structures in the Mars’ mantle1,2. Both density structures show a density of ~4.0 g/cm3 in the solid mantle at ~1500 km depth above the silicate melt layer1,2. Our results show that the peridotitic melts with the Fe/(Mg+Fe) ratio of more than 0.4–0.5 have higher densities than those of the solid mantle at ~1500 km depth (Fig. 5). The data indicate that iron-rich peridotitic melt with the Fe/(Mg + Fe) ratio more than 0.4–0.5 is gravitationally stable at the core-mantle boundary in Mars.
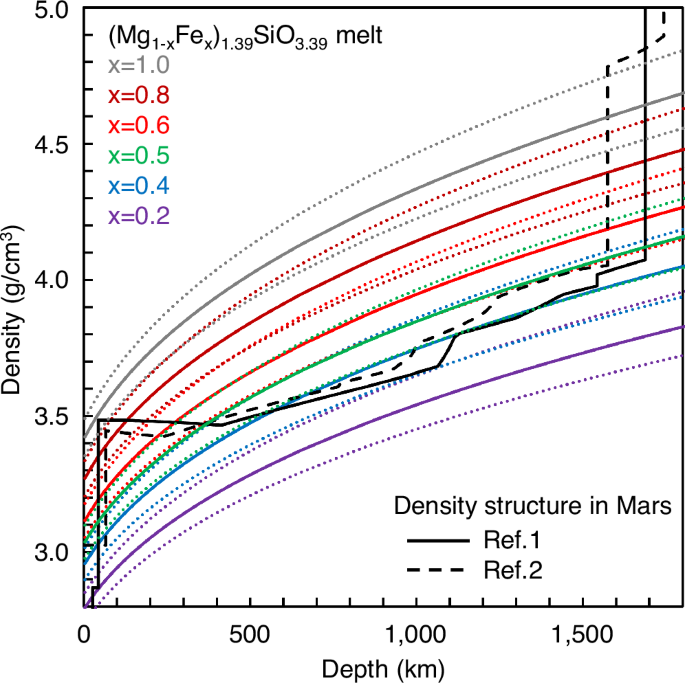
Dotted color lines represent ranges of uncertainties due to ±2 % uncertainty of our melt density measurement at 0 GPa and the uncertainty of the compression curve parameter6.
It is important to note that ref. 1 and ref. 2 reported two distinct values as the density of the silicate melt layer at the core-mantle boundary on Mars (Fig. 5). Ref. 1 reported the density of the silicate melt layer of 4.0–4.1 g/cm3 at ~1550–1690 km depth, which is only slightly higher than the density of the overlying solid mantle. The density of the silicate melt layer proposed by ref. 1 can be explained by that of iron-rich peridotitic melt with the Fe/(Mg+Fe) ratio of 0.45 (Fig. 5). On the other hand, ref. 2 reported a much higher density of the silicate melt layer of 4.8 g/cm3 at ~1570–1740 km depth. Our result shows that iron end-member Fe1.39SiO3.39 melt has a density of 4.65 g/cm3 at 1700 km depth, which is lower than that of the silicate melt layer proposed by ref. 2 (Fig. 5). The data indicate that the high-density value of the silicate melt layer proposed by ref. 2 is difficult to be reproduced by the density of iron-rich peridotitic melt.
Our results suggest iron-rich peridotitic melt with the Fe/(Mg + Fe) ratio of 0.45 as the composition of the silicate melt layer at the core-mantle boundary on Mars. It is interesting to note that the Fe/(Mg + Fe) ratio of 0.45 is consistent with the melt composition simulated by fractional crystallization of the Mars’ magma ocean3. Ref. 3 simulated the melt compositions at different degrees of crystallization with the residual melt amounts of 40, 30, and 20 wt.%. The simulation results show the melt compositions with the Fe/(Mg + Fe) ratio of 0.45 at 40 wt.% melt amount and of 0.55 at 20 wt.% melt amount. Considering our density results, the melt compositions with the Fe/(Mg + Fe) ratio of more than 0.45 simulated in ref. 3 have densities higher than that of the Mars’ mantle. Therefore, these melts would sink into the base of the mantle during crystallization in the Mars’ magma ocean. The dense iron-rich peridotitic melt may be confined at the core-mantle boundary in Mars’ history, and it may play an important role in the evolution of Mars’ interior, such as acting as a thermal boundary layer that prevents cooling and solidification of the molten core.
In addition to Mars, the possible presence of a dense silicate melt layer at the core-mantle boundary has also been proposed in the Earth26. Iron-rich peridotitic melt compositions have been discussed as the dense silicate melt gravitationally stable at the base of the Earth’s mantle22,27. However, the previous studies estimated the densities of iron-rich peridotitic melts based on the density data calculated by first-principles simulations. Since our experimentally obtained density result shows a markedly higher value than that calculated by first-principles simulation18 (Fig. 2), previous studies may underestimate the densities of iron-rich peridotitic melts. Our determined density model for iron-rich peridotitic melt would provide fundamental knowledge to model dense silicate melt layers not only on Mars but also on Earth.
Methods
Sample preparation
The four iron-rich peridotitic compositions (Mg0.8Fe0.2SiO3, Mg1.8Fe0.2SiO4, Mg0.7Fe1.2SiO4, and Mg0.9Fe1.6SiO4.5) were prepared by mixing powders of MgO, Fe2O3, and SiO2. The powder samples were melted under ambient air condition on the ground by using aerodynamic levitation furnace with a 100 W CO2 laser. The quenched samples had a spherical shape with the diameter of ~2 mm. The sphere samples were set in the sample holder12,13 and transferred to the ISS for density measurements.
Density measurement of melt in the ELF at the ISS
Density measurements of the Mg0.8Fe0.2SiO3, Mg1.8Fe0.2SiO4, Mg0.7Fe1.2SiO4, and Mg0.9Fe1.6SiO4.5 melts were conducted by using the ELF at the ISS12,13,14,15. The sample was levitated by using six electrodes in Ar gas environment under 2 atm pressure condition. The sample was heated by using four 980 nm diode lasers with a maximum power of 40 W each. The temperature was determined from the intensity of the emitted radiation by using a pyrometer, which measures the radiation intensity at the wavelength of 1.45–1.80 μm. The emissivity of the sample was calibrated based on the temperature plateau after recalescence using the known melting temperatures of the MgO-FeO-SiO2 compositions28.
The density of the melt was determined from the mass and the volume. The volume of the melt sample at each temperature condition was determined from the sample image acquired with ultraviolet black light. The sample images were acquired by 60 frames/s camera speed. Density measurements were carried out during cooling by turning off the heating lasers. After the density measurement, the sample was returned to the sample holder, and the recovered samples were brought back to the Earth. The mass of the recovered samples was weighed on the ground.
The volume of the melt sample was determined from the obtained image by the image analysis of ref. 29. We detected 400 edge points, and the polar coordinates (R, θ) were fit into the following spherical harmonic functions up to fifth order:
where Pn(cosθ) are n-th order Legendre polynomials and cn are coefficients to minimize the following function:
Then, the volume of the melt sample was calculated by the following equation:
Pixel size of the image was calibrated by an image of stainless steel ball with the diameter of 2.0 mm. The calibration was conducted before the density measurements of the melt samples. Uncertainty of the melt density measurement is ±2 %.
Analyses of the recovered samples after the density measurements
The recovered samples were first analyzed by X-ray tomography to investigate the entire sample in three dimensional view. Supplementary Fig. 1 shows cross sectional images of the 3D X-ray tomography analyses of the recovered samples. The 3D X-ray tomography results show no visible inhomogeneity in all samples, except for cracks inside the Mg1.8Fe0.2SiO4, Mg0.7Fe1.2SiO4, and Mg0.9Fe1.6SiO4.5 samples.
The recovered samples were further investigated by a scanning electron microscope (SEM) (JEOL JSM-IT500HR) (Supplementary Fig. 2). The Mg0.8Fe0.2SiO3 sample consists of glass, while the Mg1.8Fe0.2SiO4, Mg0.7Fe1.2SiO4, and Mg0.9Fe1.6SiO4.5 samples were composed of quench crystals. Oxide compositions of the recovered samples were analyzed by an energy dispersive spectrometer (EDS) on the SEM (Supplementary Table 1). The composition analyses were conducted at 15 kV and 1 nA conditions, and forsterite (Mg2SiO4) and Fayalite (Fe2SiO4) were used as standards. The recovered samples had identical oxide compositions to the prepared compositions, and there was no change in the oxide compositions after the density measurements.
In addition to the analyses of the oxide compositions, valence state of iron in the recovered samples was measured by X-ray absorption near edge structure (XANES) measurement at the BL27SU beamline in SPring-8. We measured the Fe LIII-edge XANES spectra (Supplementary Fig. 3). The measurement and analyses were conducted by the same method as ref. 30. The ratio of Fe3+ relative to total Fe (Fe3+/ΣFe) was calculated by the relative peak area of the first peak to the rest of the peaks following the equation proposed by ref. 31. The Fe3+/ΣFe ratio of the recovered samples were 0.222-0.308 (Supplementary Table 1). Although the redox condition of Mars’ mantle is not well constrained, the study of Martian meteorites shows a range of oxygen fugacity above the iron-wüstite buffer32. On the other hand, recent high-pressure melting studies suggested the formation of Fe3+ under Fe metal-saturated condition by the redox disproportionation at high pressures33,34, which implies the possible presence of Fe3+ in the silicate melt at the core-mantle boundary of Mars. Ref. 34 reported the Fe3+/ΣFe ratio of ~0.1-0.2 in silicate melts under Fe metal-saturated conditions at the pressure of the core-mantle boundary of Mars. We therefore consider that the Fe3+/ΣFe ratio of our samples may be comparable to that of the silicate melt layer at the core-mantle boundary of Mars.

 cycle")
Responses