Grazing decreases carbon storage in the Qinghai-Tibet Plateau grasslands

Introduction
Grasslands are a globally extensive vegetation type, covering approximately 40% of the entire land surface area1,2. The huge area of grasslands significantly contributes to their role as a global carbon sink3,4,5. Moreover, the carbon dynamics of grasslands are closely associated with global climate change and human activities6,7. Grassland ecosystems sequester atmospheric carbon dioxide (CO2) through photosynthesis, storing the sequestered carbon in both soil and vegetation8,9. Understanding grassland carbon storage is crucial for studying the carbon budget of Earth’s terrestrial ecosystems6,10,11. Accurately characterizing grassland carbon storage has become a prominent focus in global scientific research. Moreover, grassland resources are vital for human socioeconomic development. However, the unsustainable exploitation of grasslands can damage grassland ecosystems, threaten the livelihoods of herdsmen, and pose risks to global economic development12,13,14,15. A key ecosystem service provided by grasslands is the regulation of the balance between carbon dioxide and oxygen16,17,18. Severe degradation of grasslands leads to a significant increase in carbon dioxide emissions and shifts the grassland’s role from a carbon sink to a carbon source18,19,20. Grazing is the most widespread use of natural grasslands globally21,22,23,24 and is also the largest disruptor of grassland ecosystems. Overgrazing can cause extensive degradation of these grasslands2,25,26. However, grazing practices such as moderate grazing or excluding grazing altogether have slowed the rate of grassland degradation and, in some areas, even led to significant improvements in grassland ecosystems27,28,29. Livestock grazing significantly impacts the grassland carbon cycle30,31. The function of a grassland ecosystem as a carbon sink or source is directly influenced by the sustainability of grazing practices, which is particularly significant in the context of global change32,33,34,35. In recent years, there has been a significant increase in the number of studies that are designed to comprehend the impact of grazing on the carbon storage of grasslands36,37,38,39. However, these studies have predominantly focused on a limited number of sites and have reached varying conclusions due to differences in site location and grazing management. This suggests potential spatial heterogeneity in the impact of grazing on carbon storage in grasslands. However, previous studies on the impact of grazing on the storage of carbon in grassland at a regional scale remain relatively weak, particularly in alpine grassland. It is of enormous importance to comprehend the impact of grazing on the carbon storage of a grassland ecosystem at a regional level to enhance the carbon storage function of grasslands and to effectively manage grasslands to mitigate global climate change.
The Qinghai-Tibet Plateau (QTP), known as the ‘Third Pole of the World’, is a unique region on Earth, characterized by an average altitude exceeding 4000 meters40,41. The QTP has a fragile ecosystem and is highly sensitive to climate change and human activities42,43,44,45. It is also considered an ideal region for studying how grassland ecosystems respond to these changes44,46,47,48. Moreover, this region serves as an ecological buffer zone and plays a crucial role in the socio-economic development of China and the Northern Hemisphere more broadly49,50. The alpine grassland ecosystem is the predominant ecosystem type on the QTP, covering approximately 1.59 million km² and accounting for about 60% of the total coverage of the QTP51,52. Overgrazing has led to widespread grassland degradation on the QTP in the past, affecting the carbon storage capacity of grassland ecosystems to varying degrees47,48. To assess the impact of grazing on grassland carbon storage on the QTP, several studies have been conducted using observed data from limited sites. For example, Yu et al.53 examined the effects of grazing exclusion on soil carbon storage using data from 63 sites in the alpine grasslands of the QTP. They found that grazing exclusion resulted in increased soil carbon storage at most sites, with the degree of increase varying across locations. Dai et al.54 examined the effects of grazing management on carbon storage in both vegetation and soil based on field data in the Haibei station of the QTP. Their results demonstrated that long-term grazing exclusion could substantially increase carbon storage in both aboveground vegetation and soil in an alpine meadow. However, the spatiotemporal impacts of grazing on the carbon pool in grasslands of the QTP remain unclear based on these studies at limited sites due to the large spatial scale and complex surface of the QTP. This complexity has impeded effective grazing management in the region.
Current methods for estimating grassland carbon storage generally include field surveys, remote sensing, and modeling36,55,56,57. Field surveys are widely used to estimate carbon storage, but they are time-consuming and resource-intensive when applied to large areas. Moreover, data from site-scale surveys cannot effectively characterize the detailed spatiotemporal patterns of carbon storage over extensive regions58,59. Recent advancements in remote sensing technology and ecological modeling have facilitated research into the spatiotemporal distribution of carbon storage in grasslands56,60,61. Model simulation is an effective method for estimating the impact of human activities on grassland ecosystem carbon storage. Furthermore, it allows for comparative analysis under various climate and human activity scenarios within the same region compared to the use of remote sensing technology62,63. In this context, numerous models have been developed, including the Biome-Biogeochemical Cycles with Multi-layer Soil Module (Biome-BGCMuSo) model, which was first introduced by Hidy et al.64 and is based on the widely used Biome-BGC model65,66,67,68. The Biome-BGC model has also been successfully applied in the QTP58. Compared to the earlier Biome-BGC model, the Biome-BGCMuSo model more effectively simulates carbon storage and fluxes in terrestrial ecosystems, especially under conditions of energy and water stress64,69. The Biome-BGCMuSo can be used for the simulation of grassland carbon storage on the QTP given its cold climate and the wide distribution of grasslands under energy and water stress47,70,71. Moreover, the Biome-BGCMuSo model effectively considers grazing64,69.
This study employed the Biome-BGCMuSo model to simulate carbon storage of grasslands across a large area of the QTP. The objectives of the study were to: (1) assess the storage and spatiotemporal dynamics of vegetation carbon (VC) and soil organic carbon (SOC), and (2) analyze the impact of grazing on VC and SOC storage and their spatiotemporal dynamics in QTP grasslands from 1979 to 2018.
Results
Spatiotemporal dynamics in vegetation carbon density (VCD) and soil organic carbon density (SOCD) under historical climate 1979-2018 (non-grazing)
The average annual VCD of the entire QTP grasslands between 1979 and 2018 was 46.07 ± 7.19 gC/m2, representing the arithmetic mean of all grids under the climate change scenario (non-grazing) (Supplementary Figs. 1-3). There was a clear downward trend in VCD from 1979 to 1983, followed by fluctuations around 40.11 gC/m2 from 1983 to 1993. After 1993, VCD showed a fluctuating increasing trend at a mean yearly rate of 1.05 gC/m2, reaching a peak of 64.51 gC/m2 in 2018 (Fig. 1A), indicating that the changing climate during this period was generally beneficial for vegetation growth in this region. The grasslands of the QTP displayed distinct spatial variations in VCD. Generally, VCD increased from the northwest to the southeast, with the maximum values in the east and south reaching 739 gC/m2. In contrast, most subregions in the northwest had VCDs below 50 gC/m2 and minimum values were close to 0 gC/m2 (Fig. 1B). This spatial variation in VCD was primarily due to differences in hydrothermal conditions across the region. In general, temperature and precipitation in the southeast were more favorable for vegetation growth compared to those in the northwest20,48. This explains why VCD in the southeast was higher than in the northwest.

The average VCD at temporal (A) and spatial (the white color in the figure represents non-grassland areas) (B) levels, and average SOCD at the temporal (C) and spatial (the white color in the figure represents non-grassland areas) (D) levels in the QTP grasslands between 1979 and 2018.
The average annual SOCD for QTP grasslands from 1979 to 2018 was 3,789.79 ± 17.08 gC/m2, representing the arithmetic mean of all grids for the upper 100 cm under the climate scenario (non-grazing) (Supplementary Figs. 1–3). SOCD increased at the beginning, followed by a declining trend from 1982 to 2001; after 2001, there was a clear increase at an average annual rate of 3.79 gC/m2, reaching a peak of 3,837.27 gC/m2 in 2018 (Fig. 1C). This indicates that the changing climate during this period generally promoted SOC accumulation in this region. SOCD of QTP grasslands exhibited clear spatial heterogeneity, generally decreasing from southeast to northwest. The maximum SOCD was observed in the east and south, exceeding 30,000 gC/m2, while most subregions in the northwest had SOCD below 1000 gC/m2 (Fig. 1D). The spatial variation in SOCD was comparable to that in VCD (Fig. 1B, D).
Effects of grazing on VCD and SOCD
The interannual change in VCD in QTP grasslands from 1979 to 2018 was similar under both grazing and non-grazing scenarios, indicating the consistent impact of climate. However, VCD under grazing scenario was generally lower than that under non-grazing scenario, indicating that excessive grazing has diminished the grassland’s carbon sequestration capacity. Additionally, the difference in VCD between grazing and non-grazing scenarios increased with higher grazing intensities. Grazing from 1979 to 2018 resulted in a loss of 21.63 tg of grassland VC, representing 6.88% of the total VC under non-grazing conditions (Fig. 2A). Clear spatial heterogeneity was observed in the impact of grazing on grassland VCD. The area where the VCD reduced by grazing accounted for 88.05% of the total grassland area on the QTP. Significant decreases in VCD were predominantly found in the southwest and northeast regions, where grazing intensity was relatively high (Fig. 2B). From the perspective of the relative difference in VCD between the grazing and non-grazing scenarios, the areas showing that the significant decreases in VCD were found predominantly in parts of the southern and eastern regions (Fig. 2C).
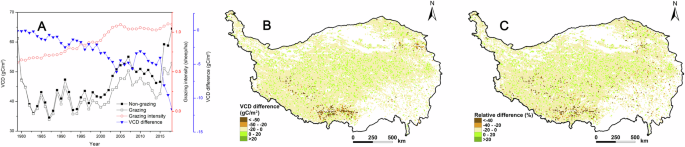
Temporal dynamics in VCD (A), spatial dynamics in VCD difference (B), and relative difference (C) between grazing and non-grazing scenarios in QTP grasslands from 1979 to 2018. (The VCD difference represents the annual average difference in VCD between grazing and non-grazing scenarios over this period. The relative difference is equal to the quotient of the VCD difference divided by the VCD in the non-grazing scenario.)
The interannual change in SOCD for the upper 100 cm of soil under the grazing scenario was comparable to that under the non-grazing scenario in QTP grasslands from 1979 to 2018. However, SOCD under the grazing scenario was generally lower than under the non-grazing scenario. Additionally, the difference in SOCD between grazing and non-grazing scenarios increased overall between 1979 and 2018 (Fig. 3A). By 2018, the loss of SOC in QTP grasslands due to livestock grazing reached 108.83 tg, representing 1.66 % of the total SOC under the non-grazing scenario (Fig. 3A). Clear spatial differences in the impact of grazing on SOCD were evident in the QTP grasslands. The area where SOCD was reduced by grazing accounted for 89.54% of the total grassland area on the QTP. In addition, significant reductions occurred in the southwest and northeast due to relatively high grazing intensity (Fig. 3B). The spatial variation in SOCD difference was similar to the spatial variation in VCD difference (Figs. 2B, 3B). From the perspective of the relative difference in SOCD between the grazing and non-grazing scenarios, the areas showing significant decreases in SOCD were found predominantly in parts of the southern and eastern regions (Fig. 3C).
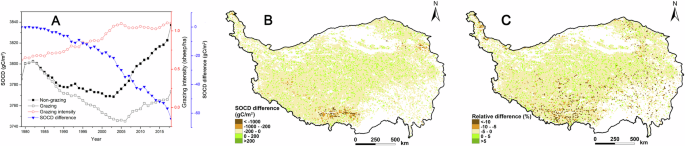
Temporal dynamics in SOCD (A), spatial dynamics in SOCD difference (B), and relative difference (C) between grazing and non-grazing scenarios in QTP grasslands from 1979 to 2018. (The SOCD difference represents the annual average difference in SOCD between grazing and non-grazing scenarios over this period. The relative difference is equal to the quotient of the SOCD difference divided by the SOCD in the non-grazing scenario.)
Discussion
The impacts of grazing
Grazing affects VC and SOC in grassland ecosystems through several underlying mechanisms. Firstly, grazing transfers VC from the grassland vegetation to livestock45,72,73,74. Secondly, grazing reduces plant productivity by decreasing the number of photosynthetic organs6,62. Thirdly, previous studies have shown that grazing weakens soil water conservation capacity, which in turn reduces plant productivity54,58. Fourth, moderate grazing can enhance plant productivity, as it represents a balanced level of grazing that avoids grassland degradation, as demonstrated by some studies28,62. The inputs of organic matter into the soils may be altered by grazing for these reasons. There was a marked connection (r = 0.95) between the spatial changes in differences in both VCD and SOCD in the QTP grasslands as VC is a crucial source of SOC (Figs. 2B, 3B)36,54. The first mechanism may be the most significant on the QTP, as grazing in the grasslands from 1979 to 2018 resulted in the loss of 21.63 tg of VC, excluding the VC consumed by grazing, while the loss of SOC reached 108.83 tg in 2018. This is because VC was a significant source of SOC, and the loss of VC caused by grazing was markedly lower than the loss of SOC36,54. The study revealed that grazing increased carbon storage in certain subregions of QTP grasslands due to moderate grazing practices in these areas (Figs. 2B and 3B). It should be pointed out that the grazing intensity associated with moderate grazing is closely related to the livestock carrying capacity of the local grassland, which is why the patterns of the differences in VCD and SOCD do not consistently match the grazing intensity patterns (Figs. 2B and 3B). Generally, grasslands with large livestock carrying capacities can have higher grazing intensities associated with moderate grazing62. The Biome-BGCMuSo model effectively accounts for the combined effects of livestock ingestion and manure on carbon storage under grazing scenarios64,69. Livestock ingestion may reduce carbon storage in the grassland ecosystem, while manure can enhance plant growth, and a significant portion of the carbon from manure is transferred to the soil. Thus, grazing has both positive and negative impacts on carbon storage in QTP grasslands. When the positive effects dominate, carbon storage increases with grazing; conversely, when the negative effects prevail, carbon storage decreases. However, many aspects of how grazing influences VC and SOC remain unclear and warrant further investigation in future studies.
On the QTP, the low temperatures resulting from high elevation inhibit organic material decomposition, allowing the organic matter to accumulate in the ecosystem for extended periods. This suggests that the ecosystem in this region can play a significant role in mitigating climate change53,54.
However, previous studies have shown that even small changes in ecosystem carbon storage can significantly impact atmospheric carbon dioxide concentrations3,5. The results of the current study revealed that grazing generally decreased VC and SOC in QTP grasslands, with increased grazing intensity leading to increased carbon loss from 1979 to 2018. These findings suggest a trend toward increasingly excessive grazing practices in QTP grasslands from 1979 to 2018. However, recent studies have reported an overall improvement in the ecology of QTP grasslands70,75, which is not contradictory to the results of the present study. The present study found that grazing did not obviously alter the interannual trends in VCD and SOCD of QTP grasslands from 1979 to 2018. VCD and SOCD showed increasing trends in recent years, even with grazing (Figs. 2A, 3A). This suggests an overall improvement in the ecology of QTP grasslands due to changing climate conditions, which has reduced grazing pressure on the ecosystem. Despite this, grazing decreased VCD and SOCD in most subregions, highlighting the widespread implementation of excessive grazing practices across QTP grasslands. This result was consistent with the widespread degradation of grassland on the QTP72,76,77. Subregions with significant decreases in VCD and SOCD due to high grazing intensity were primarily located in the northeast and southwest (Fig. 4). In these areas, relatively high vegetation productivity and dense populations led to excessive grazing activities to support human needs and economic interests, resulting in pronounced reductions in VCD and SOCD48,51. Although the combined effects of a changing climate and grazing have led to increases in VCD and SOCD in QTP grasslands in recent years (Figs. 2A and 3A), there is still a need to enhance grassland conservation efforts due to the negative impacts of grazing on VCD and SOCD in most areas. Grazing prohibitions have been implemented in several key protected areas of the QTP to protect the ecological environment78,79. However, this measure cannot be universally applied across the QTP, as livestock farming is the primary economic activity supporting most herders in the region. Additionally, failing to fully utilize the extensive grasslands of the QTP would result in a waste of valuable resources. Sustainable management of QTP grasslands requires a shift from traditional extensive grazing practices to more intensive management approaches. For example, in several regions of the QTP, herdsmen have begun to explore joint raising of livestock at the rural feedlots as part of their grazing management strategies80,81. By planting high-yield and high-quality forage grasses such as Avena sativa L. and Elymus nutans Griseb., these regions have alleviated grazing pressure on natural grasslands. This approach not only generated significant economic benefits for local herdsmen but also effectively alleviated the challenge of deterioration in the ecological environment82,83. Future studies should aim to identify more suitable livestock farming practices to achieve sustainable development in QTP grasslands, incorporating advancements in science and technology. It is important to note that this study considered grazing as the sole human disturbance affecting QTP grasslands, as the impacts of other human activities were minimal and challenging to quantify due to limited data.
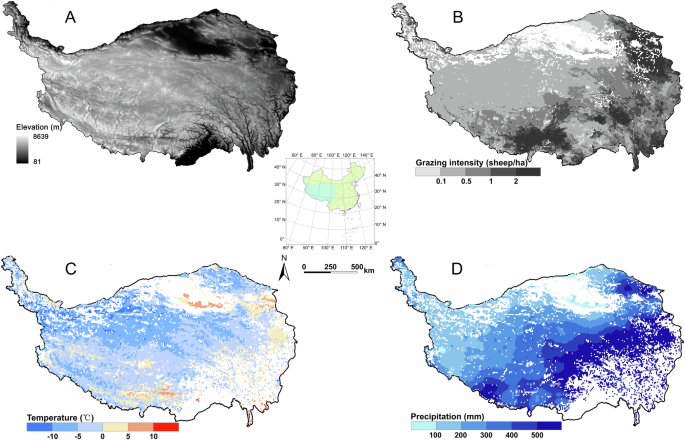
Distribution of elevation (A), yearly average intensity of grazing (the white color in the figure represents non-grassland areas) (B), yearly average temperature (the white color in the figure represents non-grassland areas) (C), and yearly average precipitation (the white color in the figure represents non-grassland areas) (D) in grasslands of the Qinghai-Tibetan Plateau between 1979 and 2018.
Uncertainty in the results
Model simulation is a valuable tool for estimating carbon storage in ecosystems60,69. The current study validated the reliability of the Biome-BGCMuSo model by comparing its simulations with observed data. Future research should focus on further validating the model through additional observed data. Enhancing the reliability of Biome-BGCMuSo simulations can also be achieved by minimizing sources of uncertainty. As all models are simplified representations of reality, they cannot fully capture the complexity of carbon processes in ecosystems, which introduces uncertainty in the simulations. For example, prior research has indicated that freeze-thaw cycles in permafrost regions of the Qinghai-Tibet Plateau can influence both the carbon storage and flux dynamics of the ecosystem84,85. However, this process has been poorly quantified and is consequently underrepresented in current ecological models. This limitation undoubtedly introduces uncertainty into the estimation of grassland carbon storage64,69. Secondly, the accuracy of model inputs significantly impacts the uncertainty of simulated results. The input data used for the Biome-BGCMuSo model in this study integrated field data and represented the most accurate information available for QTP grasslands. However, these data were less accurate than observational data, which inevitably introduced uncertainty into the simulation results86.
Comparison of the outcomes of the present work with those of previous studies
While some previous studies have investigated carbon storage in QTP grassland ecosystems, most relied on site-scale field surveys. For instance, Wen, et al.87 found that degradation reduced carbon storage in alpine grasslands of the QTP using field data. Yu, et al.53 observed a general increase in SOC under no grazing in QTP alpine grasslands based on field data. Dai, et al.54 reported that the long-term absence of grazing generally enhanced carbon storage in northern QTP alpine grasslands, also using field data. Liu et al.20 explored carbon pools across QTP biomes with regional field data, indicating that grasslands represented the largest carbon pool in the region. The QTP features extensive grasslands with a complex surface and some inaccessible terrain51,52. Therefore, estimating overall carbon storage in QTP grasslands through field sampling is challenging. Some studies have addressed grassland carbon storage in QTP subregions using remote sensing estimation or model simulation. For example, Zhang, et al.88 analyzed grassland carbon storage in the headwaters of the “Three-Rivers” Region using remote sensing data, while Wei, et al.75 identified grasslands as the largest carbon pool along the northeastern border of the QTP using the InVEST model. However, these studies on QTP subregions do not offer comprehensive insights into carbon storage across the entire QTP grasslands. Furthermore, previous studies relying on remote sensing or model simulations have not adequately addressed the effects of grazing on grassland carbon storage. Some research has focused on upscaling SOCD across the QTP using extensive observations. For example, Ding, et al.89 assessed permafrost organic carbon stock and spatial variations in alpine grasslands on the Tibetan Plateau by integrating systematic measurements from numerous pedons with machine learning techniques. Wang, et al.90 assessed SOC storage and spatial distribution at various depths using a machine-learning approach combined with observed data. Although their findings on spatial variations were similar to the non-grazing scenarios observed in the present study, they did not account for grazing effects. This study quantified spatiotemporal dynamics of carbon storage in QTP grasslands using the enhanced Biome-BGCMuSo model, focusing specifically on the impact of grazing on VCD and SOCD. The results demonstrated that the areas of reduced VCD and SOCD due to grazing accounted for 88.05% and 89.54 of the total area of the QTP grasslands, respectively, which aligns with the observed widespread degradation and supports previous findings that grazing generally decreases SOC across most QTP grassland sites53,54. It is important to note that this study represents the first systematic investigation of grazing effects on carbon storage at a regional scale in alpine grasslands. It enhances the understanding of carbon accumulation in these grasslands under changing climate conditions and varying grazing management practices, offering valuable insights for optimizing grazing strategies on the QTP.
Methods
Study area
The QTP is the largest and highest plateau on Earth, extending roughly 2800 km from west to east and 300–1500 km from north to south, with an area of approximately 2.5 × 10⁶ km2. The region is known for its complex terrain. The vast majority of subregions of the QTP are located at an elevation of 3000–5000 m above sea level (asl), with a mean elevation exceeding 4000 m asl. The QTP acts as a water tower and is the headwaters of various large rivers in Southeast Asia, East Asia, and South Asia. The climate of the QTP is influenced by the East Asian monsoon, Indian monsoon, southwest monsoon, and westerly circulation system, resulting in pronounced spatial variability in water and heat distribution. The average temperature of the warmest month is less than 10 °C in several subregions. The annual precipitation decreases from more than 500 mm in the southeast to less than 50 mm in the northwest (Fig. 4D). The QTP is exposed to an abundance of sunlight and radiation20,47. The QTP is primarily composed of typical alpine grassland in which C3 species predominate, covering an area of approximately 1.59 × 10⁶ km251,52. Grazing has been the primary use of the majority of grasslands since ancient times91. The QTP is a significant livestock grazing area in China (Fig. 4). The grassland ecosystem of the QTP has undergone significant changes as a consequence of the combined effects of livestock grazing and a changing climate over the past few decades. Grasslands on the QTP have experienced degradation to varying degrees, which has impeded the sustainability of local socioeconomic development20,47. In recent years, ecological protection on the QTP has gained increasing attention, with some areas implementing measures such as grazing bans for ecological restoration. Despite these efforts, ecological degradation remains a significant issue.
Biome-BGCMuSo model
This study utilized the Biome-BGCMuSo model, which effectively incorporates livestock ingestion and manure in the grazing process. You can find the details about the grazing process in this model in the publication by Hidy et al.64. This mechanistic model is used to simulate carbon storage and fluxes in terrestrial ecosystems64,69. The model was developed by integrating several key modules (including multi-layer soil modules, phenological modules, and human management modules, etc) into the Biome-BGC model. The model represents key ecological processes within terrestrial ecosystems, including photosynthesis, carbon allocation, defoliation, and respiration. Carbon is a key element tracked by this model, which estimates gross primary productivity (GPP) using Farquhar’s algorithm for photosynthesis92 and the enzyme kinetics model of Woodrow and Berry93. Net primary productivity (NPP) is calculated by subtracting autotrophic respiration from GPP. Autotrophic respiration, including both maintenance and growth respiration, refers to the respiratory process that occurs within the plant itself. The calculation of maintenance respiration is based not only on temperature but also on the function of the nitrogen content in living plant pools. As for growth respiration, it is an adjustable yet fixed proportion of the daily GPP. Meanwhile, net ecosystem productivity (NEP), which provides a direct measure of the carbon sequestration capacity of terrestrial ecosystems, is estimated by subtracting heterotrophic respiration from NPP94,95. Heterotrophic respiration is governed by the process of organic matter decomposition, which is described using the so-called converging cascade model68. The Biome-BGCMuSo model simulation follows the principle of conservation of matter and energy, which states that the matter and energy accumulated in the ecosystem equal the difference between what enters and what exits the ecosystem64,69. Vegetation carbon consists of the carbon present in plants and litter, including both aboveground and underground parts54. On the QTP, grazing was the most significant human disturbance affecting grasslands44,96,97. Compared to grazing, the impacts of other human activities, such as grassland tourism and mowing, on grasslands were minimal. Additionally, it was challenging to quantify these other disturbances due to insufficient data. Therefore, this study assumed that grazing was the only human activity affecting the QTP grasslands. This study assessed the impact of grazing on carbon storage by establishing two scenarios: grazing and non-grazing. Carbon storage in the grazing scenario was influenced by both climate change and grazing practices, while in the non-grazing scenario, it was primarily impacted by climate change alone. The impact of grazing was determined by comparing the results of these scenarios, subtracting the non-grazing results from the grazing results. We processed the relevant data using Python 2.6.5 and R-4.4.1 in the present study62.
The simulation process in this study comprised three stages (Table 1). The first stage, known as the spin-up simulation, led to the equilibrium state and was aimed at estimating the initial values of the state variables. It started with very low initial levels of soil carbon and nitrogen, and continued until a steady state (the change is smaller than a pre-defined limit (a constant defined within the source code of Biome-BGCMuSo)) was reached with the climate from 1979 to 201864,69. The second stage, the transient simulation which did not include grazing, was performed after the spin-up phase using the spin-up INI file settings. In the Biome-BGCMuSo model, preindustrial values for CO2 and N-deposition were usually adopted as the control during the spin-up phase, after which current CO2 and N-deposition values were used for the entire normal simulation. However, this logic may lead to undesired transient behaviors during the first few simulation years of the normal run as a sharp change for the CO2 and/or N-deposition data may be introduced. A transient simulation was therefore performed to avoid this undesired sharp change in the environmental conditions between spin-up and normal phases. The final stage, the normal run, conducted simulations of the current ecosystem of the QTP.
The Biome-BGCMuSo model was originally used for site-scale ecological simulation64,69. To apply the model at a regional scale, an R code incorporating a loop was designed. The QTP grasslands were divided into grids with a 10 km resolution, and the model was run across these grids using the R code (Supplementary R code). This approach enabled the generation of model outputs on a large scale 69.
Model inputs
A total of 17052 data points in square grids with a spatial resolution of 10 km were simulated. The model data inputs for this study comprised grazing data, meteorological data, soil data, physiological and ecological parameters, and elevation data (Table 2). Grazing intensity data for 2010 were obtained from the Gridded Livestock of the World (GLW3) dataset, managed by the United Nations Food and Agriculture Organization (FAO)98. The GLW3 is a peer-reviewed spatial dataset with a resolution of 5 arc min. To ensure the accuracy of the grazing intensity data for 2010, these data were adjusted using livestock statistics for different regions of the QTP from 2010 provided by local government sources. This study also generated time series grazing intensity data for the period from 1979 to 2018 by integrating livestock statistics from different provinces of the QTP for each year from the interval. This study standardized all livestock data to ‘units of sheep’ using conversion standards from the Chinese Ministry of Agriculture combined with insights from field surveys conducted with local herders. According to this conversion standard, a yak, horse, cow, goat, and camel are each equivalent to 4.5, 6, 6, 0.9, and 8 sheep, respectively. The average grazing intensity was determined across different regions and years in the QTP grasslands by dividing the number of ‘sheep units’ by the area of the corresponding regions and years. The time series grazing intensity data were then calculated between 1979 and 2018 using this average value of grazing intensity to correct the spatial data of the grazing intensity in 2010. The setting of the grazing duration was based on the results from field surveys conducted by local herders. The QTP grasslands were divided into warm season pastures (June to September) and cold season pastures (October to May) according to field investigations (Supplementary Fig. 4). The warm season pastures were primarily distributed in mountainous areas with relatively high altitudes, while the cold season pastures were located largely in nearby low-lying areas. During the cold season, animals were sometimes house-fed due to bad weather with heavy snow and a shortage of pasture grass. Thus, the duration of grazing in the cold season pastures was set to January to May in the model according to the proportion of house-feeding by local herders (Supplementary Fig. 4). These grazing data, including grazing intensity and grazing duration, were integrated with the model using a grazing module64. Meteorological data, including precipitation, temperature, shortwave radiation, and vapor pressure deficit, were sourced from the China Meteorological Forcing Dataset (CMFD) covering 1979-2018. The temperature, including the daily maximum air temperature (°C), the daily minimum air temperature (°C), and the average daytime air temperature (°C), were calculated using temperatures with a time resolution of 3 hours (from 6:00 to 18:00) from the CMFD. The vapor pressure deficit was estimated from the temperature, pressure, and specific humidity data from the CMFD (Supplementary formulas 1 to 3). This dataset, with a spatial resolution of 6 arc min, represents the most accurate reanalysis data available for this study86. Additional data used in this study included soil information, physiological and ecological parameters, and elevation data. Soil data, including soil pH and texture, were obtained from the Harmonized World Soil Database (HWSD) v1.2, which has a spatial resolution of 30 arc seconds99. The depth of soil was set to 100 cm in the Biome-BGCMuSo model as the roots were distributed primarily within a depth of 100 cm. The parameters for C3 grasses used in the model included the ratio of C:N in different compartments, all-sided to projected leaf area ratio, the ratio of shaded SLA: sunlit SLA, maximal stomatal conductance and any more (Supplementary Table 1). These physiological and ecological parameters of the vegetation were obtained from the published literature and local surveys71,100,101. The Biome-BGCMuSo model was more effectively applied to grasslands by calculating the start and end of the growing season using the heat sum growing season index, which was largely demonstrated by a previous study64. In addition, there were difficulties in quantifying the growing season with constants on the QTP since there is considerable spatiotemporal heterogeneity in the growing season on the QTP due to its extensive area, high altitudinal gradient, and complex terrain. Thus, in the present study, the start and end of the growing season in QTP grasslands were calculated using the heat sum growing season index in the Biome-BGCMuSo model. This method was found to be effective in estimating the grassland carbon on the QTP (Fig. 5). Details of the model parameter settings are provided in the Supplementary Information (Supplementary Table 1 and Table 2). Elevation data were obtained from the SRTM DEM dataset for the Tibetan Plateau (2012), with a spatial resolution of 90 meters, sourced from the National Tibetan Plateau Science Data Center. ArcGIS10.6 was used to resample all the spatial data to a spatial resolution of 10 km.
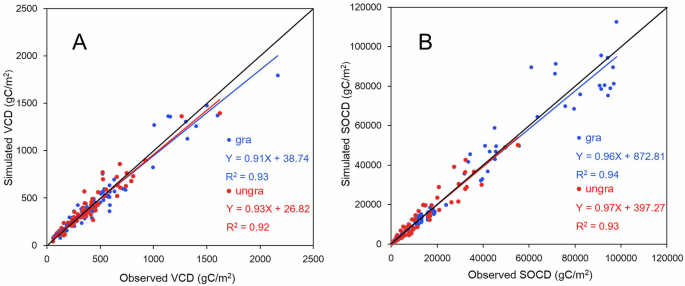
Comparison of simulated and observed vegetation carbon density (VCD) under grazing and no-grazing scenarios (A) and soil organic carbon density (SOCD) under grazing and no-grazing scenarios (B).
Validation of the model
The Biome-BGCMuSo model has been successfully applied in various regions102,103,104,105. The model outputs were validated by the collection of observational VCD and SOCD data for the grasslands of the QTP. The observational annual VCD and SOCD data were derived for 94 and 106 QTP grassland plots, respectively, by referencing past published studies and field surveys54,87,106,107. The sampling plots were scattered across different regions and altitudes of the QTP grasslands (Supplementary Fig. 5 and Table 3). Among the 94 plots with observational VCD data, 45 were in grazed grasslands and 49 were in fenced (non-grazed) grasslands. In addition, VCDs were collected in 25 sampling areas for both grazed and non-grazed scenarios. For the 106 plots with observational SOCD data, 50 were in grazed grasslands and 56 were in fenced (non-grazed) grasslands. SOCDs were also collected in 20 sampling areas for the grazed and non-grazed scenarios. All these data were collected after 2000. Most of the non-grazed grasslands had been fenced for over 5 years when collecting data. All these data were sampled at the end of the growing season in the representative areas. Prior to these enclosures, we set up the simulations according to actual grazing, while following enclosure, the simulations were set to “without grazing” (grazing intensity equal to 0). Observed data in grazed grasslands were used to validate the simulated results in the grazed scenario during the same period, while observed data in fenced grasslands were used to validate simulated results in non-grazed scenarios during the same period. A comparison of simulated VCD with observed VCD indicated that the Biome-BGCMuSo model performed well in estimating VCD under both grazing (R2 = 0.93) and non-grazing (R2 = 0.92) scenarios. Similarly, a comparison of simulated SOCD with observed SOCD showed that the model was effective in estimating SOCD under both grazing (R2 = 0.94) and non-grazing (R2 = 0.93) scenarios (Fig. 5).
Reporting summary
Further information on research design is available in the Nature Portfolio Reporting Summary linked to this article.


Responses