Grid-enhancing technologies for clean energy systems

Introduction
Renewable energy technologies, such as wind turbines and solar photovoltaics (PV), are being rapidly deployed to generate low-carbon electricity. In 2023, for example, ~507 GW of renewable energy source (RES) electricity capacity was added globally, an almost 50% increase from 2022 (ref. 1). This growth is expected to continue. Under current policies and market conditions, global renewable capacity is projected to reach between 7,300 GW and 8,130 GW by 2028 (ref. 1) (Fig. 1a). Intermittent energy sources such as solar and wind are expected to power 96% of new additions1 (Fig. 1b).

a, Cumulative renewable electricity capacity by technology, 2016–2028. Under current policies and market conditions, global renewable capacity is projected to reach between 7,300 GW and 8,130 GW by 2028 (ref. 1). b, Renewable electricity capacity additions by technology, 2016–2028. Renewable electricity capacity additions were an estimated 507 GW in 2023, an almost 50% increase from 2022 (ref. 1). Growth is expected to continue over the next 5 years, with solar photovoltaics (PV) and wind accounting for 96% of new additions1. RES, renewable energy source. Data from ref. 1.
Integration of intermittent RES into electrical grids is being slowed by ageing grid assets and the extensive investments and time-consuming construction required for grid upgrades2. Moreover, many utility-scale RES plants are geographically far from users, requiring more transmission facilities and capacity3,4. Such grid constraints delay the transition to decarbonized energy systems and increase curtailment and grid congestion2. For example, ~6,500 GWh of PV output was curtailed in Chile, China, Germany and the USA in 2018 (ref. 5). Additionally, the total reported congestion costs of regional transmission organizations in the USA increased by 100% from 2020 to 2021 and another approximately 56% from 2021 to 2022 (ref. 6). This congestion leads to higher electricity prices6; the estimated congestion costs for the USA was US$20.8 billion in 2022 (ref. 6). For European power grids, it was €4.2 billion in 2023 (ref. 7).
Grid-enhancing technologies (GETs) have been developed to alleviate congestion and maximize transmission capacity of the grid8, and are becoming increasingly important as large-scale intermittent RESs are integrated into the grid. GETs are hardware and software solutions deployed within the existing energy system, with the goal of increasing its capacity, flexibility and reliability9. Their effectiveness has been demonstrated in power grids globally, where they have been used to alleviate congestion, facilitate the interconnection of RESs, reduce RES generation curtailment, and provide situational awareness and flexibility. GETs will become increasingly important as grids age, but substantial research is still needed to determine when, where and which technologies — or combinations of them — should be deployed.
In this Review, we discuss the use of GETs, summarizing existing global deployment cases of GETs and their achievements. We provide an overview of the development trends of GETs, the infrastructure needed for future development of GETs, the challenges faced and potential solutions.
Congestion and transmission capacity
Energy flow follows strict physical laws in energy systems, originating from generation equipment, passing through transmission and distribution systems, and ultimately reaching electricity consumers. Energy systems must operate at stable currents, voltages and frequencies to deliver the required power to load centres efficiently at low cost10. The increased contribution of RESs to energy grids means that the overall energy supply is more variable and harder to control, as power generated by RESs is variable and depends on factors like wind speed and solar intensity2. The variability can cause power peaks (for example, on a sunny, windy day), especially in systems with a high penetration of RESs and high loads. Excessive power can cause heating owing to material limitations of transmission technology, which can cause congestion2. As a result, lines with physical limits designed for previous energy levels often experience congestion.
The capacity of transmission lines is constrained by thermal, voltage and stability limits11,12. Thermal limits generally refer to the maximum current or power a transmission asset can carry without causing equipment damage due to overheating2. Thermal limits are associated with the maximum or emergency operating temperatures of conductors and transformers. For example, the typical maximum allowable conductor temperature of overhead bare transmission lines ranges from 50 °C to 180 °C (ref. 13). Meanwhile, the average winding temperature for oil-immersed transformers is rated at 55 °C or 60 °C (ref. 14). Amounts of electricity transmitted that exceed the rated values for prolonged periods can lead to the deterioration of these devices, shortening their lifespan and potentially causing damage15. Thermal limits are affected by environmental factors such as temperature, sunlight and wind speed12,16.
Voltage limits ensure that voltage drops along the length of a line remain within acceptable bounds (typically ±5% or ±10% of rated voltage) and are primarily affected by the reactance of the conductor12. Voltage limits include lower and upper constraints, which are local constraints typically caused by insufficient local generation to support loads or generation exceeding the loads, respectively. For power systems with high penetration of RESs, undervoltage areas are usually those far from RESs owing to long-distance transmission losses, whereas overvoltage areas are typically closer to RESs owing to large amounts of power injections17. Moreover, owing to the intermittency and uncertainty of weather-dependent RESs, undervoltage and overvoltage have temporal variability. For instance, under strong sunlight or wind conditions, RESs can generate excessive electricity beyond the grid’s load demand, leading to overvoltage issues. Conversely, during no-wind or night-time periods, the lack of sufficient alternative RESs can lead to undervoltage issues17. When the voltage is too low, more current is required to meet the same energy transmission needs, leading to transmission line congestion due to the increased temperature of conductors. Conversely, high voltages can damage insulation and connected equipment2.
Power system stability is the ability of an electric power system, for a given initial operating condition, to regain a state of operating equilibrium after being subjected to a physical disturbance, with most system variables chosen so that the vast majority of the system remains intact10. Breaches of stability limits are often caused by sudden changes in loads, faults in system devices, extreme natural disasters and human operational errors10. The long-distance integration of RESs further exacerbates stability issues owing to reduced system inertia18. Depending on the system, stability limits could impose stricter transmission constraints than thermal limits.
Typically, the ratings of short transmission lines (under 50 miles) are determined by thermal limits, medium-length lines (50–200 miles) are constrained by voltage limits and long lines (more than 200 miles) are restricted by stability limits12. Transmission line capacity is usually referred to in terms of its thermal limit, and ratings based on thermal limits tend to be higher than those imposed by stability limits16. However, thermal limits might not be the actual line power transfer limits, as the stability constraints can be reached first2. Therefore, the stability and voltage limits must be considered together with thermal limits to determine the actual power transfer limits of transmission lines10.
The maximum transmission capacity of a line is limited to ensure its safe and reliable operation. Traditionally, when thermal limits are considered, transmission line capacity is determined using static line ratings (SLRs), which rely on conservative assumptions about annual or seasonal weather conditions, such as fixed weather conditions, average wind speeds and directions, average ambient temperatures, and solar conditions for summer and winter seasons16. SLRs result in an inflexible operation, meaning that they do not exploit favourable variations in environmental conditions (such as wind cooling and cryogenic conditions) that could enable higher transmission usage, nor can they reduce the transmission power to prevent equipment damage in extreme scenarios, where actual capacities fall below SLRs16,19. Some flexibility can be provided by ambient adjusted ratings, which adjust line ratings according to the ambient air temperature but do not consider the effects of wind or sunshine5. Compared with SLRs, ambient adjusted ratings better reflect real-time environmental conditions but the extra capacity they provide is generally around or below 10%, which is not enough in most cases, as they do not account for all real-time weather conditions19,20.
Grid-enhancing technologies
Traditional solutions to power grid congestion involve expanding, upgrading or rebuilding transmission assets. In the long run, these solutions are necessary, but they entail substantial financial investment and lengthy delivery times, which might not address short-term congestion issues effectively2. Moreover, during construction, parts of the grid might have to be temporarily disconnected or operate at reduced capacity, potentially exacerbating congestion or causing reliability issues in certain areas. By contrast, GETs are more cost-effective and can be deployed quickly, such as in a few weeks or months, providing short-term returns on investment and holding substantial potential for further research2 (Fig. 2). Examples of GETs that are increasingly being deployed in power grids include dynamic line ratings (DLRs), dynamic transformer ratings (DTRs), power flow controls (PFCs), topology optimization (TO), advanced conductor technologies (ACTs), energy storage system (ESS) deployment and demand response (DR).
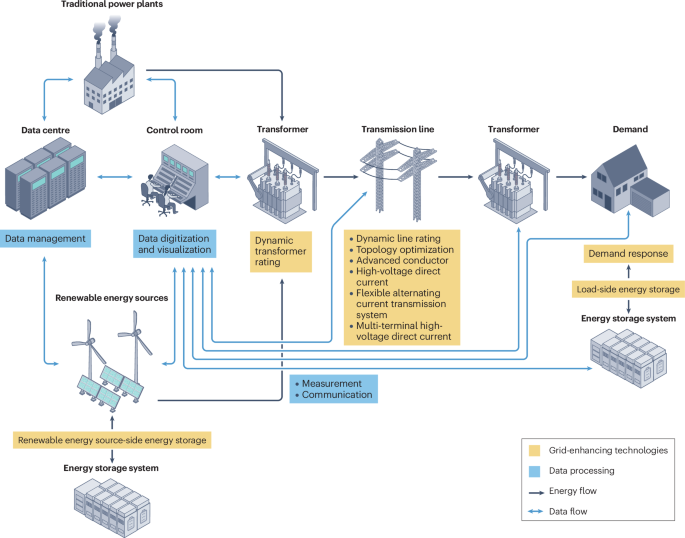
Grid-enhancing technologies (GETs) include dynamic line rating, dynamic transformer rating, power flow control, topology optimization, advanced conductor technology, energy storage system and demand response. These GETs can be integrated individually or as groups into energy systems to reduce congestion and increase security. Data collection, management and processing provide feedback and control of GETs.
Dynamic line ratings
DLRs can actively adjust the presumed thermal capacity of overhead power lines in response to real-time environmental and weather conditions, and can be applied to lines where the conductor is the thermally limiting element21. These ratings enable the exploitation of potential line capacity under high load conditions and prevent the risk of line damage due to overloading under extreme conditions12 (Fig. 3a). They also increase situational awareness of the system operators and offer the potential for condition-based monitoring of transmission lines16.
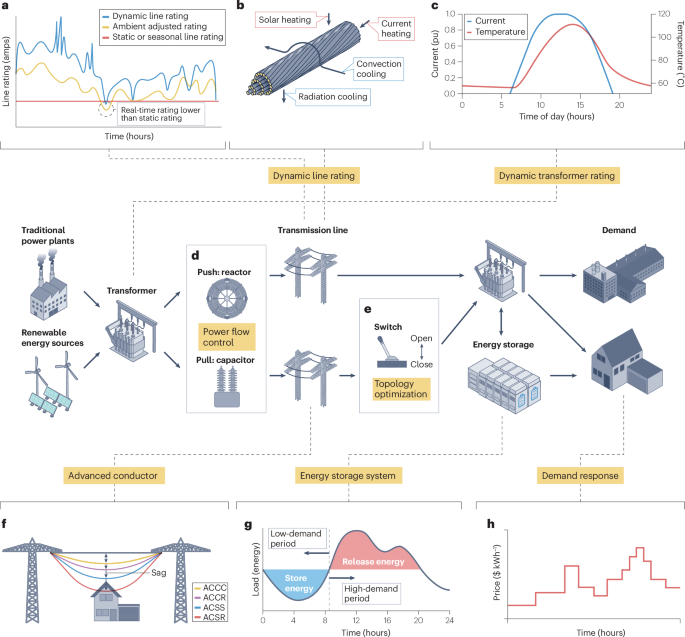
Grid-enhancing technologies operate in various ways to prevent and alleviate congestion. a, Comparison of dynamic line rating (a grid-enhancing technology) versus static line rating and ambient adjusted rating12. b, Overhead conductor heating and cooling. Convection and radiation cooling contribute to cooling the conductor, while solar and current heating raise the conductor’s temperature16. c, Current and temperature of a dedicated photovoltaic transformer. The temperature is time-lagged compared with the passed current owing to thermal inertia2. d, Power flow control can push power away from overloaded lines and pull it towards underutilized ones. e, Topology optimization can reroute power from congested areas to underutilized regions by altering switches’ opening and closing states. f, Transmission line sag comparison at 180 °C. Aluminum conductor composite core (ACCC), aluminum conductor composite reinforced (ACCR) and aluminum conductor steel supported (ACSS) sag less than aluminum conductor steel reinforced (ACSR), maintaining a safer distance from buildings, trees, pedestrians and vehicles below159. g, Daily energy storage and load levelling. Battery energy systems store energy during low-demand periods and release it during high-demand periods to balance the daily fluctuations in demand101. h, Real-time pricing is updated at short notice, typically hourly, based on actual market conditions130. Panel a adapted with permission from ref. 12, US DOE. Part c adapted from ref. 2, US DOE. Panel g adapted with permission from ref. 160, University of Michigan, after Sabihuddin, S. et al. (2015) A Numerical and Graphical Review of Energy Storage Technologies. Panel h adapted with permission from ref. 130, Elsevier.
DLRs are calculated on the basis of real-time environmental conditions (such as temperature, wind speed and direction, solar radiation and rainfall) and line characteristics like line loading, clearances to surrounding objects, conductor sag, tension and conductor temperature12. The implementation of DLRs requires three key components: weather data from meteorological stations or line-based sensors, communication devices to receive and transmit measured data, and software for data analysis and quantification of the line’s thermal capacity15.
DLRs can be calculated by either direct or indirect methods15. Indirect methods calculate the thermal capacity of transmission lines using data from existing meteorological stations and sensors22. By contrast, direct methods require the installation of new hardware on line segments23. The heat balance equation, which describes the thermal energy entering and leaving a conductor, is used to calculate DLRs under various environmental conditions13. In this equation, convection and radiation both contribute to cooling the conductor, thereby increasing its capacity16. Conversely, solar and current heating raise the conductor’s temperature, thereby reducing its capacity16 (Fig. 3b). Radiative cooling generally has a minor effect, whereas convective cooling has a larger role, particularly under high wind speed conditions15,24. For lines under heavy load, the effect of heating due to current is more pronounced than that of solar heating15,24.
The standard methods for calculating the ampacity of transmission lines, based on the heat balance equation, are defined by the Institute of Electrical and Electronics Engineers (IEEE) standard 738 (ref. 13), and International Council on Large Electric Systems (CIGRE) technical brochures 207 (ref. 25), 299 (ref. 26) and 601 (ref. 27). If time-dependent changes in thermal conditions are considered, heat balance equations are divided into steady-state and transient heat balance equations13.
The steady-state heat balance equation assumes that the conductor is in thermal equilibrium (steady state), which provides a simplified, time-invariant perspective suitable for long-term planning and design. By contrast, the transient heat balance equation accounts for step changes in current, offering a more detailed and responsive approach essential for real-time operation and analysis of transient phenomena13,28. For example, the nonlinear characteristics of transient heat balance equations and power flow equations were effectively used to enhance the accuracy of electrothermal coordination decisions29. As transmission lines span long distances with varying environmental conditions at different locations, the line rating will change with position. However, the final line rating is determined by the lowest capacity along the entire line19.
Indirect methods are cost-effective as they use weather data along the lines and do not require specific line monitoring sensors30. For instance, DLRs can be used to enhance the situational awareness of utilities, allowing for more efficient and less drastic solutions than unnecessary power outages31. DLR forecasting models based on historical meteorological data have been developed to enhance cybersecurity and assess the robustness of the forecasts against false data injection attacks32. Historical meteorological data has also been used with probabilistic forecasting of both DLRs and wind power generation in solving energy dispatch challenges, potentially reducing wind power curtailment and lowering dispatch costs in a wind-dominated, highly congested network33.
Direct methods use sensors that are directly attached to the conductor or towers, or placed on the ground to measure variables at each segment such as conductor temperature, conductor sag, line tension or clearance between the conductor and the ground23. The additional ampacity available on the conductor is calculated from the combination of the instantaneous load with one or more of these measured variables, accounted for limitations related to sag, tension or temperature23.
Direct and indirect methods do not always produce the same results. Direct methods that gather data from the transmission line through real-time monitoring provide superior accuracy and precision to indirect methods15. However, they require considerable investment in sensor deployment and incur high maintenance costs, especially when coverage is extended to all spans or segments of a long line23. By contrast, indirect methods can be implemented more broadly at a lower cost but are less precise due to uncertainty in the weather data2,15. To reduce costs, direct methods can also opt to install sensors only on critical spans34.
Dynamic transformer ratings
Like DLRs, DTRs monitor transformer operating temperatures and actively determine current limits based on real-time information2. Thermal limits imposed by transmission lines and transformers account for approximately 42% and 9% of total capacity constraints, respectively35. For interconnected transformers and transmission lines, the maximum transmittable current is determined by the device with the smallest capacity15. For transformers affected by congestion, traditional solutions involve installing larger capacity transformers or increasing the number of transformers. These solutions are expensive, exceeding one million dollars, and delivery times often exceed 5 months, potentially extending up to 2 years in times of high demand36.
The transformer capacity is traditionally based on its nameplate ratings (similar to SLRs for transmission lines), which set a fixed maximum allowable load under standardized conditions14. However, actual capacity varies according to operational conditions (normal, contingency or short-term emergency), seasonal changes (summer or winter) and daily cycles (daytime or night-time)2. Fixed nameplate ratings therefore overlook the potential capacity of the transformer in many circumstances, thus limiting the integration of more RESs2.
Using a transformer’s maximum load capacity requires an understanding of its thermal limits, which are primarily governed by the hottest-spot temperature (HST)37,38. In the most commonly used large transformer, the oil-immersed transformer39, the flow of current through the windings and core of the transformer generates heat, which increases the temperature of the transformer oil. Therefore, the temperature profile within a transformer is not uniform2. Using sensors and transformer models to assess the HST is important, as localized overheating in hot spots is often the primary cause of transformer degradation and failure2.
Factors affecting HST include ambient temperature, electrical load, transformer age and cooling system efficiency2. HST exhibits thermal inertia, particularly with regard to the temperature of the transformer’s coolant oil. Thermal inertia is most evident in transformers connected to PV systems, where the temperature is noticeably time lagged compared with the passed current2. This temperature lag is because the thermal mass of the transformer slowly adjusts to the heat generated by the passed current (which aligns with the daily power production profile of PV) (Fig. 3c). This characteristic is leveraged in transformers dedicated to PV systems and enables them to maintain function (ride through) periods of peak load2.
There are two methods for calculating DTRs according to the IEEE standard C57.91 (ref. 14). The standard method determines the transformer oil and winding temperatures based on load variations, eliminating the need for iterative processes. It approximately accounts for variations in load loss and oil viscosity due to temperature changes and assumes that the oil temperature in the cooling ducts is the same as the tank top oil temperature during overloads. An alternate temperature calculation method is also described by the standard to account for the rapid rise of oil temperature in the winding cooling ducts during overloads, which can exceed the top oil temperature within the tank. This method is more computationally expensive but provides a more accurate representation of the changes in load loss and oil viscosity, attributable to shifts in resistance and oil temperature, respectively, and incorporates the effects of fluctuating ambient temperatures14.
DTRs unlock additional capacity by more accurately reflecting transformer capabilities compared with the traditional approach based on nameplate values. By closely monitoring transformer conditions, system operators can safely operate equipment at increased electrical loads. For instance, the normalized load shape profile of a transformer can be constructed by incorporating the 24 h loading profiles of existing transformers and probabilistic relationships between existing transformers and future transformers40. Additionally, the feasible region for DTRs can be calculated from current and temperature limitations and various shapes of net load profiles41. Moreover, the transformer top oil temperature can be estimated using a Kalman filter, thereby presenting its overload capability during both short and long durations42,43. The probability of the DTRs exceeding the load was predicted using an exact analytic stress-strength model, which can be used to issue a warning if the expected probability surpasses a predefined threshold44.
These improvements are valuable given the expanding integration of RESs, such as wind45 and PV systems46, as well as the rapidly increasing demand from electric vehicles47. Most importantly because overall system transmission is constrained by the component with the lowest capacity limit, the combination of DLRs and DTRs results in a more substantial increase in transmission capacity than implementing only one of them48.
Power flow controls
Electricity grids incorporate redundancies such as spare lines and loops. A solution to alleviate congestion is transmitting power from overloaded to underused lines in grids that have loops. However, electricity inherently flows along paths of least impedance and needs to be actively directed to avoid congestion2. PFC technologies, which are categorized into alternating current (AC) PFCs and direct current (DC) PFCs12,49, are used to actively alter the power flow through an energy system.
Alternating current power flow controls
The power flow through AC transmission lines is directly proportional to the product of the voltages at both ends of the line and the sine of the phase angle difference between these voltages and inversely proportional to the line’s reactance50. AC PFCs can redirect power flow from overloaded lines to underutilized ones by adjusting one or more of these four parameters: the voltage at the beginning of the line, the voltage at the end of the line, the phase angle difference between the two ends and the line’s reactance12,50. The earliest AC PFCs used phase-shifting transformers, tap-changing transformers and capacitors or reactors to control power flows in transmission lines by adjusting phase angle difference, voltage levels and line reactance, respectively12 (Fig. 3d). However, these early methods used mechanically switched devices, leading to slow response times and coarse control in discrete steps12.
AC PFCs based on power electronic devices are known as flexible AC transmission systems (FACTS). FACTS perform the functions of shunt compensation, series compensation, shunt-series configuration and back-to-back configuration to dynamically control one or more of these parameters51, with a faster response speed than older PFCs owing to the use of advanced power electronic switches12. In addition, FACTS provide more precise control to mitigate the effects of transients and other electrical phenomena that can destabilize the grid compared with the coarse discrete control of older PFCs12. FACTS can be various devices such as voltage source converters, static synchronous compensators, thyristor-controlled series capacitors52 and unified power flow controllers53. The roles of FACTS include increasing the penetration of RESs, improving power transfer capacity, achieving fast dynamic voltage regulation and frequency control, balancing power and enhancing stability margins51,54.
A variety of modelled FACTS have been proposed. The real-time coordinated operation of distributed static series compensators could release network congestion by suitably modifying the branch reactance55. Additionally, series FACTS devices were used to enable high penetration of RESs owing to their capabilities in continuously controlling power flows on transmission lines56. A stochastic assessment framework that integrates probabilistic DLR forecasts and FACTS was proposed57. In addition, a cost-effective hybrid power flow controller exhibited good performance in managing momentary voltage sags caused by faults, as well as power flow fluctuations due to a PV generator58,59.
Direct current power flow controls
DC PFC is more complex and costly to control than AC PFC, but offers greater flexibility12. DC PFC is needed to rapidly increase the installation of RESs, especially offshore wind farms and large solar power farms, which are situated far from demand areas60. The earliest DC PFCs used line commutated converter-based high-voltage direct current (HVDC) systems, connecting two AC systems via converters (AC-to-DC on one end and DC-to-AC on the other) to enable point-to-point long-distance, high-power transmission61.
New power electronics technologies led to the introduction of voltage source converter (VSC)-based HVDC. VSC-HVDC devices provide voltage support within the grid and enable more flexible PFC than line commutated converter-based HVDC62. Additionally, the two AC systems connected by HVDC can operate asynchronously, allowing faults to be confined within the AC system where they occur, which prevents cascading failures63. Since the late twentieth century, two-terminal HVDC systems have evolved into multi-terminal HVDC systems, enabling the integration of multiple DC RESs into the grid, particularly offshore wind farms and remote solar power plants64,65. Since the 2010s, multi-terminal VSC-HVDC systems have garnered significant attention and been increasingly deployed66,67. For example, a multi-terminal VSC-HVDC power system was used for the optimal integration of large-scale offshore wind energy into the power grid68. In addition, an adaptive control strategy for the multi-terminal VSC-HVDC network was used to provide frequency support and power sharing between different terminals69.
Topology optimization
Topology optimization (TO) is a software technology that automatically finds reconfigurations to route flow around congested elements12,70. Power disparities in energy systems arise from the distance between generation and load, especially with remote solar and offshore wind, leading to power transmission on lines not proportional to their capacity12. Typically, only a few transmission facilities experience congestion, while most of the system’s facilities have surplus capacity2. Owing to the redundancy built into the grid, TO can reconfigure the grid’s topology by altering the on and off states of circuit breakers. The resulting power flow changes reroute power from congested areas to underused regions2,71. If some transmission facilities are in a standby mode, switching them on via circuit breakers can greatly alleviate nearby transmission congestion72 (Fig. 3e). TO can be easily integrated with other GETs, such as DLRs72, to substantially improve power system reliability, especially for electricity grids with limited transmission capacities.
Most TO efforts rely on time-consuming manual processes and operator experience to identify viable topology candidates in advance12. Nonlinear programming methods that include the on and off states of switches are therefore used to obtain more accurate TO solutions while considering security constraints73. For example, a mixed-integer program determined the topology transition trajectory from an initial topology to a desired terminal topology74, and this program enabled automatic and rapid identification of optimal TO strategies that satisfied all constraints75. A machine learning approach was developed for autonomous optimal control, using only topology changes76. Additionally, machine learning and Monte Carlo tree searches were combined to TO and generator redispatch77.
TO operates under ideal conditions, assuming that the parameters of the power system model and the status of circuit breakers are accurate and known78. However, obtaining accurate parameters for the actual grid (especially the distribution network) is challenging due to equipment updates, maintenance and changes in external environmental factors79. Additionally, the states of circuit breakers constantly change due to grid maintenance, emergency responses and flow optimization. Operating circuit breakers on an inaccurate topology could lead to system failures and outages. The combination of models and data can partially address these issues80. For example, data-driven regression methods and power system models were used together to evaluate topology and line parameters80. Additionally, a large set of historical data and machine learning was used to predict real-time topology81. It is worth noting that data-driven graph neural networks are especially effective for TO owing to their inherent capability to process graph-structured data, which enables precise topology identification82.
Advanced conductor technologies
ACTs are replacement overhead conductor cables made from materials and methods specifically chosen to overcome issues faced by older conductor designs. Overhead conductors are usually aluminum conductor steel reinforced (ACSR) conductors, which consist of hardened aluminum strands encircling a galvanized steel core83. As electrical current flows through these conductors, their temperature rises owing to electrical resistance. ACSR conductors are designed to withstand continuous temperatures up to 93 °C (200 °F) without incurring damage and can tolerate even higher temperatures for short periods during emergencies83,84. During high-temperature operation, however, aluminum conductors can undergo annealing, resulting in a decrease in tensile strength83. Mechanical loads can then cause permanent creep, which increases sag84. Sagging becomes an issue because conductors must maintain a certain safe distance from the ground, buildings, trees and people to prevent accidental electrocution. Consequently, clearance becomes a critical factor in determining the capacity of transmission lines84.
When conductors frequently face congestion issues, one approach to increase capacity is to rebuild the lines with higher voltages and double circuits. However, this approach is very costly and time-consuming. Policies, laws, and regulations (Box 1) such as regional prohibitions on constructing high-voltage lines or the need for long-term approvals, can extend project timelines to up to a decade83. A widely used alternative is to use ACTs for reconductoring, which only requires replacing the existing transmission conductors with minimal or no changes to the other transmission structures. Typically, ACTs require only one-third of the investment and a fraction of the time to reconductor, substantially cheaper and faster than rebuilding new lines83. Furthermore, the low sag characteristics of ACTs enable their use in scenarios that require crossing long spans between support structures, such as across rivers and other natural obstacles83.
ACTs, also known as high-temperature low-sag (HTLS) conductors, have better ampacity and heat resistance and reduced sag compared with ACSR. ACTs can operate continuously at temperatures of at least 150 °C and provide double the ampacity of ACSR84,85. In a survey of 44 utilities in the USA, 70% reported deploying advanced conductors83. Aluminum conductor steel supported (ACSS) designs are one of the widely used HTLS conductors, which are similar to ACSR but use annealed aluminum instead of hardened aluminum and have a higher temperature zinc/aluminum mischmetal coating on the steel core83. Compared with ACSR, ACSS offers double the ampacity owing to its higher maximum operating temperature (up to 250 °C), increased conductivity for more efficient conductor performance, less sag at equivalent temperatures and similar installation methods83,86.
Other commonly used advanced conductors include aluminum conductor composite core (ACCC)86,87 and aluminum conductor composite reinforced (ACCR)87 (Fig. 3f). Contemporary advanced conductors, using stronger materials that sag less at high temperatures and enhanced with heat-dissipating coatings, surpass traditional steel-cored ACSR in capacity and efficiency. Steel cores in traditional conductors were replaced by carbon or ceramic fibre composite matrix materials, or ultra-high-strength steel in advanced conductors. Replacing traditional conductors with stronger materials allows for extra aluminum to be added, increasing ampacity83,84.
The decision of when and where to replace existing installations with HTLS conductors has been influenced by factors such as transmission capacity needs, line age, investment cost, technical performance and operational efficiency, and how this choice compares with traditional reinforcement solutions was evaluated in terms of cost-effectiveness and long-term planning88,89. Although HTLS conductors are cheaper than building new lines, they still require time and investment to implement. Most utilities cannot afford to upgrade the whole grid to HTLS; instead, upgrading critical lines is the most cost-effective strategy83. Additionally, owing to the higher risk of the SLR exceeding the maximum allowable conductor temperature for HTLS conductors, it is necessary to study adaptive SLR or DLR to address this risk90.
Energy storage systems
Generation and load must be balanced in real-time in power systems, but RES can oversupply power, especially when there is transmission congestion, leading to load shedding and waste of low-carbon electricity91,92. Furthermore, the intermittency and uncertainty of RESs disrupt the real-time balance between generation and load. As the proportion of RESs increases, their effect on the power system intensifies, with 30% of RES generation marking a threshold beyond which higher integration necessitates enhanced grid flexibility for effective management93. ESSs can store energy to smooth out mismatches in power supply and demand, addressing the intermittency and uncertainty of RES generation and preventing load shedding and curtailment of RESs94,95.
There are daily, weekly, seasonal and spatial mismatches in power generation and demand. Daily imbalances arise owing to the daily load peak occurring during the evening, whereas the output peaks of wind and PV farms occur during the night and at noon, respectively96. Weekly mismatches are primarily caused by consecutive days of cloudy or windless weather conditions96. Seasonal mismatches are mainly due to the variations in climate across different months96. Spatial mismatches create a demand for long-distance power transmission, moving power generated by RESs from remote areas to energy consumption centres. For example, Germany’s wind farms are located in the north, while industrial consumers are primarily in the southern regions such as Bavaria and Baden-Württemberg97.
ESSs located at different positions in the grid can provide different functions98. RES-side ESSs help smooth RES generation fluctuations, as the power generated by RESs can be stored in ESSs before being injected into the power grid to mitigate intermittency and uncertainty99. Load-side ESSs can quickly respond to load variations, offering essential electricity support100. Additionally, load-side ESSs can store energy during periods of high RES generation and low demand, then supply power during peak periods, thereby reducing congestion during high electricity usage periods, increasing the utilization of RESs, and addressing the temporal and spatial mismatches between RES generation and load101,102 (Fig. 3g). The size of ESSs affects their duration of continuous charging and discharging103. The maximum power of charging and discharging and the response time determine how quickly and effectively they can respond to sudden fluctuations in generation or load. Typically, the response speed of ESSs is much faster than that of gas or steam turbines, with a minimum response time of tens of milliseconds, which is further improving as technology advances104. Moreover, charging or discharging strategies for ESSs can be developed through optimization algorithms to alleviate transmission congestion and enhance overall economic efficiency105,106.
The cumulative global installed capacity of ESSs was 237.2 GW by the end of 2022, with an annual growth rate of 15% compared with 2021 (ref. 107). Existing ESS technologies include mechanical, chemical, electrical, electrochemical and thermal energy storage, each of which is suited to different scenarios108,109. For instance, in mechanical energy storage, pumped hydro storage and compressed air storage are suitable for large-scale high-capacity applications, while flywheel storage suits for applications requiring high power density and long lifespan108,110. Chemical storage, like hydrogen fuel cells, can be used as long-duration energy storage108,111. Electrical storage, including supercapacitors, and superconducting magnetic energy storage can store a significant amount of energy for short-term usage108,112. In electrochemical storage, lithium-ion batteries — owing to their high energy and power density — are suitable for both transportation and stationary applications109,113. They have gained significant interest, accounting for more than 85% of new energy storage deployments in 2016 (refs. 107,109). Thermal energy storage is widely used for heating or cooling services108,114.
ESS can be integrated with other GETs. For example, the integration of ESSs with TO was used to integrate RESs and reduce total operational costs115. Another combination involves integrating ESSs, TO and DLR116. Machine learning was used for the real-time automatic routing and scheduling of multiple mobile ESSs117. Moreover, the integration of multiple dispersed ESSs achieved the same functions as traditional ESSs118.
Demand response
Grid congestion can be alleviated by implementing DR technologies to shape demand, shifting loads away from peak congestion periods. The charging of ESSs and electric vehicles, along with other adjustable loads, can be shifted from peak to off-peak times or to times of high RES generation119,120. The integration of these distributed resources can also be viewed as a virtual power plant121. The advantages of implementing DR include decreasing transmission congestion at peak periods, lowering overall generation costs due to higher utilization of RESs, reducing the need for investments in new transmission infrastructure, and reducing total energy bills for consumers by shifting their electricity consumption to when it is cheaper122.
The global buildings sector accounted for 30% of the energy demand in 2022, primarily for operational needs such as heating and cooling, which have the potential to participate in the DR regulation of power systems123,124. The extensive and rapidly increasing construction of data centres and infrastructure for training artificial intelligence (AI) models, which consume vast amounts of energy, has introduced new pressures on the overtaxed grid. For example, the data centres account for around 2–4% of total electricity consumption in the USA, China and the European Union in 2024 (ref. 125). However, owing to their spatial concentration, this proportion has already exceeded 10% in at least five US states125. DR can reduce the energy system operation cost and enhance social welfare by shifting data centre demand126.
DR can be categorized into incentive-based and price-based programmes127. Incentive-based DR rewards participants with direct financial incentives to reduce their electricity consumption upon requests from the grid operator. Incentive-based DR can be further divided into direct load control programmes, load curtailment programmes, demand bidding programmes and emergency demand reduction programmes128. Direct load control programmes allow the utility to shut down or cycle consumer loads directly. Load curtailment programmes incentivize consumers to curtail load according to the utility’s requirements. Demand bidding programmes enable large-volume consumers, such as data centres to actively participate in the electricity market by submitting load reduction offers129. Emergency DR programmes are activated during critical situations, such as extreme weather or power shortages, requiring participants to reduce electricity usage quickly to stabilize the grid130.
Price-based DR motivates consumers to adjust or shift their electricity usage in response to price signals128,131. Examples of price-based DR programmes include time-of-use pricing, critical peak pricing and real-time pricing127. Time-of-use pricing is set in advance and generally reflects the average cost of supplying electricity during peak or off-peak hours. Critical peak pricing targets periods of extremely high demand, raising prices substantially during these critical peaks to discourage consumption. For example, when the reliability of the power system is jeopardized, the usual peak price may be replaced by a significantly higher price128. Real-time pricing is updated on short notice, typically hourly, to reflect actual market conditions and influence real-time consumer behaviour128,130,132 (Fig. 3h).
DR-based optimization methods can be viewed from the perspective of the consumer or the grid operators. For grid operators, the objective is to set economic incentives to guide consumer electricity usage, with the aim of minimizing generation costs, maximizing the use of RESs, alleviating transmission congestion and increasing network reliability133,134. Examples of grid operator DR methods that have been proposed include a distribution congestion price-based market mechanism used to direct the DR and alleviate potential congestion in distribution systems135. Additionally, a bottom-up approach was used to quantify consumer energy use behaviour, thus providing an accurate estimation of the actual amount of controllable resources136. Moreover, vehicle-to-grid DR, which supports bidirectional energy exchange between electric vehicles and service providers, has been used to maximize social welfare137.
By contrast, the consumers’ main objective is to minimize electricity bills by modifying their electricity usage, either through bidding or responding to electricity prices. Examples of consumer DR methods include using machine learning to predict future electricity prices and facilitate decision-making across household appliances in response to these predicted prices138. Additionally, a proposed dynamic DR controller adjusts the set-point temperature of heating, ventilation and air conditioning systems based on real-time electricity retail prices139. Furthermore, industrial load DR provided regulation or load following ancillary services with the support of an onsite ESS140.
Owing to the development of advanced metering infrastructure, there are no major technological impediments to the implementation of DR141. The primary challenge for DR is to develop comprehensive standards and market frameworks that ensure the harmonization of all system components for efficient communication, optimize the utilization of these diverse and geographically dispersed resources, and balance the needs of both the energy system and the individual consumer124.
Selection and implementation
GETs can effectively facilitate the large-scale integration and interconnection of RESs to the energy system in the near term. If RESs cannot be installed because there is insufficient line capacity, options include DLRs, ACTs and PFCs. For insufficient transformer capacity, DTRs can be used. When there is a spatial and temporal mismatch between generation and load — a common issue with RESs — ESSs and DR can be implemented. For looped networks, TO is suitable. In addition, the support of data measurement, communication, management, digitization and visualization technologies is necessary (Fig. 4).
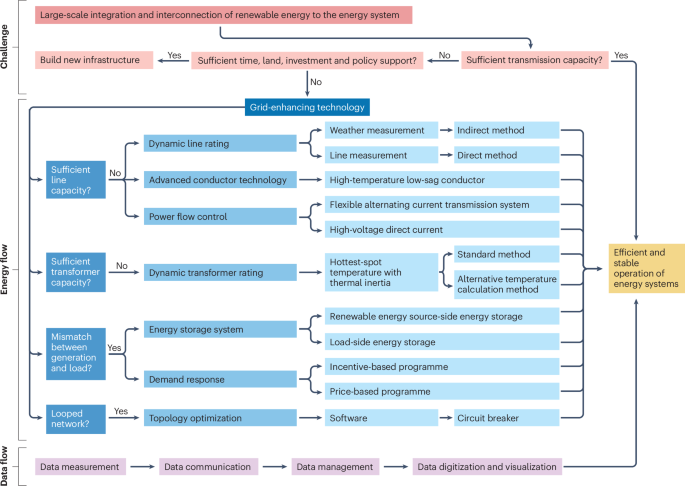
When existing transmission capacity is insufficient and there is adequate time, land, investment and policy support, new infrastructure ideally will be built. Otherwise, grid-enhancing technologies can be used to relieve congestion. Dynamic line rating, advanced conductor technology and power flow control can be used when line capacity is limited. Dynamic transformer ratings can alleviate some insufficient transformer capacity. Energy storage systems and demand response can be used when there is a spatial and temporal mismatch between generation and load. Topology optimization is suitable for looped networks. Data flows involving measurement, communication, management, digitization and visualization aid the use of grid-enhancing technologies.
The deployment of GETs is accelerating owing to the introduction of new legislation and regulations, such as the policies, laws and regulations enacted in the USA since 2021 (Box 1), which provide financial incentives, standardize implementation and reduce investment risks, enabling faster and broader adoption142,143,144,145. Although used globally, GETs have been primarily applied in the USA, Europe and Asia146,147 (Fig. 5 and Supplementary Table 1).

Global, US and Canadian, and European distribution based on reported projects. Grid-enhancing technologies have been widely applied globally, with the highest number of reported deployments in the USA and Europe, followed by Asia. Among the seven types of technologies here, dynamic transformer rating has received the least coverage, while other technologies have been widely applied to varying extents. Locations and references are listed in Supplementary Table 2.
DLR usage requires deploying sensors to monitor the environment or line conditions. DLRs have been implemented across North America, Europe and Asia-Pacific, demonstrating sizable advantages in alleviating congestion and saving costs8,146. DLRs are integrated into most of the German Transmission System Operators’ dispatching centres, where they exchange the ratings online. This integration is projected to save approximately €900 million in costs expected by 2030 (ref. 148). In North America, non-contact sensors installed on lines in Minnesota, Wisconsin and Colorado showed that average DLRs exceeded SLRs by 9–33% during winter months and 26–36% during summer months at the monitored sites, with availability on monitored lines exceeding 85% of the time146.
Many utilities adjust their transformer rating according to seasonal ratings, and some have implemented DTRs using various approaches2. For example, 50 power transformers ranging from 5 to 50 MVA were upgraded in the USA2. The benefits of this upgrade included extending the useful life of existing infrastructure, providing more flexibility during planned or unplanned outages and enhancing situational awareness through device health monitoring. Challenges included transformer retrofitting and hot spot identification2.
FACTS, owing to their strong ability to push or pull power, have seen widespread development and application, resulting in a range of effective solutions2. For example, in 2019, the UK deployed FACTS, which allowed for 95 MW of additional network capacity and saved customers £8 million in 1 year, while the initial programme reportedly cost only £2.4 million149. In 2021, an additional five devices were installed in the UK to reduce congestion for RESs, increasing transmission capability by 1.5 GW (ref. 149).
With the increasing need for long-distance power transmission over extensive distances, including across continents and undersea, as well as from offshore wind platforms to shorelines, HVDC technology has seen substantial development12. The global HVDC transmission system market is expected by Forbes business insights to grow from $10.93 billion in 2024 to $22.01 billion by 2032, at a compound annual growth rate of 9.14%. The NordLink between Germany and Norway, with a length of 623 km, is an example of the efficient use of RESs. It allows Germany to transfer surplus solar and wind energy to Norway during periods of high generation, while stabilizing the German grid by importing flexible, clean hydroelectric power from Norway during demand peaks or low renewable generation periods150. Multi-terminal HVDC is well suited for integrating multiple RES plants. For example, in the Zhangbei 500 kV DC grid project with a rated capacity of 4,500 MW, power will be transmitted between four interconnected regional stations to provide Beijing with clean power65.
TO is a software application that controls power flow in looped networks using existing hardware, such as circuit breakers and communication systems, which significantly reduces deployment costs2. A US utility used TO software and expertise to find regionally beneficial reconfiguration solutions for congestion events. Over the 2-year period since October 2021, this initiative achieved an 18% cost reduction ($14 million) for customers. It was estimated that an additional 36% cost reduction ($27 million) could have been achieved if all identified reconfigurations had been fully implemented, resulting in a potential total cost reduction of 54%. Additionally, the identified reconfigurations could reduce overload risks by 90%149.
ACTs have been widely adopted globally83. For example, American Electric Power replaced two 120-mile long 345 kV circuits of ACSR conductor with ACCC conductor, nearly doubling the line capacity without needing to rebuild or replace existing structures. This project was completed 8 months ahead of schedule, reducing line losses by 30%149. Additionally, in California, ACCC conductors are used on two 230 kV lines to increase line capacity from 936 A to 1,520 A, mitigate sag clearance issues, minimize structural modifications over the 137-circuit-mile span and eliminate load shedding during low-hydro conditions149.
ESSs have seen significant growth, reaching a cumulative global installed capacity of 237.2 GW by the end of 2022, with an annual growth rate of 15% compared with 2021 (ref. 107). In early 2021, a grid-scale 8 h energy storage solution was deployed in Virginia to help reduce electricity costs by releasing stored energy during peak demand and delaying the need for costly substation upgrades. This project also enhanced customer resiliency by providing a backup power source through stored energy in case of transmission system failures149.
DR regulation and implementation has grown over the past few years, including broader programmes and allowing smaller resources to participate151. For example, South Australia requires that certain newly installed air conditioners be DR ready151. France, Italy, the Netherlands and the USA are experimenting with vehicle-to-grid technology to enable vehicles to feed electricity back into the grid151. More than 500 virtual power plant projects are thought to operate in North America, according to an industry report, with estimated capacity in the USA ranging between 30 GW and 60 GW. Additionally, by the end of 2023, one of the largest virtual power plants in Europe reported a capacity of over 13,500 MW and controlled over 16,500 decentralized units.
The combined deployment of two or more GETs can create synergistic effects and handle more complex operational scenarios. For instance, transmission capacity might be simultaneously constrained by transmission lines and transformers, necessitating the combined use of DLRs and DTRs48. Additionally, potential combinations include DLRs, PFCs and TO to flexibly control power flow without exceeding line capacity, as well as the integration of ESSs and DR to smooth daily load curves. However, despite numerous theoretical studies on using multiple GETs48,72,116,152, practical implementation reports remain relatively scarce owing to limited experience with such combinations and technical challenges.
Summary and future perspectives
GETs are hardware and software solutions deployed within the existing energy systems to increase the capacity, flexibility and reliability of the existing grid. Increasing GET uptake — alone and in combination — could relieve grid congestion and assist with the integration of renewable energy generation to decarbonize energy systems. The technological challenges of GETs will require hardware, software and operational advances. Non-technical hurdles such as economic barriers and data sharing reluctance must also be overcome2.
GET deployment requires efficient data management, which in turn needs systems that are capable of aggregating data from diverse sources, handling large volumes of data in real-time and ensuring data integrity and accessibility in compliance with regulatory standards149. Data digitization achieves greater transparency over grid operations and enhances customer interactions with utilities through digital platforms. Additionally, digitization promotes the deployment of AI methods to predict future system states and generate control strategies149.
These data systems rely on advanced sensors that monitor environmental, equipment and electrical conditions149,153. Challenges in developing sensors include ensuring high data quality in various environments and establishing the secure and cost-effective communication of large amounts of data across grid components149,154. Communication technologies need to be low-latency, reliable, high-quality, cost-effective and capable of supporting current and future technology149. Furthermore, communication is susceptible to cyber-attacks, necessitating stringent security protocols to protect against potential vulnerabilities154.
Beyond data requirements, advancements in other technologies are also necessary. For example, multi-terminal HVDC requires the development of DC circuit breakers, which are one of the most promising solutions for isolating faulty parts of the DC network and improving the reliability of the grid155. Moreover, solid-state transformers based on power electronic devices can achieve more flexible control, reduce congestion and mitigate voltage violations156. Development of conductors with new materials and technologies that have improved heat resistance and lower sag is ongoing83.
Currently, the operation and control of energy systems largely rely on the experience of operators, and GET deployment increases the complexity of pre-existing systems. Some technologies have mostly pilot results but lack comprehensive operational experience and operators unfamiliar with these new GETs might not be able to fully leverage their potential. Therefore, it is essential to develop new standardized processes to guide operators in effectively using GETs2. Data visualization should be implemented alongside GETs to translate complex data into intuitive formats like dashboards, improving operators’ capacity for situational awareness and decision-making149. Moreover, it is important to engage in educational programmes and practical trials of these new technologies, enabling operators to gain hands-on experience and insights.
Existing electricity market operational mechanisms may not fully incorporate the flexibility enabled by new GET developments. For example, some emerging GETs may lack corresponding mechanisms within the electricity market12. Integrating numerous new GETs may require large system modifications and complicate market settlements. Additionally, the impact of incorporating these technologies into pricing models is still unexplored. Therefore, it is crucial to develop new market mechanisms to manage this added flexibility and to conduct further research to evaluate different technologies thoroughly157,158. Affected parties should engage with each other in these developments through transparent processes12.

Responses