Gut microbiota modulation in cardiac cell therapy with immunosuppression in a nonhuman primate ischemia/reperfusion model

Introduction
Ischemic heart disease and heart failure are leading causes of morbidity and mortality globally, and heart transplantation remains the only option for end-stage disease1,2,3. Emerging cell-based cardiac therapies transcends the limitations of traditional organ transplantation, circumventing the scarcity of donor organs and the inadequacies of artificial prosthetics or implants. However, this therapeutic modality may provoke immune rejection of transplanted allogeneic cells4. To bolster the success of transplantation and ensure long-term graft survival, immunosuppressive treatment is commonly administered before or after transplantation5. Consequently, the immunosuppressive drugs create an environment conducive to the seamless integration and in some cases differentiation as well as functional maturation of transplanted cells within the recipient’s tissues6.
The interplay between transplantation, immunosuppression, and the metabolic processes of the human body has recently garnered considerable attention, with a specific focus on the gut microbiome7,8. However, the impact and underlying mechanisms of the gut microbiota on clinical outcomes following hematopoietic stem cell transplantation and solid organ transplantation remain unclear. In particular, the influence of cell therapy on host’s gut microbiota in the context of cardiovascular disease remains predominantly unexplored. Following allogeneic hematopoietic stem cell transplantation (allo-HSCT), significant alterations occur in the composition, diversity, and density of the intestinal microbial population9,10. Furthermore, the microbiota has emerged as a prognostic factor for mortality in allo-HSCT11,12, with perturbations characterized by reduced diversity and the domination of specific taxa associated with elevated mortality hazards12. Similarly, in solid organ transplantation such as liver and kidney transplantation, the transplant recipients also displayed manifestations of gut dysbiosis, including reduced gut microbial diversity, heightened levels of detrimental microbial species, diminished presence of essential metabolic pathways, and the emergence of antibiotic resistance genes and virulence factors, persisting for extended periods of up to two decades post-transplantation13. On the other hand, disparities in the resident microbiome among genetically analogous individuals contribute to distinct patterns of skin graft rejection and variations in graft outcomes7.
In this study, we investigated the dynamics of gut microbiota in a Macaca mulatta (rhesus macaque) cardiac ischemia/reperfusion (I/R) model during cell therapy and the accompanying immunosuppressive treatment. Employing 16S rRNA next generation sequencing (NGS) and liquid chromatography-mass spectrometry (LC-MS), we identified the oscillations of gut microbiota and plasma metabolites before and after immunosuppression therapy, as well as pre- and post-transplantation. The physiological and genetic similarities to humans and feasibility to control inhabited environment, diet and cardiac injury size make rhesus macaques an invaluable translational model to explore the intricacies of the interplay between cell therapies, immunosuppression, and gut microbiota.
Results
Gut microbiota dynamics after cardiac ischemia and immunosuppression
Documented influence of gut microbiota on the clinical outcome following allogeneic hematopoietic stem cell transplantation (allo-HSCT) and solid organ transplantation contrasts with a limited understanding of the impact of stem cell-derived cell therapy on host gut microbiota11,13. To address this gap, we comprehensively examined gut microbiota dynamics at various time points in a nonhuman primate myocardial ischemic/reperfusion (I/R) model receiving cell therapy of human iPSC-derived cardiomyocytes (CM) and endothelial cells (EC)(Fig. 1a; Supplementary Table 1)14. Prior to cell therapy on I/R day 28 (IRD28), nonhuman primates received immunosuppressive tacrolimus conditioning from IRD21 onward (Fig. 1a). The gut microbiota exhibited distinct clusters as revealed by weighted UniFrac distance analysis comparing IRD7 to IRD28 (Fig. 1b). Measures of the richness and evenness of the gut microbiota notably increased on IRD28 compared to IRD7 as determined by observed ASVs, Shannon’s index and Pielou’s evenness (Fig. 1c-e). Linear discriminant analysis effect size (LEfSe) revealed several anaerobic bacterial genera enriched in the gut microbiota at IRD28, including Faecalibacterium, Streptococcus, Anaerovibrio, and Dialister (Fig. 2a). The abundance of Faecalibacterium, Streptococcus, Anaerovibrio, and Dialister at IRD28 was further validated with qPCR (Fig. 2b; Supplementary Table 4). Moreover, sparse estimation of correlations among microbiomes (SECOM) analysis highlighted robust correlations among the occurrence of these bacterial taxa (Fig. 2c), suggesting potential functional or ecological relationships tied to their roles within the gut milieu or response to specific conditions, such as cardiac ischemia and immunosuppressive treatment. Collectively, these findings indicate that cardiac ischemia and subsequent immunosuppression induce significant alterations in the gut microbial community, cumulating in increased diversity.

a Schematic illustration of cell transplantation therapeutic procedure in nonhuman primate (NHP) rhesus macaque. b The weighted UniFrac distance of gut microbiota in NHP under immunosuppressive treatment. IRD7, pre-immunosuppressive treatment; IRD28, day 7 post-tacrolimus immunosuppressive treatment. The gut microbial α-diversity determined by (c) observed ASV, (d) Shannon’s index and (e) Pielou’s evenness. Pairwise permutational multivariate analysis of variance (PERMANOVA) was used to analyzed data in (b) and Wilcoxon signed-rank test with p values adjusted was used to analyze data in (c–e). IM intramuscular, IV intravenous, SQ subcutaneous.
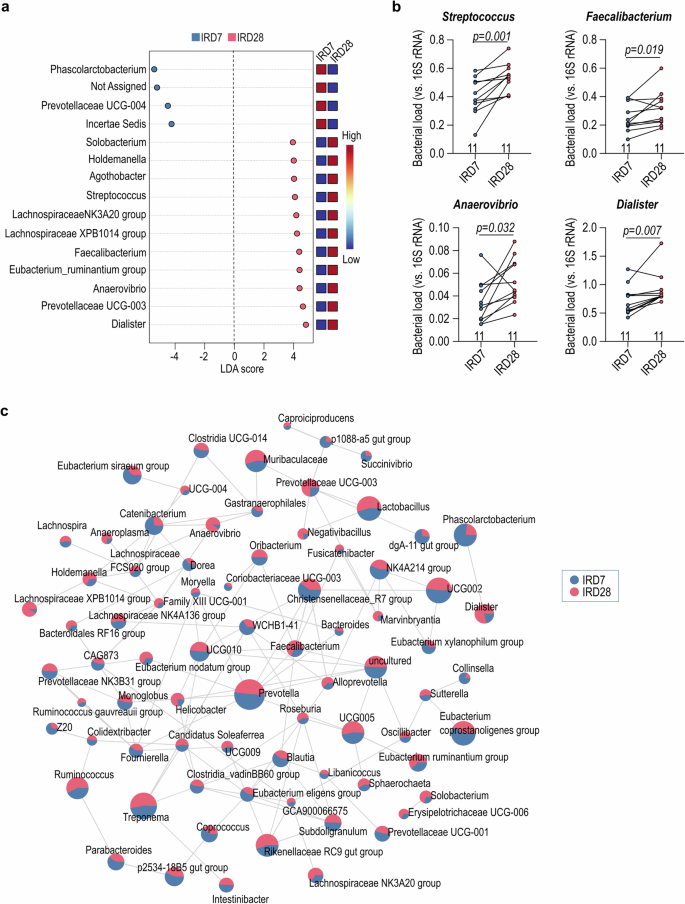
a LEfSe (Linear discriminant analysis (LDA) Effect Size) analysis for the gut bacterial genus predominant after immunosuppressive treatment. (b) The abundance of Dialister, Anaerovibrio, Faecalibacterium, and Streptococcus under immunosuppression by qPCR. (c) Correlation network of the gut microbiota in the genus level. The correlation was determined with Sparse Estimation of Correlations among Microbiomes (SECOM) (Pearson 2) filter with correlation more than 0.9 and p-value less than 0.01. The Wilcoxon signed-rank test was used to analyze data in (b).
Cardiac ischemia and tacrolimus conditioning impacted gut microbiota functionality and host Metabolism
To address the impacts of cardiac ischemia and tacrolimus conditioning on gut microbial community functions, we employed PICRUSt (phylogenetic investigation of communities by reconstruction of unobserved states) analysis to predict the metabolic perturbation15. On IRD7, the gut microbiota showed increased abundance in pathways involving amino acid metabolism, sugar derivatives degradation, and biosynthesis of cofactors, prosthetic groups and electron carriers (Fig. 3), suggesting the concerted support for host energy and nutrient requirements. Conversely, on IRD28, the gut microbiota revealed pathways enriched in acetyl-CoA fermentation, vitamin biosynthesis and nucleoside/nucleotide biosynthesis (Fig. 3), indicating microbial metabolic adaptation to the modified host environment. To further investigate the correlation between alterations in gut microbiota and plasma metabolites after cardiac ischemia and tacrolimus conditioning, we conducted nonhuman primate plasma metabolite profiling using LC-MS. The plasma metabolic profiling on IRD7 was distinct from that on IRD28, with significant enrichment of L-homoserine and uridine (Fig. 4a, b; Supplementary Data 1, 2). Strikingly, co-analysis of the plasma LC-MS metabolomics and microbiome abundance identified by LEfSe showed that Faecalibacterium, Holdemanella, Anaerovibrio and Dialister enriched on IRD28 strongly correlated with shifts in amino acid metabolism and nucleosides/nucleotides biosynthesis in host (Fig. 4c), revealing intricate microbial-host metabolic connections. Overall, our data revealed the pivotal role of gut microbial metabolism in modulating host metabolic reactions to cardiac ischemia and tacrolimus conditioning, with microbial adjustments likely aiding host homeostasis during treatment.
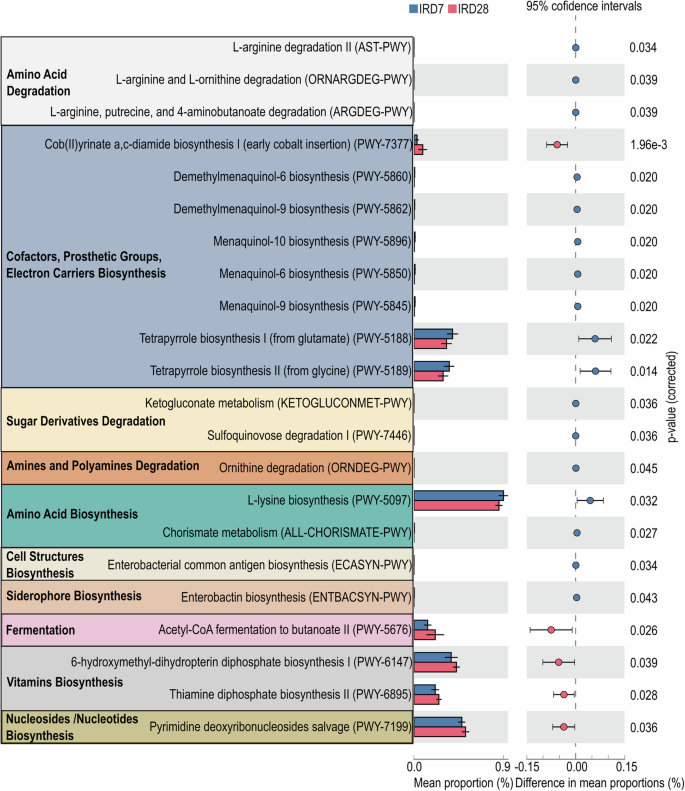
PICRUSt (Phylogenetic Investigation of Communities by Reconstruction of Unobserved States) analysis of the changes in metabolic pathways influenced by immunosuppressive treatment. Data are presented as mean ± SEM. The error bars refer to the standard error of the mean. The data were analyzed with Welch’s two-sided t-test.
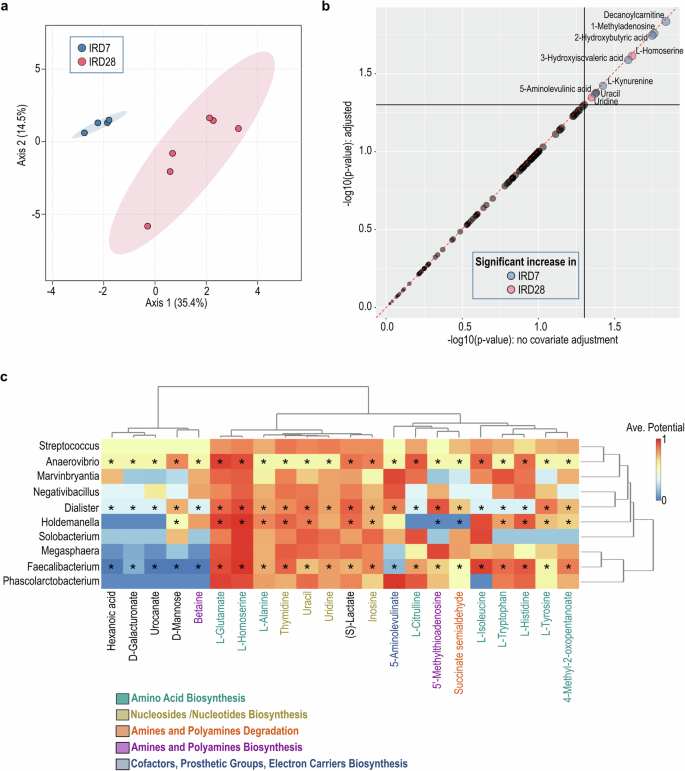
a Sparse Partial Least Squares (sPLS) of the metabolite profiling under immunosuppression using LC-MS. b The significant increase of metabolites under immunosuppressive treatment using the linear models with covariate adjustment. c The immunosuppressive-predominant gut bacterial genus and the plasma LC-MS metabolomic profiling were used to calculate the correlation between gut microbiota and metabolites. The prediction was based on the EMBL database. The paired microbiome and metabolomics features that identified as significant by both statistical correlation and GEM-based prediction are marked with a *.
Cell transplantation remodeled the gut microbiota
To address the impact of cell transplantation on gut microbial communities, we investigated the gut microbiota alterations in the nonhuman primate I/R model intra-myocardially transplanted with the human iPSC-derived cardiomyocytes (CMs), either alone or in combination with human iPSC-derived endothelial cells (ECs) (Fig. 5a; Supplementary Table 1)14. The NHP receiving the EC + CM combined therapy demonstrated improved cardiac function, including enhanced ejection fraction (EF%) and reduced infarct size (Supplementary Tables 2 and 3)14. The engraftment size was larger in the EC + CM group than the CM-only group (Supplementary Tables 2 and 3)14. The gut microbial communities were classified into three clusters according to the treatment (Ctrl, CM and EM + CM) by weighted Unifrac distance analysis (Fig. 5b). Although the small sample size limited the statistical difference in the alpha-diversities (observed ASV, Shannon’s index and Pielou’s evenness) among three groups, a trend of higher alpha-diversities in the EC + CM group compared with the CM group was observed (Fig. 5c). Notably, alpha diversity of the gut microbiota showed a positive correlation with EF% (Supplementary Fig. 1). CM transplantation led to higher abundance of anaerobic genus like Muribaculaceae, Christensenellaceae R7 group, Cerasicoccus, Senegalimassilia, Libanicoccus, and Olsenella, as determined with LEfSe analysis and qPCR (Fig. 5d, e; Supplementary Table 4). Conversely, EC + CM combinatorial transplantation increased the abundance in genera like Phascolarctobacterium, Fusicatenibacter, Erysipelotrichaceae UCG-006, Veillonella, and Mailhella (Fig. 5d, e). We observed a positive correlation between Phascolarctobacterium and EF%, as well as a negative correlation between Phascolarctobacterium and infarct size (Supplementary Fig. 2). In contrast, Streptococcus showed a negative correlation with EF% and a positive correlation with infarct size (Supplementary Fig. 2). However, we did not observe a significant correlation between gut microbial alterations and engraftment size (Supplementary Figs. 1 and 2). Furthermore, we assessed the microbial dysbiosis (MD) index in each transplantation group to track the dynamics of gut microbiota over time. In the CM group, the MD index was higher at the endpoint (IRD56) than at baseline (Pre-IR) and pre-immunosuppression (IRD7) but lower than at post-immunosuppression (IRD28) (Fig. 5f), suggesting similarities with the gut microbial community at IRD28. On the contrary, the MD index of the EC + CM group at the endpoint was lower than at the baseline and pre-immunosuppression, but higher than at post-immunosuppression (Fig. 5f), indicating resemblance to earlier time points. Together, this data highlight the impact of cell-based interventions on the gut microbiota composition over time.
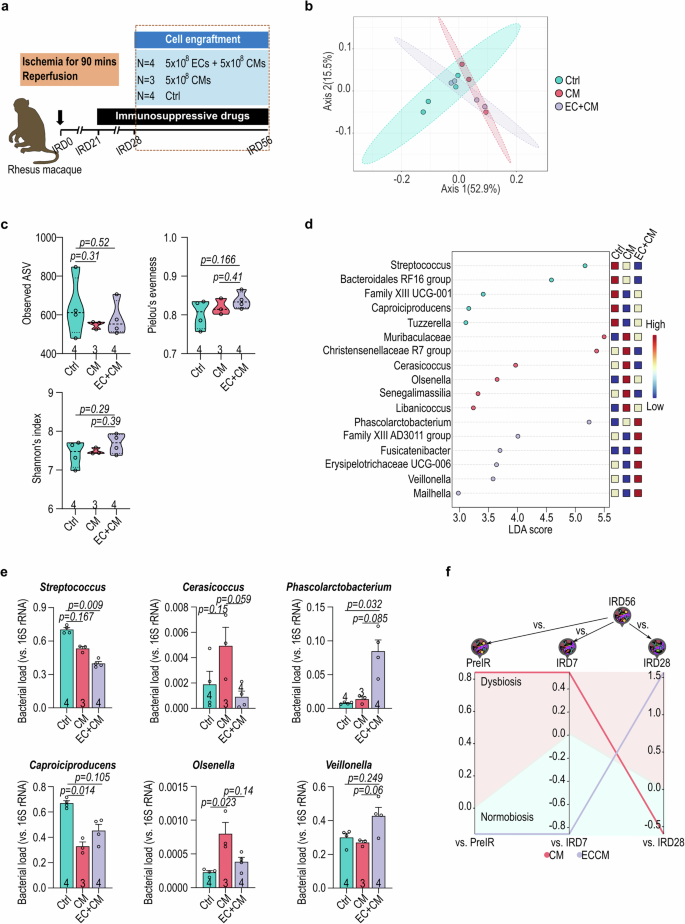
a The schematic illustration of experimental design for cell transplantation. b The weighted UniFrac distance of gut microbiota in NHP after cell transplantation. c The α-diversity of recipient gut microbiota after cell transplantation determined by observed ASV, Shannon’s index and Pielou’s evenness. d LEfSe analysis of the treatment predominant genus of gut microbiota. e Genus-specific qPCR confirmation of Streptococcus, Caproiciproducens, Cerasicoccus, Olsenella, Phascolarctobacterium, and Veillonella. f The microbial dysbiosis (MD) index of end-point (IRD56) gut microbiota in recipients compared with pivotal time points of treatments (pre-IR, IRD7 and IRD28). Data in (c, e) were analyzed with Kruskal-Wallis test followed by Dunn test for multiple comparisons. Data in (e) presented as mean ± SEM. The error bars refer to the standard error of the mean. Ctrl, vehicle; CM, human iPSC-derived cardiomyocytes; EC, human iPSC-derived endothelial cells.
Metabolic Profiling Revealed Pathway Enrichment upon Cell Transplantation
In accordance with PICRUSt prediction for microbial metabolomics, the groups with cell transplantation showed notable enrichment in pathways involving fatty acid biosynthesis, acetyl-CoA fermentation, amino acid biosynthesis, TCA cycle, and cofactor and electron carrier biosynthesis (Fig. 6a). Upon comparing the CM and EC/CM groups, discernible variations in microbial metabolomic enrichments emerged (Fig. 6b). Specifically, the CM group exhibited enrichment in pathways associated with lysine biosynthesis, pyruvate fermentation and acetylene degradation (Fig. 6b). In contrast, pathways related to polyisoprenoid biosynthesis, acetyl-CoA fermentation as well as allantoin degradation were enriched in the EC/CM group (Fig. 6b). The plasma metabolites from NHPs receiving control vehicle, CM or EC/CM transplantation revealed recognizable metabolic profiles based on the LC-MS analysis (Fig. 7a; Supplementary Data 1 and 3). In addition, glycerophosphocholine and D-lysine were enriched in both CM and EC/CM transplantation groups (Fig. 7b). Remarkably, gut bacterial genera vadinBE97, and Butyricimonas in NHPs receiving cell therapy strongly associated with the shift in amino acid biosynthesis and fatty acid/lipid biosynthesis in host plasma (Fig. 7c), suggesting the influence of cell therapy on gut microbiota-host metabolic shift. Overall, this comprehensive analysis underscores the nuanced shifts in metabolic pathways brought about by different transplantation conditions.
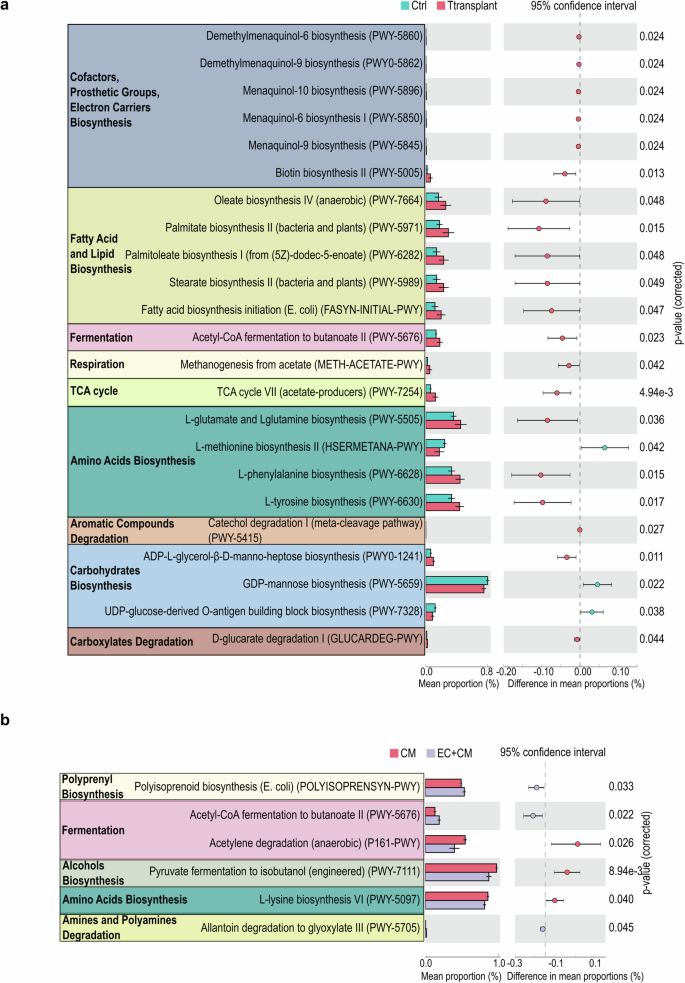
a PICRUSt predicted metabolic pathway alteration between control and cell transplantion groups. b PICRUst prediction of metabolic pathway alteration between human iPSC-derived cardiomyocyte (CM) and endothelial cell (EC) transplantation. Data are presented as mean ± SEM. The error bars refer to the standard error of the mean. Data were analyzed with Welch’s two-sided t-test.
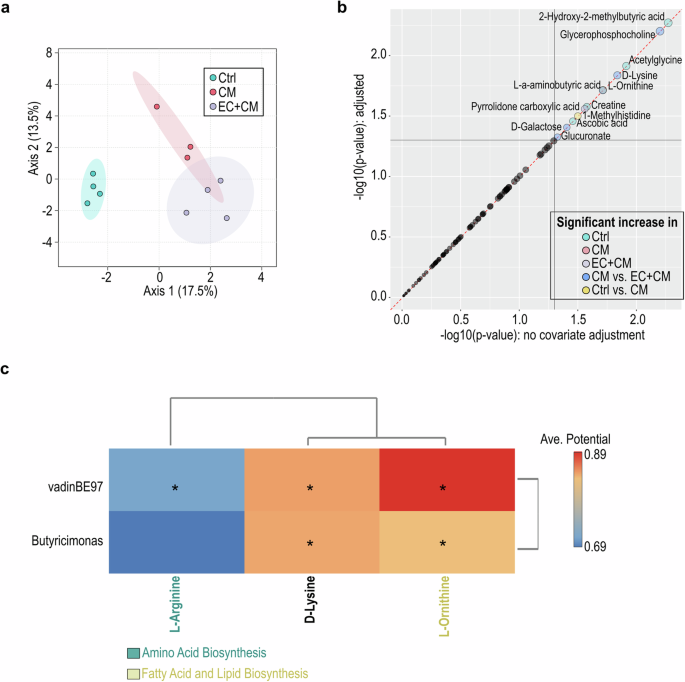
a Sparse Partial Least Squares (sPLS) of the plasma metabolite profiling after cell transplantation using LC-MS. b The significant increase of metabolites under cell therapy using the linear models with covariate adjustment. c The cell therapy-predominant gut bacterial genus and the plasma LC-MS metabolomic profiling were used to calculate the correlation between gut microbiota and metabolites. The prediction was based on the EMBL database. The paired microbiome and metabolomics features that identified as significant by both statistical correlation and GEM-based prediction are marked with a *.
Discussion
Immunosuppressive treatment is essential for cell therapy to prevent immune rejection of grafts and improve the therapeutic efficacy14,16. Administrating low-dose tacrolimus (15 ng/kg/day) for 7 days resulted in gut dysbiosis characterized by an increase in alpha diversity and bacterial genera such as Faecalibacterium, Streptococcus, Anaerovibrio, and Dialister (Figs. 1 and 2a). This observation aligns with previous reports showing a dose-dependent association between tacrolimus and gut microbiota richness and diversity17,18. Notably, gut microbiota reduce expression of the efflux transporter ABCB1 in the small intestine and regulate the pharmacokinetics of tacrolimus19. These observations shed light on the bidirectional relationship between Faecalibacterium and immunosuppression, carrying potential therapeutic significance. Furthermore, different experimental models may account for the variations in specific bacterial genera observed between this study and previous studies, which reported enrichment of Lactobacillus and Subdoligranulum after tacrolimus treatment17,18. This study investigated an NHP cardiac I/R model whereas previous studies predominantly focused on murine models and human clinical samples17,18.
Contrary to a prior rat study showing catabolic pathway enrichment after tacrolimus treatment20, our NHP I/R model exhibited an anabolic shift (Fig. 3). In particular, we observed an enrichment of biosynthesis of cofactors, prosthetic groups and electron carriers after tacrolimus conditioning (Fig. 3). Additionally, tacrolimus treatment in kidney transplant recipients has been linked to a much higher risk of diabetes and shares similarities with type 2 diabetes gut dysbiosis, which is characterized with an enrichment in A. muciniphila and depletion in Roseburia21,22. Nevertheless, our current study did not reveal significant alterations in A. muciniphila or Roseburia within the NHP gut microbiota. Most significantly, we unveiled a strong correlation between enrichment of Faecalibacterium, Holdemanella, Anaerovibrio, and Dialister and the enhancement of amino acid metabolism and nucleosides/nucleotides biosynthesis in the host (Fig. 4c), signifying a potential mechanism through which immunosuppression can orchestrate profound changes in host metabolic landscape.
We also compared the influence of CM and EC/CM transplantation on host gut microbiota. The EC/CM cotreatment group exhibited the most prominent changes, including an increase in bacterial genera like Phascolarctobacterium, and Veillonella as well as a decrease in Streptococcus, leading to an increase in alpha diversity (Fig. 5c, e). Remarkably, the gut microbial composition in the EC/CM group at end-point (IRD56) closely resembled that at baseline (pre-IR), indicating a more robust return to homeostasis following transplantation compared with the CM group (Fig. 5f). These findings dovetail our recent study that demonstrated a more favorable therapeutic outcome after EC/CM co-transplantation in a NHP I/R model14. Additionally, high gut microbial diversity has also been linked to reduced mortality following allo-HSCT and solid organ transplantation11,13. These data underscore the significance of the heart-gut axis in cell therapy-mediated cardiac repair and suggest the potential for enhancing the therapeutic outcome through gut microbiome modulation.
The finding that NHPs showed a decrease in amino acid biosynthesis and TCA cycle post cardiac injury (Fig. 6a) is consistent with the feature that failing hearts consumed more ketones and lactate and had higher rates of proteolysis23. Moreover, enrichment of fatty acid biosynthesis, acetyl-CoA fermentation, amino acid biosynthesis, TCA cycle, and cofactor and electron carrier biosynthesis in NHPs receiving cell transplantation (Fig. 6a) indicates the restoration of metabolism shift post-cardiac injury as well as better cardiac function after cell therapy14. This also well reflects the nature that hearts have high demand for resting energy expenditure24. Gut bacteria-associated fatty acid biosynthesis may provide fatty acids that promote the survival and maturation of human iPSC-derived cardiomyocytes transplanted in the injured hearts, leading to improved cardiac function (Fig. 7; Supplementary Tables 2 and 3)25,26,27. Additionally, we also observed a strong correlation between gut bacteria and pathways involving L-Arginine and L-Ornithine metabolism (Fig. 7c). L-Arginine can be used to generate L-Ornithine and skew T cell metabolism to enhance the survival capacity and anti-tumor activity of memory T cells28. Further investigation is required to elucidate whether gut microbiota can modify the immune cell activity through L-Arginine metabolism to modulate the outcome of cell therapy under post-cardiac injury conditions.
Despite these insights, our study faces limitations. The relatively small size of this NHP study (n = 4 for control group, n = 3 for CM group, and n = 4 for EC + CM group) limits generalizability to broader and more heterogeneous populations, including humans. Furthermore, our study design highlighted only the impact of tacrolimus on the gut microbiota, without delving into the gut microbiota-mediated tacrolimus pharmacokinetics. Moreover, due to the limited availability of NHP, we were unable to include an I/R control group of NHP not subjected to immunosuppressive regimens or one without I/R injury, complicating the interpretation of the influence of immunosuppression on gut microbiota. Additionally, this study is predicting metabolites with PICRUSt, which, like all 16S studies, is making assumptions about the gene content of ASVs and should only be regarded as a prediction to be confirmed with metagenomics or transcriptomics in future studies. Lastly, the relatively short follow-up period, extending only up to IRD56, may limit our potential to capture long-term alterations in gut microbiota and metabolic profiling. Future research involving larger and more diverse populations with extended follow-up would enhance clinical relevance.
Our results unveil a novel host-gut microbiota relationship in response to immunosuppression and cell therapy, highlighting gut microbial signatures and metabolic alterations as potential targets for monitoring and optimizing the transplantation outcomes. However, further studies are needed to clarify the causal relationship between cell therapy outcomes and gut microbial modulation. While the NHP model provides valuable insights into the specific biological process, it is important to note that the NHP diets differ significantly from those of human patients. Therefore, further studies in human subjects are necessary to fully understand these dynamics in the context of human diets and health. This study not only advances our understanding of the intricate interplay between immunosuppression, cell therapy, and gut microbiota, but also holds promise for optimizing therapeutic strategies in cardiovascular medicine.
Methods
Nonhuman primate surgery
Male rhesus macaques (Macaca mulatta), with 5–18 months of age, were obtained from the Wisconsin National Primate Research Center (WNPRC) and the California National Primate Research Center (CaNPRC) (Supplementary Table 1). The nonhuman primate (NHP) surgery was performed in the WNPRC (ICUAC number G006084-A07) and the procedure has been detailed in a prior report14. NHPs were anesthetized through intramuscular injection of ketamine and midazolam, then intubated and placed on ventilation with isoflurane to maintain anesthesia. 28 days before cell transplantation, percutaneous coronary intervention or thoracotomy was performed, mid-left anterior descending (LAD) coronary artery was occluded for 90 minutes followed by reperfusion, and ischemia was confirmed by ST-segment elevation on ECG. NHPs were administered immunosuppressive agents Tacrolimus, Methylprednisolone and Abatacept. Tacrolimus was administered intramuscularly on a daily basis to maintain serum trough levels of 15 ng/kg from IRD21 until euthanized. Methylprednisolone was given intravenously at 30 mg/kg the day before cell transplantation (IRD28), followed by a 6 mg/kg intramuscular (IM) injection for 2 days, and then 3 mg/kg IM thereafter until euthanized. Abatacept was administered at a dose of 12.5 mg/kg subcutaneously on the day before cell transplantation and fortnightly thereafter. Human iPSC-derived endothelial cells (ECs) and cardiomyocytes (CMs) were delivered intra-myocardially near LAD coronary artery on IRD28 and the NHPs were euthanized on IRD56. The cells were kind gifts from the Human Disease iPS Cells Service Consortium (http://ipsc.ibms.sinica.edu.tw) under the approval of the Institutional Review Board of Biomedical Science Research at Academia Sinica (AS-IRB-BM-170120 v.3). For the CM only treatment, 5×10⁸ of CMs were injected. In the combined cell therapy, 5×10⁸ of ECs and 5×10⁸ of CMs were injected. All NHPs were fed with 2050 Teklad Global 20% Protein Primate Diet (Teklad Diets, Madison, WI) and supplemented with a variety of fruits, vegetables, and nuts. All NHPs were euthanatized by intravenous injection of pentobarbital following sedation with ketamine or under anesthesia with ketamine, isoflurane, and a constant-rate infusion of fentanyl.
Stool DNA extraction
Rhesus macaque stool DNA was extracted utilizing the bead-beating method with innuPREP Stool DNA Kit (Analytik Jena GmbH, Germany) following the manufacturers’ instructions. The DNA samples were stored in TE buffer at -80°C for subsequent analysis.
16S rRNA next generation sequencing (NGS)
The stool genomic DNA extracted underwent the 16S Sequencing Library Preparation procedure (Illumina, UAS). The processed genomic DNA (12.5 ng) was employed to amplify the V3-V4 region of the 16S rRNA gene using a specific primer set (319 F: 5’-CCTACGGGNGGCWGCAG-3’, 806 R: 5’- GACTACHVGGGTATCTAATCC -3’) and KAPA HiFi HotStart ReadyMix (Roche, Switzerland). The PCR condition included an initial denaturation at 95°C for 3 minutes, followed by 25 cycles of 95°C for 30 seconds, 55°C for 30 seconds, 72°C for 30 seconds, with a final extension at 72°C for 5 minutes and a hold at 4°C. PCR products displaying a prominent 500-base pair band on a 1.5% agarose gel were purified using AMPure XP beads (Beckman Coulter, USA). Subsequently, dual indices and Illumina sequencing adapters were added to the 16S rRNA V3-V4 PCR amplicons using the Nextera XT Index Kit (Illumina, USA) to prepare the sequencing library. The quality of indexed PCR products was evaluated using the Qubit 4.0 Fluorometer (ThermoFisher Scientific, USA) and Qsep100TM system. Equal amount of indexed PCR products was pooled and subjected to sequencing on an Illumina MiSeq platform (Illumina, UAS) to generate paired 300-base pair reads. The sequence data underwent processing using QIIME 2 (version 2020.11) using the q2-dada2 plugin to remove primer sequences, and filter sequences with anonymous bases and chimera, ultimately generating amplicon sequence variants (ASVs)29. Each representative sequence was taxonomically classified with a pre-trained Naive Bayes classifier (Silva database v.138) using the qiime-feature-classifier function to obtain the phylogenetic information. Statistical analysis, including co-analysis of microbiome and metabolomics, was performed using MicrobiomeAnalyst30.
Microbial dysbiosis (MD) index
The MD index was computed following the formulation introduced by Gevers et al., which is expressed as the logarithm of the ratio [total abundance in organisms increased in group X] to [total abundance of organisms decreased in group X]31. Changes in bacterial abundance were evaluated by comparing the endpoint gut microbiota with those observed at earlier time points in each animal.
liquid chromatography-mass spectrometry (LC-MS) untargeted metabolic profiling
Ten microliters of the nonhuman primate plasma samples were mixing with 90 μl of methanol and centrifuged at 15000×g for 15 minutes to remove proteins. The resulting supernatant was filtered through a 0.22 μm polypropylene (PP) membrane (RC-4, Sartorius, Göttingen, Germany). Samples were subjected to the Agilent 1290 UHPLC system coupled with 6540-QTOF (UHPLC-QTOF) (Agilent Technologies, Santa Clara, CA), with each sample run in triplicate. Background subtraction and peak picking of the acquired total ion chromatogram were processed using True Ion Pick (TIPick) algorithm. Peaks were identified by matching m/z values to the National Taiwan University MetaCore Metabolomics Chemical Standard Library established in-house. Co-analysis of microbiome and metabolomics data was performed using MicrobiomeAnalyst30.
Statistical analysis
GraphPad Prism 8 (GraphPad Software, Inc., La Jolla, CA, USA) was employed for statistical analysis and graph generation. The data are presented as mean ± SEM. Detailed information on sample size and the statistical tests employed are provided in the figures and corresponding legends. Group-wise data were analyzed using the Kruskal-Wallis test followed by Dunn’s multiple comparison test, while comparisons between dependent groups were assessed by Wilcoxon signed-rank test with p-values adjusted using Benjamini-Hochberg method if necessary.
")
Responses