Human infant EEG recordings for 200 object images presented in rapid visual streams

Background & Summary
Our daily lives involve rapid and accurate visual recognition of a vast array of different objects, such as faces, cars, trees, structures, animals, and many more. We are adept at recognising individual objects even in cluttered visual environments (e.g., a messy kitchen), and in the face of dramatic differences in an object’s retinal projection caused by lighting conditions or viewing angle. Understanding the neural basis of this impressive capacity has been a core theme in cognitive neuroscience research1,2,3,4, with an increasing number of papers aimed at understanding how these capabilities develop during the earliest stages of life – human infancy5,6,7,8,9. While early findings in these neuroimaging infant studies have been promising, stimulus set sizes and sample sizes have been relatively modest, and infant neural data is often not publicly available. This is a barrier to progress in the field, particularly since the often noisy quality of infant neuroimaging data necessitates a higher degree of preprocessing than corresponding adult data would5,10,11, and developing optimised preprocessing pipelines relies on open data availability. Therefore, there is a pressing need for high-quality open-access neuroimaging data associated with infant object recognition.
Collecting neurophysiological datasets on infants presents several challenges: Typically, classic object vision experiments present around one image per second12,13,14. Thus, obtaining multiple trials for many images can thus take many hours, which is infeasible to achieve with infants who cannot tolerate long experiments. However, we have recently shown in adult participants that it is possible to uncover overlapping information about visual stimuli presented in rapid serial visual presentation (RSVP) streams using electroencephalography (EEG)15,16,17,18. In these studies, 5 minutes of EEG recording can comprise more than 1000 visual object presentations appearing at a rate of 5 images per second. Multivariate pattern classification analysis of this data revealed detailed temporal dynamics of object processing that are similar to those documented by studies using slower presentation speeds. Therefore, fast presentation paradigms may be highly suitable for collecting neural responses to large numbers of visual object stimuli in infant populations. Indeed, steady state visual evoked potential studies with fast presentation designs and have shown promising results in infants19,20,21, but they differ from the RSVP approach in both the type of analysis and the randomised stimulus presentation.
Here, we present a dataset of human infant (n = 45) EEG responses to 200 object images spanning 50 individual categories (e.g., dog, hammer, chair etc.). Each image was repeated at least 3 times for each participant, with the experiment lasting as long as the infant participant could comfortably comply. We used the same rapid serial visual presentation paradigm as a previous adult study15. Participants’ age range covered the major developmental changes in the visual system in the first year of life8,22,23,24,25, providing an unprecedented opportunity to investigate the development of vision in humans. Technical validation was carried out to probe general age-related effects and infant-adult comparison in object recognition in infancy. Results indicate distinguishable neural responses to object categories in infants over 6 months old and less matured responses in infants up to 6 months old, demonstrating that the dataset can serve as a high-quality resource for future investigations into the neural development of visual object recognition.
Methods
A total of 42 infants took part in the experiment, recruited via the MARCS Institute BabyLab database at Western Sydney University. Each caregiver was briefed on experimental procedures and provided their informed consent prior to the start of the experiment, including written consent for publishing the anonymised data. Participants were 16 female and 26 male human infants, mean age 6.57 months (sd 3.02 months), age range 1.8–11.5 months (Fig. 1). We recorded demographic information about each participant’s language and education background. All participants had been screened for normal hearing and vision and had no known medical issues. There are 8 participants marked for potential exclusion due to notably poor signal quality or equipment failure (marked in the participants.tsv file). These participants are included in the release for completeness, and in the technical validation reported here. All aspects of the study were approved by the Western Sydney University ethics committee (H14498).

Stimuli, design, and demographics. Top: Stimulus set used in the experiment, adapted from15. Middle: Rapid serial visual presentation design, showing part of a rapid sequence of stimuli. Bottom: Key demographic information including age in months, number of blocks completed (200 image presentations in each block), and a scatter plot of age by blocks completed.
Stimuli were taken from a previous object recognition study15 (Fig. 1), and consisted of 200 images spanning 50 object concepts. Each stimulus was associated with three levels of labels. The first level corresponded to the individual object (e.g., dog, apple, hammer, etc.), the second level corresponded to the category (e.g., mammal, fruit, tool, etc.) and the third level corresponded to the superordinate category (e.g., animate or inanimate). The experiment was programmed in Python (v3.7), using the Psychopy26 library (version 3.0.5). Images appeared in randomised order in sequences at a rate of exactly 5 Hz with a 50% duty cycle (Fig. 1), that is, each image appeared for 100 ms followed by a 100 ms blank screen. Each 40 second sequence contained one presentation of each unique stimulus. Participants sat on their caregiver’s lap in a dimly lit experiment booth approximately 57 cm from the screen, so that each stimulus subtended approximately 6 degrees visual angle. A fixation bullseye (0.5 degrees visual angle) was overlaid at the centre of each image. To promote the infant’s attention and engagement to the screen, before each sequence, the bullseye alternately increased and decreased in size until the experimenter manually started the sequence after verifying that the infant was looking at the screen. The experiment was paused when the infant was looking away and resumed when the infant’s attention was directed back to the screen. The experiment lasted between approximately 5 minutes to 20 minutes, depending on the infant’s compliance. On average, infants completed 4.58 full sequences (sd 1.48).
We used a BrainVision Liveamp EEG amplifier and Psychopy26 stimulus presentation with Labstreaminglayer connector protocol27 (https://labstreaminglayer.org/) for wireless EEG recording (Fig. 1B). Specifically, a Brain Products Liveamp server software (https://github.com/brain-products/LSL-LiveAmp) was used on the EEG recording computer to wirelessly connect to the Liveamp amplifier. An event trigger coding for the stimulus number was sent for each image presentation using Psychopy on a stimulus presentation computer. On the EEG recording computer, a Labstreaminglayer recorder software (https://github.com/labstreaminglayer/App-LabRecorder) was used to wirelessly detect the signal streams from both the EEG amplifier and the stimulus presentation triggers, and visualise ongoing signals during EEG recording. We used BrainVision RNet caps with 32 electrodes, arranged according to the international standard 10–10 system for electrode placement28,29. The signal was digitised at a 500 Hz sample rate.
Data Records
All data and code reported here are publicly available30. The raw infant EEG recordings are formatted according to the BIDS31,32 standard and hosted on OpenNeuro (https://doi.org/10.18112/OPENNEURO.DS005106.v1.5.0)30. The preprocessed data, individual RDMs, and RSA results are included for convenience, as well as the custom Matlab code to generate the technical validation figures in this paper. The data repository contains instructions and example code on how to get started with analyses30.
Technical Validation
We performed basic quality checks and technical validation for each subject individually by examining signal amplitude in the frequency domain, and by using a standard multivariate pattern analysis in the time-domain10. Note that this pipeline is not made to be an optimal analysis of the potential of the dataset, but its goal is to validate the presence of condition-specific information.
We applied the clean_rawdata preprocessing pipeline (see provided analysis code) from the EEGlab (v2023.0) toolbox33 in Matlab (R2023b). This automated pipeline includes a 0.5 Hz highpass filter, bad segment deletion (which resulted in an average exclusion of 1.5% of epochs per infant), and bad channel deletion (average 6.5 channels per infant). In addition, data were filtered using a Hamming windowed FIR 40 Hz lowpass filter and re-referenced to the average reference. Epochs were then created for each individual stimulus presentation ranging from [−100 to 800 ms] relative to stimulus onset. No further preprocessing steps were applied for the analyses presented here.
We then used the fieldtrip34 toolbox (version 20230926) to compute the power spectrum between 0–40 Hz using a Fast Fourier Transform (FFT) with a fixed length Hanning window of 0.8 s yielding a frequency resolution of 1.25 Hz. We averaged the frequency spectra across epochs for each infant, to examine their neural response at the 5 Hz presentation rate and its corresponding harmonics. Figure 2 confirms that in most infants, a strong 5 Hz signal originating from occipital electrodes can be observed.
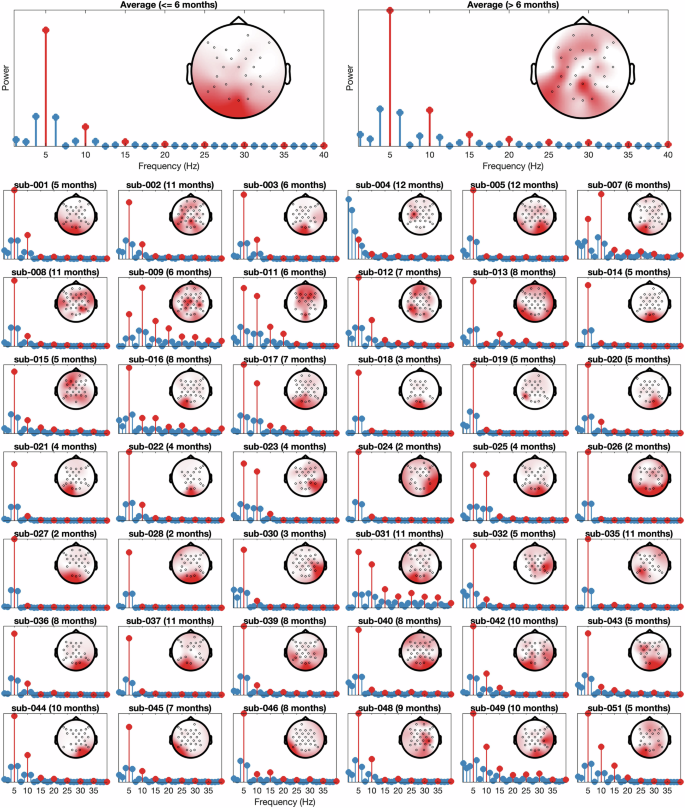
Averaged (top left for the younger, and top right for the older group) and individual power spectrum. The 5 Hz presentation frequency and harmonics (10 Hz, 15 Hz, 20 Hz, etc) shown in red. Insets in each plot are the channel topographies of the 5 Hz response.
To test for condition-related information in the EEG responses, we performed time-resolved representational similarity analyses10,35 in Matlab using the CoSMoMVPA toolbox36. First, we created RDMs for each infant by baseline-correcting and PCA-transforming the data from posterior electrodes (C3, CP5, CP1, Pz, P3, P7, P9, O1, Oz, O2, P10, P8, P4, CP2, CP6, C4, Cz), averaging the PCA transformed responses to each of the 200 images, and computing the dissimilarity (1-pearson correlation) between each pair of images, separately for each time point in the epochs. This yielded a 200 by 200 representational dissimilarity matrix (RDM) for each time point for each infant. To probe general developmental effects for the purpose of the technical validation, instead of a more granular age analysis, we averaged the infant data into two groups: up to 6 months, and over 6 months. To estimate categorical information in the infant and adult RDMs, we created binary model RDMs at three levels (object, category, and animacy) that represented same (0) or different (1) content, and computed the Spearman correlation between the lower triangles (excluding the diagonal) of the model and the neural RDMs at each time point10,15,35. We then calculated cluster-based p-values by shuffling the RDMs 1000 times and re-computing the correlations, applied a cluster-forming threshold of p < 0.05 and calculated the maximum cluster statistic for each permutation. We then reported the clusters in the original correlation result that exceeded 95% of the max-statistic permutation distribution. Results indicated decodable information about the categorical levels in infants over 6 months but non-significant decoding in infants up to 6 months (Fig. 3). Decoding results from the older group but not the younger group showed a comparable temporal dynamics to adult EEG representations obtained previously with the same 200 object stimuli and 5 Hz rapid stimulus presentation15 (see original publication for further details).
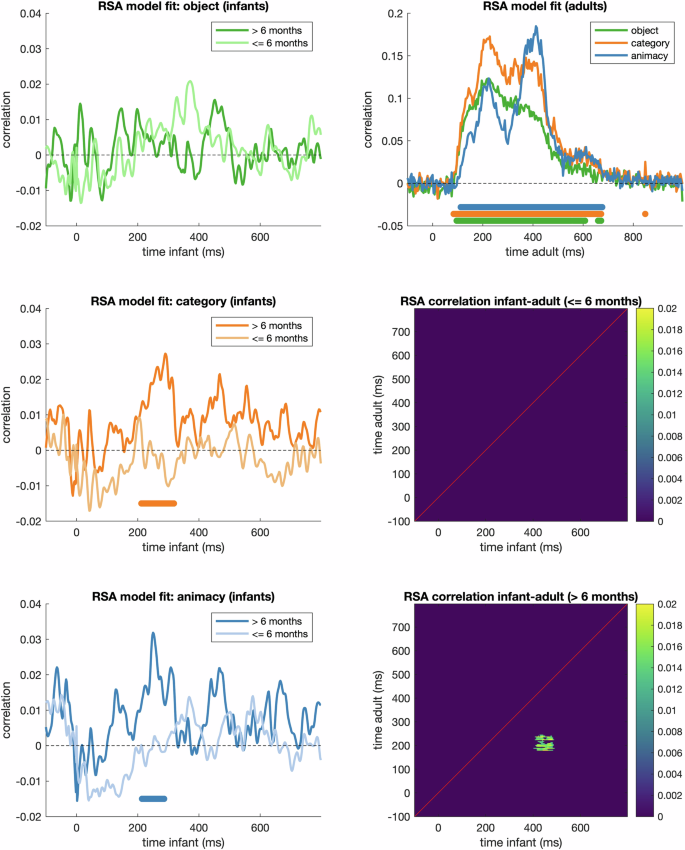
Time-varying Representational Similarity Analysis (RSA) results. Left: RSA model fits for the infant RDM for 3 categorical levels, split by age group. Marks above the x-axis indicate p < 0.05 (cluster-corrected). Top-right: RSA model fits for the adult RDMs for comparison, with marks above the x-axis indicating p < 0.05 (cluster-corrected). Bottom-right: Time-time correlation matrices between the two infant groups and adult RDMs, thresholded at p < 0.05 (cluster-corrected). The significant cluster below the diagonal suggest that object representations arising during later stages of the older infant response (400–500 ms) significantly correlated to an early stage of the adult neural response (150–250 ms).
Finally, we evaluated how well our infant RDMs overlapped with those from this existing openly available adult EEG dataset15. For analysing the structural overlap between infant and adult data, we performed a time-time Spearman correlation between the two averaged infant RDMs (up to 6 months, and over 6 months) and the mean adult RDMs at each pair of time points, resulting in a time-time correlation matrix. We then calculated cluster-based p-values similar to the above (1000 permutations, cluster-forming threshold p < 0.05). Figure 3 shows that for the up to 6 month olds, no adult-infant-correlations survived multiple comparison correction. However, the over 6 months olds showed a cluster of shared variance in the representational structures of the two groups spanning approximately 400–500 ms in the infant data to 150–250 ms in the adult data (Fig. 3).


Responses