Hyperbolic polaritons in twisted β-Ga2O3
Introduction
Phonon polaritons, quasiparticles resulting from the interaction between photons and lattice vibrations1,2,3,4,5, have garnered significant interest due to their low loss and intense field confinement. Recently, van der Waals (vdW) materials have been shown to support phonon polaritons, which has attracted considerable attention. For instance, elliptical and hyperbolic polaritons have been observed in single-layer α-MoO3, attributed to the in-plane anisotropy of the materials5. It is also observed that two different modes of hyperbolic polaritons (HPs)—a surface mode and a volume mode—coexist in α-MoO36. Researchers have also explored similar properties in other van der Waals materials, demonstrating various polaritonic behaviors in WTe27,8, α-V2O59, ATeMoO610, h-BN2,11,12, and LiV2O513. The primary research focus on the manipulation of light at sub-wavelength scale. So far, several techniques have been used, including adjusting the frequency of incident light2,5,14,15, varying material thickness13, cutting crystals in different directions16,17, selecting diverse substrates18, and altering the isotopic enrichment of materials15,19. While these approaches modulate the loss, wavelength, and distribution of polaritons, they do not address the crystal lattice, a fundamental determinant of crystal properties. A novel approach was further introduced18 by stacking slabs of α-MoO3 at multiple angles, leading to a topological transition in dispersion from hyperbolic to elliptical. Since atomic arrangement is closely linked to the band structure and interlayer coupling in vdW materials, altering the lattice’s periodicity and symmetry through rotation18,20,21 enables phenomena like canalization22,23 and topological transitions of polaritons21,24,25, with a new concept termed “twistronics”26,27,28. However, many vdW materials, such as α-MoO3 and α-V2O5, exhibit high symmetry of crystal, affecting the dispersion of their permittivity tensors29,30,31. This symmetry restricts permittivity variation, limiting polariton excitation to specific combinations of permittivity, such as in-plane anisotropy with positive out-of-plane components and in-plane isotropy with negative out-of-plane components. Consequently, only one type of polaritons, whether surface, volume32, or ghost modes17, could be typically excited. Therefore, the coupling and topological transition involve only polaritons with the same out-of-plane distribution, excluding the manipulation of vertical locality, and affect only the in-plane field distributions.
In contrast, crystals with lower symmetry, like CdWO433 and β-Ga2O334,35, can exhibit more varied frequency-dispersive dielectric permittivity. β-Ga2O3, a monoclinic crystal, supports hyperbolic shear polaritons. Unlike orthorhombic crystals, the dispersion of its permittivity is less regular, allowing for the identification of more frequencies where permittivity differs significantly across directions. β-Ga2O3 provides us a great platform to study the manipulation of polaritons, and give us a deeper insight into the relationship of crystal structure and the feature of polaritons.
In this study, by stacking β-Ga2O3 slabs of equal thickness, we observe the coexistence of the fundamental mode (M0) and the first higher order mode (M1) at multiple frequencies. As the upper slab rotates, the electric field transitions from a “four-wings” to a “two-wings” pattern. Following the preceding methodology36, we derive a dispersion model for the bilayer structure. To address limitations in previous models, our analytical approach incorporates the influence of out-of-plane permittivity, enabling the distinction between surface and volume modes. Additionally, we examine the vertical electric fields of polaritons and reveal a correlation between the vertical confinement of polaritons and the parity of the electric field. Our findings extend the understanding of polariton coupling by revealing interactions between polaritons with distinct vertical localities.
Results
The bilayer β-Ga2O3 structure and numerical simulations
We constructed a twisted bilayer structure, where both layers of β-Ga2O3 are of equal thickness (Fig. 1a). For simplicity, we have chosen air as both the substrate and superstrate. However, low-loss materials with a minimal real permittivity in the range of 705–730 cm−1 would also be suitable as the substrate. The slabs are assumed to be infinite in-plane. Crystal directions [100] and [010] were designated as the x and z axes, respectively. Given the monoclinic symmetry of β-Ga2O334,35, the crystal direction [001] is orthogonal to [010] and forms an angle of 103.7° with [100]. To simplify the coordinate system, we selected the direction that forms a right-handed coordinate with the x and z axes as the y-axis. The twist angle between the two layers is denoted as θ. Owing to the low symmetry of β-Ga2O3, its permittivity tensor exhibits significant differences compared to orthorhombic crystals like α-MoO337,38, especially in the presence of non-diagonal elements (Fig. 1b). The permittivity along the principal axes differ significantly in their dispersion, allows greater flexibility for subwavelength light control29,31.
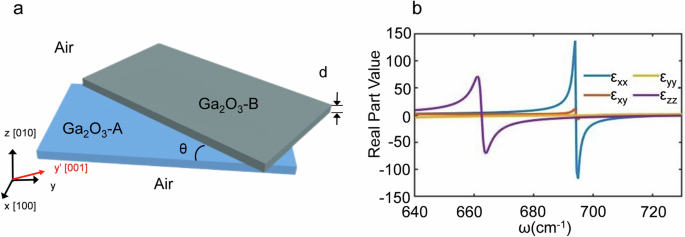
a Twisted stacks of β-Ga2O3 with a thickness of d. The superstrate and substrate are air. Direction [001] is within the x-y plane but is not orthogonal to the x-axis [001]. b The components of permittivity tensor of β-Ga2O3.
Within the Reststrahlen band of β-Ga2O3, HPs are excited when the permittivity components along the x and y directions exhibit opposite signs. To support additional modes in the slabs, we maintain a uniform thickness of 400 nm for β-Ga2O3 in the simulation. Notably, in the monoclinic crystal β-Ga2O3, the excitation of HPs is governed not only by the sign of the in-plane dielectric permittivity values but also by the out-of-plane permittivity29. When the in-plane components have opposite signs and the real part of the out-of-plane permittivity is negative, two branches of HPs with different orientations are simultaneously excited within the plane. We perform the simulation by finite element software COMSOL Multiphysics, both the real and imaginary parts of the permittivity tensor is considered in the modeling, and the bilayer β-Ga2O3 is sandwiched by air. The whole model is surrounded by Perfect Matched Layers (PML), therefore most of the scattering light can be absorbed and modeling the case where light propagates over an infinite distance without reflection on the edges. Figure 2 exhibits the simulated field at θ = 0°, 45°, and 90° for a fixed frequency of 714 cm-1. Numerical simulations reveal two hyperbolic polariton waveforms—a smaller one and a larger one—coexisting within the structure (Fig. 2a). The fast Fourier transform (FFT) of Re(Ez) reveals two contiguous hyperbolas (Fig. 2d), and Ez is the z component of the electric field. We refer to this phenomenon, where two branches of HPs coexist, as the “four-wings” state. In contrast, when only one branch of HPs is present, we describe it as the “two-wings” state. Upon rotating the upper layer of β-Ga2O3, the smaller polariton diminishes (see Supplementary Information, Section 2). The wavelength and propagation distance of the larger polariton also change as the twist angle θ increases (Fig. 2b, c). Hence, the merging of HPs is accompanied by increased loss, suggesting energy redistribution within the β-Ga2O3 waveguide. While the momentum shifts of the larger polariton indicate variations in dispersion, demonstrating coupling between the polaritons. The changes in the dispersion align with the alterations in the field distribution (Fig. 2e, f). Throughout this process, the polaritons retain a hyperbolic shape, which contrasts with previously observed transitions where the field pattern evolves from an open hyperbola to a closed ellipse6,39.
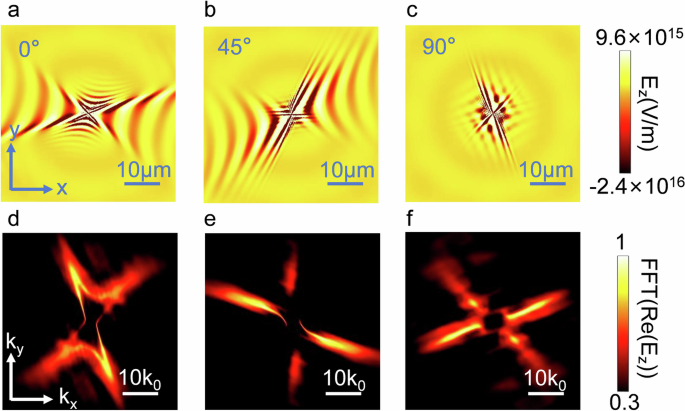
a The field distribution at θ = 0° and the corresponding Fourier spectrum (d). Two distinct HPs coexist. b, c The field distribution at θ = 45° and θ = 90°, and the corresponding Fourier spectrum (e, f), respectively. HPs gradually merge while retaining their hyperbolic character.
The dispersion relations of polaritons
To elucidate the underlying mechanism of this phenomenon, we need to develop a suitable dispersion model to better capture the coupling and redistribution of polaritons during rotation. It is well established that the wavelength of polaritons is significantly smaller than that of incident light12,40. Previous studies have proposed a method for modeling the dispersion relation based on the birefringence characteristics of crystals, identifying the two extraordinary waves in a biaxial birefringent crystal as “o” and “e” polarizations36. In isotropic cases, the eigenvectors of o and e waves degenerate into those of “s” and “p” waves, indicating the continuity of electromagnetic field at the interface between vdWs materials and air. However, when analyzing two stacked layers of β-Ga2O3, the coefficient matrix derived from this method proves difficult to simplify. Consequently, we are unable to obtain an simplified solution akin to that in previous works, which separates each mode by orders. Another approach mentioned in prior studies treats material layers as planes with no thickness and employs conductivity (σ) in the calculations5,18,21. However, this method is unsuitable for our case as it only considers the in-plane permittivity components and neglects the out-of-plane permittivity. The out-of-plane permittivity, however, significantly influences both the distribution and vertical localities of polaritons6,29.
Therefore, a novel approach is required to analyze the dispersion relation in bilayer β-Ga₂O₃. The “four wings” primarily result from the real part of the permittivity tensor, as the imaginary part is significantly smaller by comparison. Therefore, the imaginary component of the permittivity tensor can be neglected in the subsequent calculations. Starting from the source-free Maxwell equations, we represent the plane waves in the slabs by the eigenvectors (|orangle) and (|erangle), while the plane waves in the substrate and superstrate are represented by (|srangle) and (|prangle),
where ({q}_{i}=(i=x,y,z)) are components of normalized wavevectors, and ({e}_{ij}(i=o,e;j=x,y,z)) denote the components of electric fields in crystal, as detailed in Eq. S10, Supplementary Information, Section 1. We can calculate the electric field in each region of the structure and express the fields in each layer as a superposition of plane waves (see Supplementary Information, Section 1 for details).
The tangential components of both the electric field intensity E and the magnetic field intensity H are continuous at the boundary. Consequently, we introduce the in-plane sub-vectors of E’s eigenvectors, denoted (|{xi }_{n}rangle), and derive the sub-vectors of H, denoted ({|{xi }_{n}rangle }_{pm }^{text{‘}}), from the relation ({{boldsymbol{H}}}_{t}={e}_{z}times {{boldsymbol{q}}}_{i}times {boldsymbol{E}}). (n=1,2,3,4) represent the regions in the model, and (xi =o,e,s,p). The dispersion equations are derived from the continuity of the field (see Eq. S15, Supplementary Information, Section 1). To simplify these equations, we adopt the “large k” approximation, where k ≫ k0, with k and k0 denoting the polaritonic and free-space wavevectors, respectively. Under this assumption, the boundary condition does not apply to the o-wave within the material or the s-wave outside it, allowing us to focus exclusively on the e- and p-waves. The equations are multiplied with bra-vectors (langle p|), simplified using Gaussian elimination, and are expressed in matrix form as follows:
Where kz is the wavenumber along z-axis. For the equations to have non-zero solutions, the determinant of the coefficient matrix must be zero. After the simplification of the matrix, we have the dispersion equation by expand its determinant:
By Eq. (3) we obtain the iso-frequency contours (IFCs), namely, the dispersion curves of polaritons (Fig. 3). Due to the periodic nature of the dispersion equation, the IFCs display modes of different orders together. These IFCs represent potential guided modes in k-space, but only the lower-order modes, which experience less loss, can propagate in real space. In contrast, higher-order modes, exhibiting greater loss, do not appear in the electric field. Since the IFCs of higher-order modes tend to occur at larger k-space coordinates, we limit the plotting range to focus on the lower-order modes associated with polaritons observed in the simulated electric fields. The similarity between the Fourier spectrums and the dispersion validates our model (see Supplementary Information, Section 2). The IFCs of single-layer β-Ga₂O₃ illustrate that the electric dipole simultaneously excites two types of modes in the crystal: volume modes and surface modes (see Supplementary Material, Section 3). Surface modes propagate over extended distances in-plane yet decay rapidly along the out-of-plane direction. These modes are essentially evanescent waves localized at the interface between the two-dimensional materials and air, characterized by Im[kz] >> Re[kz]16,41. In contrast, volume modes, which exhibit less decay along the out-of-plane direction, behave as harmonic waves that oscillate and transmit within the slab waveguide, with Re[kz] >> Im[kz]42,43. Utilizing the distinct features of surface and volume modes, we obtain their IFCs from the imaginary and real parts of Eq. (2), respectively, and represent them with warm colors (red and yellow) for surface modes and cool colors (light and dark blue) for volume modes (Fig. 3). By comparing the IFCs of single-layer β-Ga₂O₃ with the obtained dispersion contours and the simulated fields, it is evident that the larger polariton in the field aligns with the fundamental mode (M0) while the smaller one aligns with the first higher-order mode (M1) (see Supplementary Material, Section 3). The former is a surface mode, while the latter is a volume mode, the two modes exhibit distinct vertical localities.
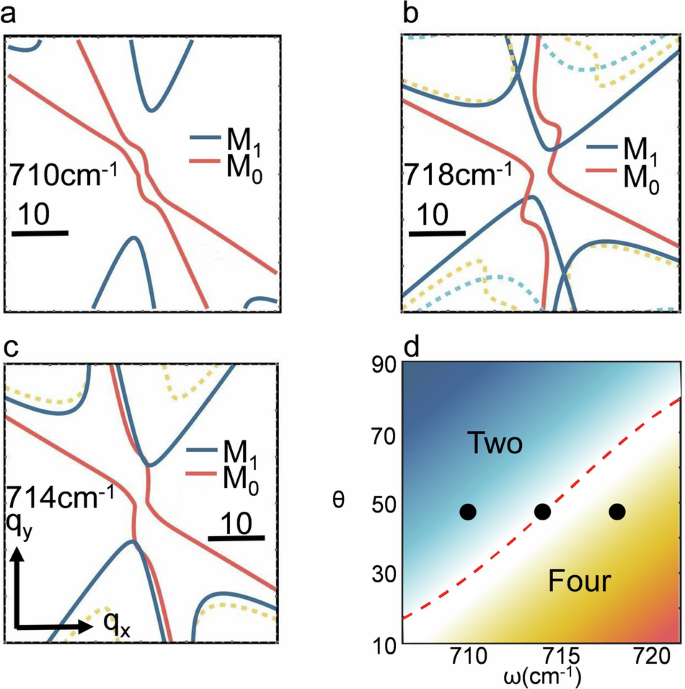
a IFCs at ω = 710 cm−1, the red and bule curves are separated. b IFCs at ω = 718 cm−1, the red and bule curves intersect. c IFCs at ω = 714 cm−1, the red and bule curves are parallel to each other. d Relationship between the distribution of polaritons with the frequency ω and twist angle θ. The dashed line denotes the critical angle as a function of frequency. Black dots represent the chosen frequencies of the IFCs. The blue and orange regions represent cases in which the field distribution appears to be “two-wings” and “four-wings”, respectively. The coordinates are the normalized wavevectors qx and qy, resulting in unitless scale bars. Dashed dispersion curves represent higher-order modes that do not exist in real space and are not involved in coupling, while solid curves denote modes present in the field. Yellow dashed curves indicate higher-order surface modes, and blue dashed curves represent higher-order volume modes. Red solid curves denote M0, while the blue solid curves signify M1. The relative positioning of these curves illustrates the coupling between the two modes, greater collinearity of their wavevectors correlates with stronger interaction. The IFCs are plotted at the fixed angle of 47.5°, and are derived from the dispersion Eq. (3).
We first analyze the coupling between modes of the same order and vertical locality. As the rotation proceeds, the IFCs of M0 continuously transform (see Supplementary Information, Section 2), driven by the hybridization of the two distinct surface modes. In contrast, the two M1 modes do not couple. Only a pair of hyperbolic blue IFCs rotates, while the other remain stationary, with their hyperbolic shapes unchanged due to the absence of interaction between the M1 modes.
However, examining the coupling between identical modes alone proves insufficient, it is essential to uncover the interactions between distinct modes. Unlike the interaction of identical modes, the coupling of different order modes does not lead to the fusion of iso-frequency contours (IFCs) like18,44, as each IFC serves as an eigen solution of the dispersion equation (Eq. 2). Therefore, we need to find another solution to explain the coupling in the momentum space. Comparison of polariton dispersion with variations in the simulated fields reveals that the coupling between two distinct modes can be elucidated by the superposition of their wavevectors k (see Supplementary Material, Section 2). The magnitude and orientation of k are closely linked to the light propagation. For points on the IFCs, the corresponding wavevectors are represented by their connection to the origin of the coordinates (O, qx = qy = 0). As the IFCs show, there are no collinear wavevectors for M0 and M1 at θ = 0 (see Supplementary Material, Fig. S1a). However, as the upper slab rotates, collinear wavevectors k of the two modes emerge, and simultaneously, the simulated field reveals the fusion of polaritons (see Supplementary Information, Section 2). The greater the collinearity between the wavevectors of M0 and M1, the more deeply they fuse. Ultimately, the IFCs reach a critical point where the surface mode transitions from intersecting the volume mode to becoming tangent or parallel, indicating complete overlap of the wavevector ranges for M0 and M1. Compared to the electric field, this critical point corresponds precisely to the angle θ at which the smaller polariton vanishes, signaling the full integration of surface and volume modes. Thus we define the twist angle at which the red and blue curves are just tangent or parallel as the critical angle of transition between “four-wings” mode and “two-wings” pattern. Within the frequency range of 706 to 722 cm−1;, the critical angle is positively correlated with frequency (Fig. 3d). At a fixed angle of 47.5°, we present IFCs at three frequencies—710 cm−1 (Fig. 3a), 714 cm−1 (Fig. 3c), and 718 cm−1 (Fig. 3b)—corresponding to the black dots in Fig. 3d. It is evident that the red and blue curves are relatively far apart in the “two-wings” region at 710 cm−1 (Fig. 3d), where all wavevectors of the volume mode have collinear counterparts in the surface mode (Fig. 3a). At 714 cm−1, the two IFCs become parallel (Fig. 3c). However, at 718 cm−1, the blue curves still intersect with the red, indicating that some wavevectors of the volume mode remain non-collinear with those of the surface mode (Fig. 3b). As a result, the polaritons retain a “four-wings” configuration, with the smaller volume mode persisting. Moreover, to verify the definition of the critical angle, we stack the IFCs of single-layer β-Ga₂O₃ at various angles (see Supplementary Information, Section 6). The curves of the two M1s are precisely tangent at the critical angle of 47.5°, indicating that the collinearity between the wavevectors almost reaches its maximum at this angle, thereby confirming the validity of our analysis of coupling through k. Theoretical analysis reveals that the transition from “four-wings” state to “two-wings” state arises from the interaction between polaritons with distinct vertical localities. Compared to previous work14, this introduces a new dimension for polariton coupling.
Analysis of coupling from the perspective of vertical field distribution
To further elucidate the surface-volume coupling during the rotation, we need to find out how the vertical localities of polariton change. If the modulus of the electric field intensity |E| peaks at the slab’s center, the polariton is identified as a volume mode; if |E| reaches a local minimum, it is classified as a surface mode6. Some polaritons also exhibit intermediate characteristics between these two states. We begin with the case where the θ = 20°, sectioning the field in the direction where the two modes exhibit their largest amplitudes (Fig. 4a). For the volume mode, the cross profile reveals a distinct oscillatory pattern within the β-Ga2O3, represented by alternating light and dark pattern (Fig. 4d). Conversely, the surface mode produces a “hollow” region at the center, indicating that the surface polariton does not penetrate into the middle of the waveguide due to the large out-plane loss (Fig. 4b). This observation confirms the previous analysis of surface and volume characteristics (Fig. 3). As the twist angle θ approaches the critical angle of 47.5° (Fig. 4f), the propagation directions of the two modes gradually overlap, leading to their coupling. The behavior of the volume mode changes significantly (Fig. 4i), the corresponding Ez no longer reaches its maximum at z = 0 (Fig. 4j). The volume mode loses its intrinsic nature, signaling increased loss within the slab. At the same θ, Fig. 4g shows the vertical field distribution of the surface mode is also affected, featuring lower loss along the z-axis, suggesting the coupling between the volume and surface modes. As rotation continues (Fig. 4k–o), the fusion of the two modes becomes more pronounced. For the volume mode, the field within the material decreases, while the surface mode becomes more prominent inside the waveguide. However, the cross profiles and plots at θ = 72° show little difference from those at θ = 47.5°, indicating that as θ reaches the critical angle, the two polaritons have nearly fully integrated, with the degree of fusion changing little with further increases in the angle between the slabs. Changes in the vertical field illustrate the overlap of surface and volume modes, confirming their interaction. It is also discovered that the wavelength of the surface mode decreases as the twist angle of the slabs increase.
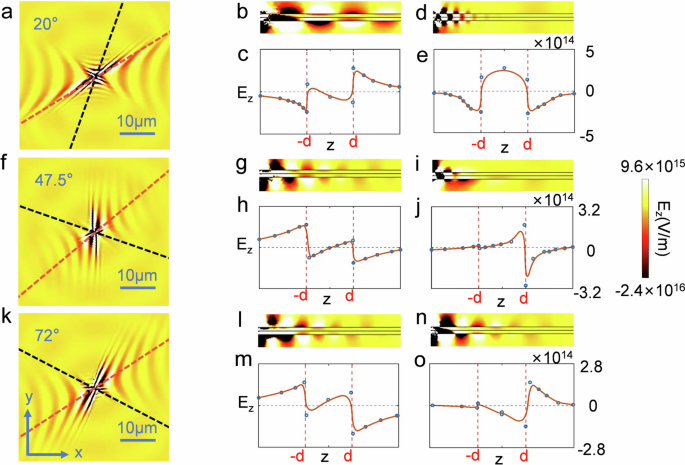
a The electric field at θ = 20°. b, d The cross-sections of the surface and volume mode at θ = 20°, with their corresponding Ez distributions (c, e), respectively. The surface mode (M0) exhibits odd parity, while the volume mode (M1) shows even parity. f The electric field at θ = 47.5°. g, i The cross-sections of the surface and volume mode at θ = 47.5°, with their corresponding Ez distributions (h, j), respectively. k The electric field at θ = 72°. l, n The cross-sections of the surface and volume mode at θ = 72°, along with their corresponding Ez distributions (m, o), respectively. Blue dots in the plot represent the data, and the orange curves denote the results of fitting. As θ increases, the polaritons gradually gained more features of each other.
Additionally, the z component of M0 and M1 exhibit distinct parities, as they belong to different orders. The Ez of M1 exhibits even parity, with a mirror-symmetric electric field distribution about the line z = 0 (Fig. 4e). In contrast, the Ez of M0 displays a distribution akin to an odd function on either side of z = 0 (Fig. 4c). This distinction allows us to observe the transition and coupling mechanisms of the polaritons not only through the intensity distribution of the modes but also through their symmetry. Comparing the distributions of Ez along z-axis, we can see both the M0 and M1 gradually lost their original parity, and both of them acquire some characters of each other (Fig. 4h, j, m, o).
Discussions
In conclusion, by stacking slabs of β-Ga2O3, we discover the coexistence of different order modes of two distinct vertical localities within a specific frequency range. Based on this, we reveal a novel coupling behavior of polaritons during rotation. Specifically, the coupling of the two modes increases the loss of the volume mode, while the surface mode acquires volume properties through this interaction. Through theoretical analysis, we validate the numerical simulation and introduce a new approach to study the interaction of different-order modes of polaritons.
This phenomena observed in twisted β-Ga2O3 slabs enables us to manipulate the longitudinal attenuation characteristics of polaritons at fixed frequency points and material thickness, opening a new dimension for optical field control within sub-wavelength scales.
Our research, involving the fusion of polaritons of varying orders and decaying characteristics, can inspire new directions for polariton studies with promising applications in integrated photonics and nano-optics. Additionally, the introduction of novel interlayer electron wavefunction interactions could inspire the design of advanced nanostructures, such as innovative heterostructures.


Responses