Hypermutability bypasses genetic constraints in SCV phenotypic switching in Pseudomonas aeruginosa biofilms
Introduction
Pseudomonas aeruginosa is a versatile Gram-negative bacterium known for its ability to thrive in diverse environments1. It is also a significant opportunistic human pathogen causing a range of infections, particularly in individuals with compromised immune systems2,3. Of notable concern is its involvement in chronic lung infections, a primary affliction in cystic fibrosis (CF) patients. A key adaptation of P. aeruginosa is its ability to thrive as biofilm populations within the thick mucus of CF patients4,5. The biofilm lifestyle represents a significant challenge in chronic infections endowing P. aeruginosa with heightened resistance to antibiotics and increased ability to evade host immune defense6. The development of biofilm is a dynamic process characterized by three meticulously regulated stages: attachment, maturation, and dispersal. These stages involve the transition from planktonic to biofilm growth modes and vice versa, resulting in the transformation of initially mobile, free-living cells into sessile, biofilm-adapted phenotypes7. Furthermore, within the biofilm structure, the presence of chemical gradients gives rise to structurally heterogeneous microenvironments, driving an adaptive radiation process in response to local variations in nutrient and oxygen availability. This process leads to the emergence, selection, and fixation of the multiple biofilms adapted variants8, contributing to the enhanced biodiversity and phenotypic diversification observed within the CF lung’s intricate and temporal-spatial complexities. The extent of this adaptive radiation can be clearly demonstrated observed by plating a sputum sample onto agar plate, where diverse colony morphologies represent the biofilm’s phenotypic variety9.
One of the most prevalent phenotypes in P. aeruginosa biofilms is that of small colony variants (SCVs)10. SCVs give rise to diminutive colonies, typically measuring 1–3 mm in size, comprised of highly adhesive cells that exhibit increased biofilm production capabilities, albeit with reduced motility11,12. Significantly, the presence of P. aeruginosa SCVs in CF sputum samples has been associated with heightened antibiotic resistance, prolonged infection persistence, diminished pulmonary function, and an unfavorable prognosis for the patient13,14,15. Recent research on the molecular bases of SCV conversion has established a frequent association between the characteristic morphology of SCV colonies and elevated intracellular levels of the second messenger bis-(3′ → 5′)-cyclic dimeric guanosine monophosphate (c-di-GMP)11. This molecule plays a pivotal role as a chemical signal in the transition from planktonic, free-living cells to biofilm growth. Intracellular c-di-GMP levels result from a subtle balance between its synthesis and degradation, regulated by diguanylate cyclases (DGC) and phosphodiesterases (PDE), respectively. Notably, the P. aeruginosa genome harbors over 40 genes encoding DGCs and PDEs, highlighting the complexity and redundancy within the genetic pathways associated with the c-di-GMP metabolism16,17. Conversely, the reversion of the SCV phenotype to its original traits, including colony morphology, biofilm formation and motility, has been documented under specific in vitro conditions. Consequently, this phenotypic switching in SCV, encompassing both conversion and reversion of SCVs, resembles the stages of biofilm formation and dispersal, respectively. Nevertheless, despite their significant clinical implications, the genetic pathways governing the conversion/reversion to the SCV phenotype, which P. aeruginosa employs for adaptation to these alternating cycles of biofilm growth and planktonic dispersion, remain to be fully elucidated.
Another pivotal trait frequently observed in P. aeruginosa isolates from chronic CF infections is the mutator phenotype, characterized by elevated mutation rates18,19,20,21. Hypermutability in CF is predominantly a result of loss-of-function mutations in the mutS and mutL genes, which are integral components of the mismatch repair system (MRS)22. Mutators have been documented to enhance genetic adaptation to CF airways through the increased accumulation of advantageous mutations, primarily associated to antibiotic resistance23,24,25. Our previous investigations have further established a link between hypermutability and the emergence of CF-related phenotypes, such as mucoid conversion and reversion, as well as quorum sensing inactivation26,27,28,29. Notably, we have reported that P. aeruginosa mutators deficient in MRS enhance adaptability in biofilms under in vitro conditions by augmenting phenotypic diversification, thereby leading to a higher emergence rate of variants adapted to the biofilm growth mode30.
In this study, we have delved into the adaptive capacity of P. aeruginosa to transition between the SCV biofilm-adapted phenotype and its revertant state. Additionally, we explored the significance of hypermutability due to MRS deficiency in these processes. Through experimental evolution assays and whole-genome sequencing, we unveiled the intricacies of the bimodal phenotypic switch inherent to SCV conversion and reversion cycles. Our findings elucidate the underlying mechanism, involving the cumulative accrual of compensatory mutations in genes encoding or regulating various DGCs and PDEs, which lead to successive fluctuations in intracellular c-di-GMP levels. It was revealed that strong genetic constraints posed substantial challenges for the normomutator strain during the course of evolution. However, mutator evolutionary lines exhibited the ability to overcome these constraints, enabling a higher number of cycles of increasing and decreasing c-di-GMP levels, thus facilitating successive SCV conversion and reversion switches.
This unique approach uncovers the uncharted territory of the P. aeruginosa capacity to adapt in response to the alternating challenges presented by the biofilm mode of growth, thus enriching our understanding of the intricate interplay between genetics and phenotypic plasticity and the potential advantage that hypermutability may offer in the context of chronic infections.
Results
Establishing evolutionary lines for normomutator and mutator P. aeruginosa strains
It has been postulated that mutator bacterial strains may exhibit accelerated adaptive strategies, providing them with advantages in dynamic environments where new phenotypes continually emerge through the beneficial mutations they might generate31,32,33. To evaluate the impact of elevated mutation rates on the adaptive potential of P. aeruginosa, we conducted a systematic evolutionary study focused on the phenotypic switching triggered in biofilms. In this context, we established four independent evolutionary lines using the P. aeruginosa UCBPP-PA14 strain (hereafter referred to as WT) and another four lines using its isogenic mutS-deficient mutator strain (hereafter referred to as mutS) (Fig. 1a and Supplementary Table 4). Each independent evolutionary line was subjected to successive and alternating cycles of growth in biofilms (conversion), during which SCVs frequently emerged, followed by cycles of growth on solid media (reversion), wherein SCVs exhibited signs of phenotypic reversion (Fig. 1b). During the conversion phase, biofilms were cultured in 96-multiwell microplates for 4 days, with daily replacement of the LB broth culture with fresh media. After incubation, biofilms attached to the inner surface of the well, were disaggregated and plated on LB agar to quantify the emergence of biofilm-adapted SCVs (Fig. 1c). During the reversion phase, the selected SCV clone was plated in MacConkey agar plates for 48 h at 37 °C followed by 48 h at room temperature (Fig. 1c). As showed in Fig. 1b-III, a reversion halo was clearly observed from the edges of the colony, from where we streaked in a new LB agar plate to isolate the reverted morphotype. Thus, we introduced population bottlenecks at each cycle of evolution by randomly selecting a single SCV from each evolved line, which served as the founder for the subsequent reversion cycle. Similarly, a single reverted clone was randomly chosen from the reversion cycle to serve as the founder for the next biofilm conversion cycle (Fig. 1). This process of conversion and reversion concluded when the frequency of conversion to SCV (FSCV) fell below 0.01% (Supplementary Table 2).
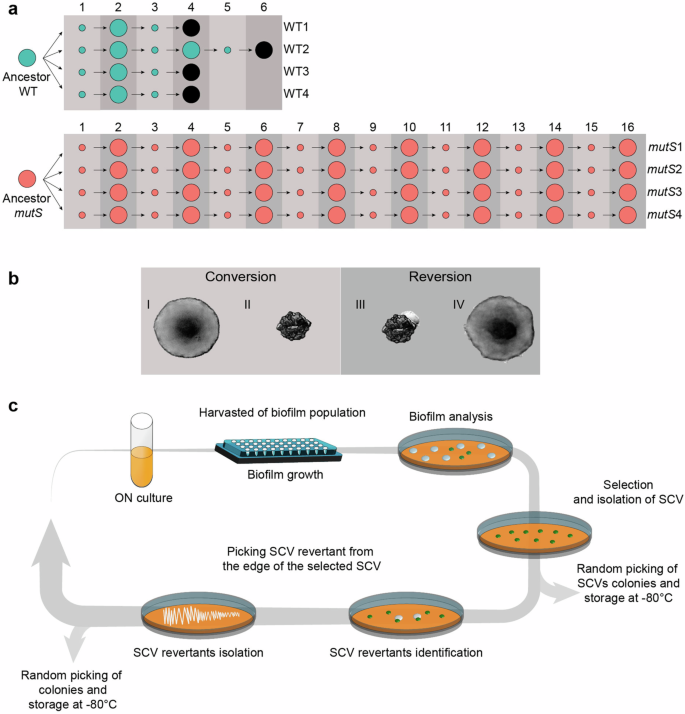
a Four independent lines derived from both WT and mutS ancestor strains were evolved through successive rounds of conversion/reversion to the SCV phenotype. For each conversion, one SCV clone was randomly selected as the founder of the next evolution round. Likewise, for consecutive reversions, one reverted clone was selected, ensuring randomness. Small circles indicate SCV colonies, and large circles represent reverted variants, both selected as founders in each cycle. Colonies smaller than 3 mm in diameter with a convex, opaque, and rugose appearance were identified as SCVs, while colonies larger than 3 mm with a smoother and flatter morphology were classified as revertants. Numbers above indicate the evolutionary cycle. The nomenclature for each line is indicated on the right. Black circles denote rounds where the FSCV dropped below 0.01% among more than 1 × 10⁴ colony-forming units (CFUs) analyzed, marking the termination of the line. For mutator lines, as none exhibited a drastical drop in FSCV, the experiment was arbitrarily concluded at round 16. b The phenotypic switch in the SCV phenotype can be identified in vitro by visualizing colony morphology acquired on agar plates. Typical P. aeruginosa morphotype (I) diversifies during biofilm culture, where SCV colonies (II) are commonly observed. During growth in solid media, a reversion zone appears from the edges of these SCV variants (III), composed of a non-aggregative morphotype (IV). c A round of evolution begins when ancestors (I) or a revertant colony clone (IV) overnight culture (ON) grow in biofilm in a 96-multiwell microplate for 4 days, with daily replacement of the broth culture with fresh media. Diversification is commonly observed when the biofilm is harvested and plated on LB agar, marking a conversion cycle. One SCV clone is randomly chosen as the founder of the subsequent reversion cycle. During reversion, SCVs on MacConkey agar plates undergo a reversion phenomenon similar to that observed in b. Revertant smooth morphotypes from the reversion zone are isolated by streaking onto an agar plate. The revertant morphotype is randomly selected and stored as the representative of the reversion cycle and can be used as the founder of a new evolutionary cycle.
Evolved lineages and clones were phenotypically characterized through visual inspection, biofilm formation, motility, auto-aggregation and exopolysaccharide production (EPS). As depicted in Fig. 2, the transition in colony morphology corresponded with alterations in all above-mentioned phenotypes. For nearly all these tested phenotypic traits, the reverted clones showed results similar to those of their parental strains, confirming a reversion from the SCV morphology.
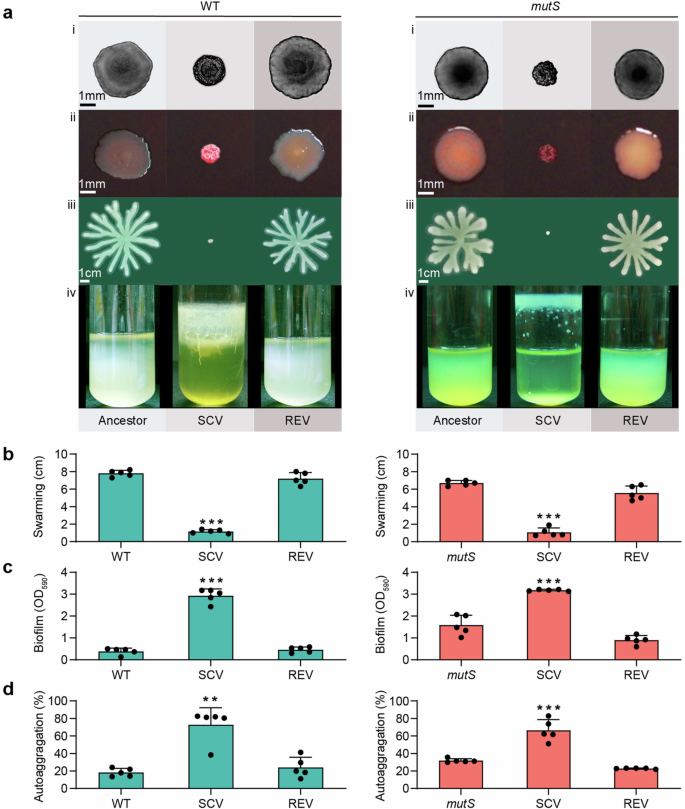
Characterization of SCV and revertant clones (REV) phenotypes is shown. a The phenotypic properties are detailed qualitatively: i) morphology on LB agar plates, ii) exopolysaccharide production determined by Congo red staining, iii) swarming motility, iv) auto-aggregation (transparency of the culture) and biofilm production (growth ring adhered to the glass). b–d Quantification of swarming motility, biofilms production by crystal violet technique and auto-aggregation. Bars represent the analysis of a minimum of 5 independent experiments. Each experiment consisted of biological replicates, with at least 3 colonies analyzed per assay. Values were analyzed by one-way ANOVA and Tukey post hoc test (*P < 0.05, **P < 0.01, ***P < 0.001).
Early evolutionary rounds show strong constraints on successive phenotypic switching in WT biofilms
In the first round of conversion, over 90% of the phenotypic composition in biofilms from WT ancestor strains was comprised of SCV, while the remaining colonies exhibited morphologies similar to the parental strain (Figs. 3a, b). In contrast, biofilms of the mutS ancestor strain exhibited approximately 40% SCV morphotypes, 40% parental-like morphotypes, and at least 4 additional morphotypes with varying relative abundances (Figs. 3a, c). Shannon-Weaver (H) analyses for both populations indicated a heightened diversity within the mutS population (H = 0.408 ± 0.034) compared to WT (H = 0.071 ± 0.007) (Fig. 3a). These results confirms prior findings regarding the relationship between hypermutability and increased phenotypic diversification in biofilms28,30.
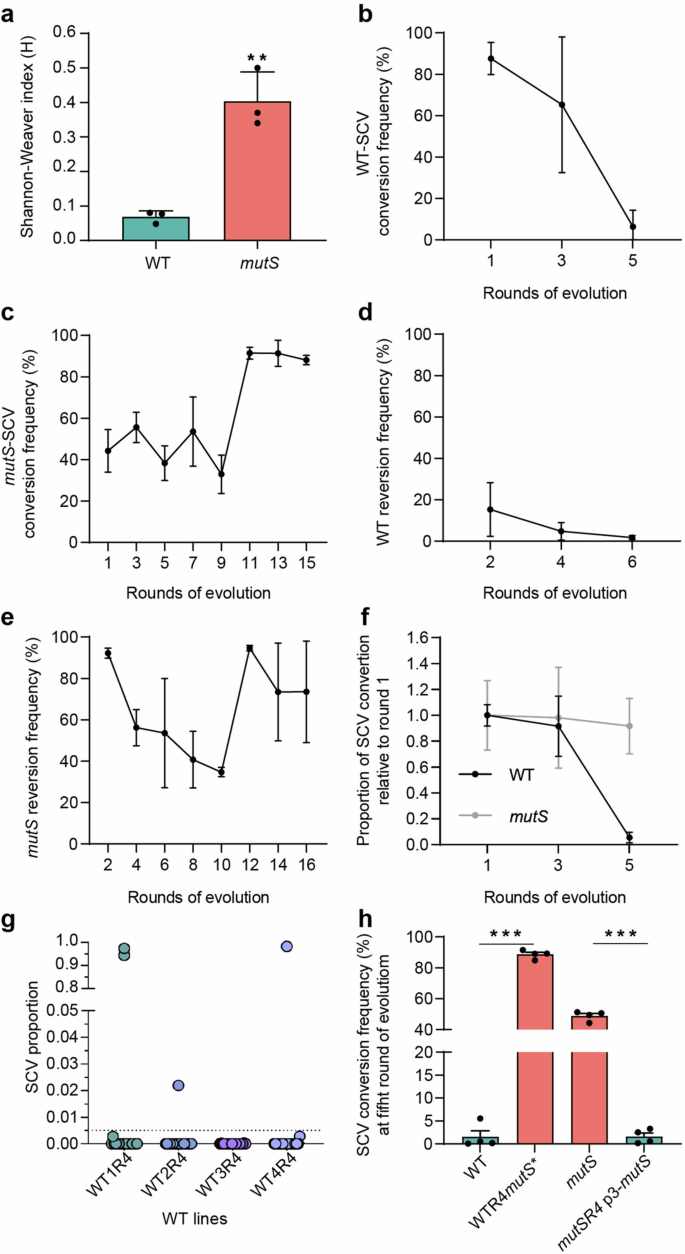
a Phenotypic diversity observed in biofilms of WT and mutS ancestor strains by visual inspection and quantification by Shannon-Weaver index (H). Bars represent the mean values of the H index ± SD from three independent experiments. b, c SCV conversion frequency in WT and mutS strains. d, e Reversion frequency in WT and mutS lines. f Proportion of SCV variants during biofilm cultures relative to the first cycle of evolution. Data are plotted using predictions from a linear mixed-effects model (proportion SCV ~ strain + cycle + strain x cycle + 1|line). g Phenotypic constraints in SCV switching in WT lines after four rounds of evolution. Twenty independent biofilms cultures were initiated with reverted clones from round 4 of evolution from each WT line. Each culture was harvested, plated on LB agar, and the SCV emergence was determined as a proportion out of 2×10^3 CFUs scrutinized. Each circle represents an independent biofilm. h Disruption of the mutS gene in round 4 of WT clone (WTR4mutS*) leads to an increase in the frequency of SCV, allowing the strain to overcome the genetic constraint exhibited by the WT lines in the fifth round of evolution. Conversely, expression of a wild-type copy of mutS gene in a mutator strain in round 4 in trans (mutSR4 p3-mutS) diminishes the frequency of SCV conversion, exhibiting the same genetic restriction to evolve as WT lines in the fifth round. Values were analyzed by one-way ANOVA and Tukey post hoc test (**P < 0.01, ***P < 0.001).
During the initial two rounds of conversion (rounds 1 and 3), the FSCV remained relatively stable in both WT and mutS strains (Figs. 3b, c). However, in the WT evolutionary lines, a substantial restriction on the FSCV was observed in round 5, resulting in three dropping below 0.01% among more than 1×10⁴ CFU analyzed (Supplementary Table 2). The remaining WT line, although with a significantly low value, continued until the seventh round, where it also dropped below 0.01%, leading to the termination of its evolution (Figs. 1a, 3b, Supplementary Table 2). On the other hand, reversion frequencies for the WT lines were near 20% in round 2 but decreased to about 2% by the end of the experiment (Fig. 3d). In contrast, the mutS lines exhibited the ability to maintain consistent FSCV values without encountering any indications of constraints in the conversion/reversion processes (Fig. 1a, 3c, e). As explained by a linear mixed-effects model (LME, see Methods), the proportion of SCV colonies decreased in WT strains over time, while remaining constant in mutS strains, underscoring the significant influence of both strain type (χ2 = 13.096, P < 0.001) and the interaction between strain and evolutionary round (χ2 = 9.852, P < 0.001) on the genetic restriction observed in WT (Fig. 3f). The experiment was arbitrarily concluded at round 16 for the mutS lines. Extensive phenotypic characterization was performed on every clone in WT and mutS evolved lines (Supplementary Fig. 1, 2).
WT lines encountered challenges in overcoming phenotypic constraints after 4 rounds of evolution
To further explore the sudden decline in emergence of SCV observed in the fifth cycle of evolution in the WT lines, we investigated the ability of the constrained clones in round 4 to establish new biofilm capable of converting to SCV phenotype. We initiated twenty independent biofilms from each 4 reverted clones of all WT lines from the fourth round, and screened 2×10³ CFUs from these biofilms, specifically targeting the SCV morphotype. As illustrated in Fig. 3g, the vast majority of biofilms, approximately 95%, displayed an FSCV below 0.01%, with SCVs detected in only 5 of them. Among the 80 biofilms, only 4 did not exhibit this result. Notably, of the 4 successful biofilms, 2 originated from WT1 and 1 form WT4, achieving SCV percentages above 95% (Fig. 3g).
Hypermutability bypasses constraints in phenotypic switching triggered in biofilms
The observed disparities in SCV conversion and reversion frequencies between WT and mutS can be attributed to the elevated mutation rate (Supplementary Table 1). An increased mutation rate appears to enhance the probability of acquiring beneficial mutations32, thereby enabling the mutator lines to adapt to a new SCV switch. To test this hypothesis, we investigated whether elevating the mutation rates in WT clones from round 4 could bypass the observed genetic constraint. For this purpose, we disrupted the mutS gene in round 4-revertant clones of the WT lines and used these mutant clones to cultivate biofilms, similarly to a conversion cycle, subsequently assessing the presence of SCVs. As depicted in Fig. 3h, the disruption of the mutS gene in WT revertant clones from round 4 alleviated the genetic constraint, leading to an increase in FSCV from less than 0.01% to approximately 90%.
Expanding these findings, we further restored the MRS function by expressing, in trans, a wild type copy of mutS gene within mutS-deficient clones from round 4. Remarkably, when mutator lines were complemented with mutS, they exhibited a significant decrease in FSCV similar to the reduction observed in the WT lines (Fig. 3h). This finding corroborates that the complemented mutator line experienced the same SCV conversion constraints as the WT lines, underscoring the pivotal role of an increased mutation rate in this adaptive process of continuous and successive transition to SCV phenotypes.
Parallel evolution in evolutionary lines via mutagenesis of Wsp and Yfi signal transduction systems
To elucidate the molecular basis underlying the successive conversion and reversion to the SCV phenotype, we conducted whole-genome sequencing (WGS) on the most evolved clone from the WT3 line and compared with the WT ancestor. Analysis of the mutational history revealed an accumulation of mutations proportional to the number of evolution cycles, with one mutation detected per round. These mutations were located in genes involved in the metabolism of the second messenger c-di-GMP (Table 1), specifically affecting the Wsp and Yfi signal transduction systems, which are encoded by the wspABCDEFR and yfiBNR operons, respectively (Fig. 4a and Supplementary Fig. 3). Detailed analysis across the WT1, WT2 and WT3 lines demonstrated that mutations consistently affected these systems, indicating parallel evolution. Mutations observed were predominantly transitions (47.5%), followed by a lower percentage of indels (27.5%) and transversions (25%). Furthermore, mutations accumulated in a specific order, such that when a mutation occurred in one signal transduction system, the next mutation arose in the same system, either in the same or in a different gene, following a compensatory pattern (Table 1, Fig. 4a, and Supplementary Fig. 4).
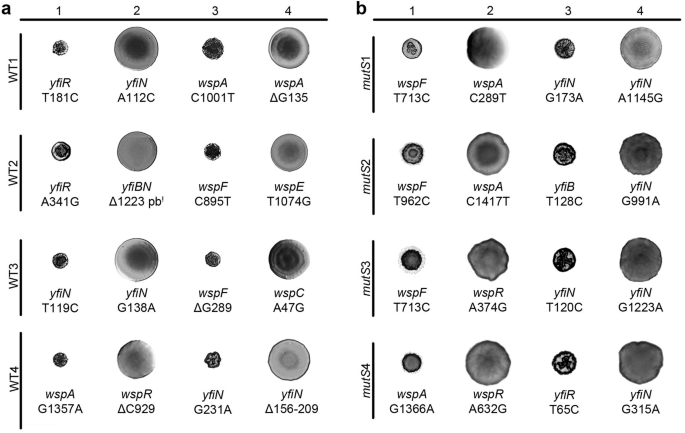
The colony morphologies and mutations determined in clones selected in the initial four rounds of evolution are shown for the four independent WT (a) and mutS (b) evolutionary lines. Mutations in the wsp and yfi regulatory systems accumulated at a rate of one mutation per round of evolution, indicating a mechanism of compensatory mutation.
To illustrate this in detail, we present the mutational history of the WT1 lineage. For the analysis of additional lines, refer to the Supplementary Material.
In this line, the initial mutation, a T118C substitution in the yfiR gene, resulted in an amino acid alteration from Tryptophan to Arginine at position 61 of the protein (W61R). Although this substitution has not been previously characterized, W61 residue is highly conserved even among distantly related bacterial sequences34, suggesting an impact on the repressive role of YfiR in the transduction system, likely leading to activation of YfiN, increased c-di-GMP synthesis, and SCV conversion.
Subsequent compensation of this mutation in the WT1R2 clone occurred via an A112C substitution within the yfiN (also known as tpbP) gene, leading to a Threonine to Proline change at position 38 (T38P), within the PAS domain (Supplementary Fig. 4). Although novel, this mutation’s effects on colony morphology and phenotypes suggest disruption of DGC functionality, resulting in reduced c-di-GMP levels.
Mutations within the WspA receptor protein emerged during rounds 3 and 4. In round 3, a C1001T substitution cause an Alanine to Valine change at position 334 (A334V). This substitution lies within the methyl group acceptor domain of WspA (Supplementary Fig. 4) potentially inducing an activated state within the Wsp system, thereby triggering WspR activation and c-di-GMP synthesis. Subsequent compensation for this mutation involved a novel ΔG136 deletion at position 136 the wspA gene, causing a frameshift and a premature stop codon at position 78. This truncated protein lacks 464 amino acids compared to the wild-type variant, effectively abolishing WspA functionality and counteracting the previous round’s mutation, thereby diminishing c-di-GMP levels.
The WT2 line was the only WT line capable of adapting to SCV phenotypes through six successive cycles (Table 1). In the first four cycles of evolution, the WT2 line exhibited parallel mutations within the Wsp and Yfi systems, similar to the other lines. However, upon the inactivation of these systems, we observed mutations in two other genes associated with c-di-GMP metabolism, PA14-72420, also known as dgcP, and morA. The SCV clone WT2R5 showed a 15 bp deletion (Δ1297-1312 bp) in PA14_72420 gene, also known as dgcP, which contains a GGDEF domain and would encode a cytoplasmic DGC17 (Table 2). In Pseudomonas fluorescens, the region from 1224 to 1340 bp of the orthologous gene acts as a negative regulator of the downstream DGC domain35, suggesting that its disruption increases the enzymatic activity of the protein, resulting in elevated c-di-GMP synthesis. In the WT2R5 clone, the deletion did not generate any frameshift, preserving the integrity of DGC domain. Subsequently, in the following round, the revertant clone WT2R6 acquired a G2551T substitution in the morA gene, resulting in a premature TAG stop codon. MorA functions as a global regulator of motility anchored to the cytoplasmic membrane. It possesses a catalytic region at the C-terminus comprising both GGDEF and EAL domains, making it a hybrid or dual protein36. Deletion of this gene in P. aeruginosa UCBPP-PA14 reduces adherence to Congo red and decreases flagella-mediated motilities17 such as swarming and swimming, correlating with the altered swarming observed in clone WT2R6 (Supplementary Fig. 1).
To assess the prevalence of convergent mutations following the fourth round of evolution, whole-genome sequencing was conducted on SCV clones obtained from the independent biofilms initiated with clones from round 4 (Fig. 3g). Genomic DNA was pooled from two sets: (i) one SCV randomly selected from each of the three biofilms that showed the emergency of SCV from WT1 line (designated as pool-seq 1, Fig. 3g); and (ii) 10 SCV clones obtained from the single biofilm that showed the emergence of SCV initiated from the WT4 line (designated as pool-seq 2, Fig. 3g).
Analysis of the pool-seq 1 data revealed that the three SCV clones employed distinct genetic pathways to overcome the imposed constraint (Table 2). Notably, one of these pathways involved a 105 base pair deletion, once again impacting the negative regulator domain of the PA14_72420 gene35. The second pathway involved a mutation in the kinase SiaB, a component of the siaABCD operon responsible for regulating SiaD DGC activity37. Remarkably, the third SCV clone acquired an insertion in the wspA gene, restoring the frameshift caused by the deletion observed in round 4 (Table 2). These findings highlight the involvement of genes associated with the general metabolism of c-di-GMP in P. aeruginosa in the adaptive mutational pathways leading to SCV morphology during successive cycles of conversion and reversion within biofilms. On the other hand, all SCV clones from pool-seq 2 harbored a shared mutation within the morA gene (A3442G) (Table 2), indicating that this mutation likely emerged during the initial stages of biofilm development, which explain the high FSCV observed within this specific biofilm context, as depicted in Fig. 3g.
Dynamic control of SCV phenotype by fluctuating c-di-GMP levels during evolutionary cycles
Subsequently, our investigation focused on understanding the effect of the observed mutations on intracellular c-di-GMP concentrations during the phenotypic switch in conversion and reversion rounds. To achieve this, we used a reporter gene (gfp) regulated by the c-di-GMP-inducible pelA promoter38,39 (Fig. 5a). This construct was integrated into the chromosomes of clones acquired from each round, covering all evolutionary lines. Following this, flow cytometry was used to quantify the levels of gfp expression in these evolved clones. Remarkably, each round of SCV conversion was consistently associated with a marked increase in the intracellular c-di-GMP levels across all lines of evolution. In contrast, a decrease of c-di-GMP levels was uniformly observed in every reversion round of the WT evolutionary lines (Fig. 5 and Supplementary Fig. 5a–c).
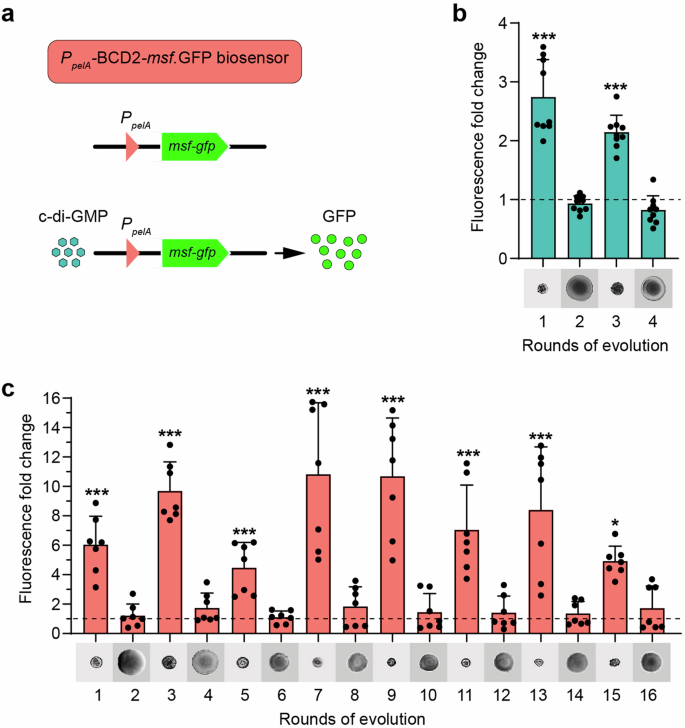
a The monomeric and super folder green fluorescent protein (msf●gfp) is under the transcriptional control of the c-di-GMP-responsive PpelA promoter78 of the pel operon of P. aeruginosa and is genome-integrated through the Tn7-transposon. When intracellular c-di-GMP levels increase, the PpelA promoter is positively regulated and in vivo c-di-GMP levels are measured through the fluorescence output of the cells. c-di-GMP levels sensed by the PpelA-BCD2-msf●gfp reporter were measured by flow cytometry. b Relative fluorescent output values were calculated by normalizing the average fluorescence level of P. aeruginosa UCBPP-PA14 parental strain (dashed line). The colony morphology in LB agar of the entire WT1 line is shown. c In vivo c-di-GMP levels correspond with SCV phenotypic switching in mutS evolutionary lines. Relative fluorescence output values were calculated by normalizing the average fluorescence level of the P. aeruginosa mutS ancestor (dashed line). The colony morphology on LB agar of the entire mutS1 line is also shown. Bars represent the values of msf●gfp fluorescence as a fold change ± standard deviation from a minimum of five independent measurements. The relative fluorescence output, expressed as arbitrary fluorescence units (AFU), of the WT and mutS ancestors were comparable, with 81 ± 50 and 80 ± 41 AFU, respectively. Values were analyzed by one-way ANOVA and Tukey post hoc test (*P < 0.05, ***P < 0.001).
To ascertain whether these observed phenotypic changes could be reversed by modulating c-di-GMP levels, we conducted an overexpression experiment using plasmid-mediated expression of two key enzymes: the DGC WspR and the PDE PA2133. Strikingly, the expression of PA2133 led to complete reversion of the SCV phenotype in all tested clones, while the expression of wspR successfully led to the SCV phenotype in all revertant clones (Supplementary Fig. 5d–g). Altogether, these results demonstrate that the mutations accumulated during the progression of the different conversion/reversion rounds drives the switching of SCV phenotype by modulating the intracellular levels of c-di-GMP.
Mutator lines overcome genetic restrictions through mutations in c-di-GMP pathways, leading to the modulation of c-di-GMP levels
To investigate the adaptive strategies employed by mutators to overcome the genetic restrictions encountered during successive adaptations within this evolutionary scheme, we conducted WGS of all clones from round 3 of the mutS lines. As anticipated, mutator clones exhibited a significantly higher accumulation of mutations, averaging 19 ± 2 mutations per round of evolution. The mutational spectrum was predominantly characterized by transitions (approximately 80%), with insertions and deletions (indels) comprising a smaller proportion (approximately 14%) (Supplementary Fig. 6). These indels frequently occurred within G:C Simple Sequence Repeats (SSR) accounting for approximately 62% of the observed mutations. This observation aligns with our previous investigations on mutational spectrum of mutators27,28,29,40.
We further examined the mutational history, particularly in genes from the Wsp and Yfi systems, by analyzing the order in which mutations were acquired in each of the evolutionary lines. Additionally, mutations accumulated in rounds 4, 5 and 6 were investigated using Sanger sequencing across all related wsp and yfi genes. As observed in Fig. 4b, similar to the pattern observed in WT lines, mutations in these signal transduction pathways accumulated at a rate of one per cycle (see also Mutational history in Supplementary Information). This suggests that, despite differences in mutational load, there is a strong parallelism between the evolution pathways explored in WT and mutS lines, based on compensatory mutations that affect Wsp and Yfi systems. Furthermore, the mutator line mutS2, which initially had mutations in wsp genes in rounds 1 and 2, accumulated additional mutations in Wsp transduction system in rounds 5 and 6 (Table 3). In the SCV clone mutS2R5, a novel mutation occurred in the wspA gene: the A1418G transition. This mutation restored the premature stop codon TAG generated by the round 2 mutation to TGG, encoding tryptophan (*473 W). Consequently, the protein sequence of the WspA receptor was restored, potentially preserving the effect of the wspF mutation from cycle 1, which led to constitutive activation of the transduction system. In the mutS2R6 clone, compensation occurred via the C1067T transition (A356V) in the Histidine kinase domain of WspE (Supplementary Fig. 4). This mutation, located two amino acids before the mutation found in clone WT2R4, further suggests the potential for reverting the SCV phenotype through mutations in this WspE domain, potentially altering its ability to transfer the phosphate group and activate WspR (Tables 1, 3).
Despite the accumulation of numerous mutations per cycle, we hypothesized whether the mutations specifically affecting systems that control intracellular c-di-GMP levels were key in the phenotypic switch. In vivo analysis of c-di-GMP levels in both the SCV and revertant clones of the mutS1 line provided compelling evidence that all observed phenotypic changes were correlated with alterations in c-di-GMP levels (Fig. 5c). Although the relative c-di-GMP values appear to be higher than those observed in the WT lines, these findings indicate a direct link between c-di-GMP signaling alterations and the observed phenotypic variations in the mutators. To further validate this correlation, we performed an overexpression experiment using plasmid-mediated expression of the PA2133 PDE gene (Supplementary Fig. 7). Analysis of colony morphology, autoagregation and biofilm formation reveled a complete reversion of the SCV phenotype in all tested clones.
Having established that mutations in the Wsp and Yfi systems predominantly accumulated during the initial four rounds of evolution, with corresponding fluctuations in c-di-GMP levels, we then extended our analysis beyond the fourth round. We specifically focused on the mutS1 line to identify the total accumulated mutations across all evolutionary rounds in comparison to the ancestral mutS strain.
WGS of clone mutS1R16 revealed a total of 265 mutations, averaging 16 mutations per round of evolution. To evaluate the broader impact of these, we categorized genes with non-synonymous mutations using predefined categories from InterPro41. Most mutations were found in genes linked to small molecule transport and putative enzymes, followed by those associated with various metabolic processes, transcriptional regulators, protein translation and modification, and two-component systems (Supplementary Fig. 7e). Notably, at least eight genes involved in c-di-GMP metabolism, including those in the Wsp and Yfi systems, as well as morA, rbdA and pvrS were affected (Suppplementary Table 3). Additionally, mutations were observed in 12 genes related to motility, adherence, biofilm formation, and the SCV phenotype (Supplementary Table 3). These findings suggest that while initial mutations primarily affect the Wsp and Yfi systems, mutator lines may continue adapting by acquiring mutations in alternative c-di-GMP regulatory pathways, expanding the genetic routes available for phenotypic switching observed in SCV conversion and reversion.
To further investigate the genetic mechanisms at a critical point of restriction in the WT that the mutator strain could bypass, we performed additional sequencing on round 5. The analysis of the mutS1R5 clone genome revealed a guanine insertion (+G) in a 6G sequence repeat of the pvrS gene, the same present in mutS1R16, causing a frameshift mutation and a stop codon at position 664 of the sensor kinase (Supplementary Table 3). The PvrSR and RcsCB two-component systems regulate the expression of cupD gene cluster, which encodes the CupD fimbriae necessary for the initial attachment stage of biofilm formation42. All these elements are encoded by the pathogenicity island PAPI-1. Specifically, the RcsB regulator activates transcription, while PvrR, an EAL domain-containing repressor, inhibits cupD in a c-di-GMP-dependent manner43,44. Importantly, overexpression of pvrS increases cupD promoter activity, leading to the SCV phenotype43,44. Further comprehensive investigations are necessary to assess the effect of the +1 G 1697 mutation on SCV conversion and to fully elucidate the mechanisms underlying bacterial adaptation.
Mathematical insights into SCV phenotype switch in P. aeruginosa
The results obtained thus far indicate that mutations in both WT and mutator lines primarily affect the Wsp and Yfi pathways, highlighting an inherent hierarchical architecture35 among the 32 predicted DGCs in the PA14 genome. Nonetheless, while the SCV phenotypic switch in WT lines encounters significant constraints by the fifth cycle of evolution, mutator lines appear to bypass these limitations by accumulating mutations in alternative systems that would regulate c-di-GMP levels.
To establish a mathematical rationale for the observed genomic architecture in both WT and mutator strains of P. aeruginosa, we adapted a model previously proposed45 to predict mutational routes leading to wrinkly spreader (WS) phenotypes in P. fluorescens. Applying this model to the Wsp, Yfi, Sia, and MorA signaling pathways in P. aeruginosa, we found that the predictions align with the observed hierarchy or architecture within the genome (Supplementary Fig. 8).
Recognizing the potential of mathematical and mechanistic models to predict genomic architecture, we developed a general and foundational mathematical and conceptual framework, inspired by the work of Lind and colleagues45. This framework was designed to underpin future investigations into mutational pathways, genomic architecture, and adaptation (See Supplementary material). Lind’s models45 function as specific instances within the broader framework we developed.
Our proposed mathematical objects and concepts allow the characterization of observed phenomena that influence adaptation as functions – Genomic Mutation Probability Functions (GMPFs)- which shape and define the probabilistic landscape – Probabilistic Phenotypic Mutational Landscape (PPML). This landscape links genomic mutations to phenotypic changes (See Supplementary material), offering the potential for a broad and unifying mathematical rationale that spans multiple scales of adaptation.
To exemplify this concept, we focus on hypermutability induced by a deficient MRS system, which serves as a well-defined GMPF. Previous studies21,40,46 have demonstrated that this type of hypermutability not only exhibits a mutation rate bias but is also characterized by sequence rate and spectral biases (Supplementary material). This implies that hypermutability resulting from MRS deficiency shapes and confines the PPML not just through an elevated mutation rate, but also altering mutational spectra and context-dependent mutation rates, as encoded in the corresponding GMPF. The coexistence of sequence rate bias and spectral bias facilitates the exploration of previously inaccessible regions within the PPML, uniquely tailored to each genomic unit. This intricate interplay results in differentially constrained genomic resources during adaptation, providing a plausible explanation for the observed expansion of genomic architecture in hypermutable MRS-deficient strains (Fig. 6).
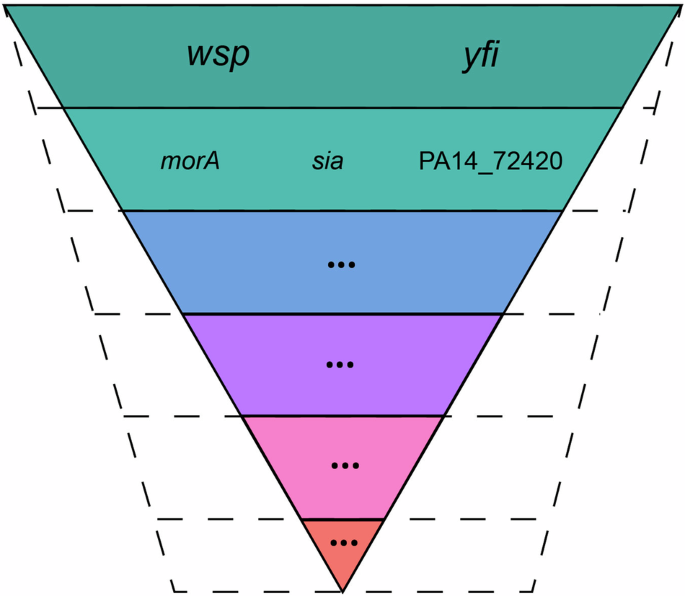
Certain pathways exhibit heightened susceptibility to mutations in WT strains, as depicted by the solid inverted pyramid. Elevated mutation rates stemming from MRS deficiency sculpt and delimit the Phenotypic Probabilistic Mutational Landscape (PPML), leading to an altered genomic architecture, as indicated by slashed lines. Adapted from Lind et al.35.
Discussion
The intricate dynamics of SCV phenotypic switching during the development of P. aeruginosa biofilms reveal a fascinating interplay between genetic evolution and regulatory mechanisms. It is widely recognized that biofilms play a pivotal role in sustaining P. aeruginosa infections, particularly in chronic lung infections among CF patients. The emergence of adapted variants, such as SCVs10,14,47, contributes to phenotypic diversification amidst the complex temporal and spatial landscapes within the lung during long-term CF infections. Our previous studies have highlighted that P. aeruginosa defective in mismatch repair system exhibit heightened adaptability within biofilms under in vitro conditions30. This enhanced adaptability stems from an increased phenotypic diversification, consequently elevating the emergence rate of variants adept at biofilm growth30. In this study, we subjected both WT and mutS-defective strains of P. aeruginosa to continuous and successive transitions between planktonic and biofilm growth stages, elucidating the underlying molecular intricacies. Our investigation revealed the pivotal role of hypermutability in overcoming genetic constraints and maintaining phenotypic diversity throughout successive cycles of SCV conversion and reversion.
In vitro evolutionary biofilm models have been developed to simulate bacterial adaptation to diverse habitats, mirroring conditions in host environments that underlie chronic infections48. These models have served as crucial tools for identifying mutations in the c- di-GMP signaling system, unraveling novel regulatory mechanisms in adaptive evolution. Specifically, extensive research has focused on cellulose-overproducing WS mutants of P. fluorescens SBW25. Notably, these studies have illuminated the constrained mutational pathways guiding WS phenotype evolution in this species35,45,49,50,51. Among them, three key c-di-GMP signaling pathways—the chemotaxis-like system with DGC output involving the response regulator WspR, the Aws (ortholog of YfiN) DGC gene cluster, and the dual DGC/PDE Mws (ortholog of MorA)—emerge as primary targets35,49,50. The concept of ‘target size’ pertains to the size of a gene and the likelihood that alterations will result in viable phenotypes. This intertwines with genetic architecture, which delineates the intricate mapping from genotype to phenotype and is crucial in determining the variational properties and evolutionary potential52. Genes with a large mutational target size are favored targets for repeated evolution, as their evolutionary relevance hinges on the capacity of loss-of-function alleles to generate viable phenotypic variations53. In this context, the evolution of new P. fluorescens WS phenotypes has been proposed. Deletion of the central Wsp, Aws and Mws pathways results in mutations that predominantly affect the activity of other DGC51, suggesting a hierarchical framework wherein genetic constraints may shape evolutionary outcomes, biasing the available molecular variation for selection35. This hierarchy, implies that evolution primarily proceeds through pathways subject to negative regulation, followed by promoter mutations and gene fusions, activation by intragenic gain-of-function mutations and combinatorial mutations in c-di-GMP turnover proteins35,45.
Mutational events affecting the WspABCDEFR chemotactic signaling pathway and YfiBNR system have led to SCV development in P. aeruginosa during CF lung colonization54,55. Moreover, the Wsp system appears as the primary initial locus for mutations governing c-di-GMP levels in the transition between mucoid and dry colony morphologies in P. fluorescens Pf0-1. Additionally, mutations in the Wsp pathway manifest in various contexts, including chronic P. aeruginosa infection in burn wound models56, Burkholderia cenocepacia in heterogeneous microcosms57,58, and hyperbiofilm-producing infections59, thus confirming these pathways possess a higher potential compared to others in translating mutations into phenotypic variations.
In full agreement with these observations, we found in P. aeruginosa that the initial four cycles of the SCV conversion/reversion across all independent lines -whether WT or mutator mutS strains- exhibited a marked trend of parallel evolution. These iterations were characterized by mutations affecting genes within the Wsp and Yfi signal transduction systems, occurring in a discernible order suggestive of a compensatory pattern, where subsequent mutations within the same system, either in the same gene or in a different one, further underscored this compensatory nature. We observed how mutations that spontaneously activate and subsequently deactivate the Wsp and Yfi regulatory modules can serve as a genetic basis for the conversion and reversion of the P. aeruginosa SCV phenotype, respectively. Once WspR and YfiN are spontaneously disrupted, the genetic architecture of P. aeruginosa imposes a strong constraint, directing SCV evolution along pathways that involve alternative DGC. In WT lines, the bacterial response to this genetic constraint entails mutations affecting MorA, PA_72420, and SiaD as well as reversion of mutations affecting wsp genes that occurred in earlier rounds of evolution. Importantly, adhering to the hierarchy imposed by the genetic architecture, mutations that now enable the SCV switch, beyond affecting negative regulators, include intragenic mutations, accounting for minor SCV switch-generating targets.
The genome of P. aeruginosa PA14 contains 39 genes encoding DGCs and PDEs, highlighting the complexity and redundancy inherent in the genetic pathways associated with c-di-GMP metabolism60. In our study, the mutS mutator evolutionary lines maintained consistent FSCV values until round 16 in the SCV phenotypic switching processes, without encountering apparent constraints. Among the notably higher accumulation of mutations observed when we sequenced the genome in round 16, at least eight genes were directly linked to c-di-GMP metabolism, encompassing components of the Wsp and Yfi systems, as well as MorA, RbdA, PvrS. This observation raises the intriguing possibility that, beyond mutations in these systems, changes in the expression levels of other DGCs and PDEs could also contribute to the modulation of c-di-GMP levels during later stages of the evolutionary process, adding an additional layer of regulatory complexity. Additionally, over twelve genes associated with motility, adherence, biofilm formation, and other SCV-related traits were affected. This suggests that hypermutability enables access to multiple genetic routes culminating in the SCV phenotype. Recent mutation accumulation experiments have revealed that a mutator P. aeruginosa strain evolved for higher fitness under planktonic conditions mostly through mutations in membrane and cell wall biosynthesis genes, which were influenced by di-guanylate modulating enzymes, fine-tuning complex regulatory circuits61. This highlights the intricate dynamics of hypermutability and its impact on these redundant and locally specific regulatory pathways, showcasing the remarkable adaptability of P. aeruginosa in distinct environments.
Considering a hierarchical genetic architecture of biofilm-formation pathways in P. aeruginosa, our findings indicate that the evolution of new SCV phenotypes is framed by the architecture of the gene regulatory networks related to c-di-GMP. Certain pathways exhibit a higher propensity for mutation. However, in mutator strains with elevated mutation rates, the mutational target size expands significantly, enabling the exploration of alternative mutational pathways that, although present in WT strains, are masked by the extensive mutational target size of those major c-di-GMP-related pathways. By applying the model proposed by Lind and coworkers45, which originally was formulated for P. fluorescens, we emphasize its effectiveness for probing genetic architecture in P. aeruginosa, suggesting its potential applicability across diverse bacterial genomes. Building on this understanding, our proposed mathematical framework, centered on the Probabilistic Phenotypic Mutational Landscape (PPML) and Genomic Mutation Probability Functions (GMPFs), serves as a versatile foundation for further research. The PPML allows for exploration across various scales, from individual nucleotide sequences to entire pathways, elucidating the combined impact of diverse mutation types on specific genomic units. Simultaneously, GMPFs model different mutational biases, enabling comprehensive analyses that include the influence of epigenetic modifications such as DNA methylation62,63,64. This flexible framework offers a unifying perspective for future investigations into mutational routes, genomic architecture, and the predictability of bacterial adaptation.
As indicated by prior investigations21,40,46, hypermutability arising from a deficient MRS not only falls under the umbrella of a rate bias but also distinctly manifests as sequence rate and spectral biases. This intricate manifestation implies that hypermutability, stemming from MRS deficiency, not only shapes and confines the PPML through heightened mutation rates but also induces modifications in mutational spectra and context-dependent mutation rates. Our previous studies have shown that MRS-deficient strains of P. aeruginosa exhibit a significant increase in mutations within G:C SSRs, impacting a wide range of genes40. Additionally, specific studies on the mucA gene highlighted the role of G SSRs in driving mucoid conversion in hypermutable backgrounds29. Building on these findings, we propose that a predisposition for indels in SSRs, such as the +1 G insertion in the 6 G SSR of the pvrS gene, provides a mechanism by which the mutS1 line can bypass genetic restrictions observed in the WT. This mechanism illiustrates how mutS strains can overcome genetic constraints by leveraging hypermutability to expand the genomic architecture available for exploration. This dynamic interplay uniquely customizes the genomic adaptability of MRS- deficient mutator strain, enabling the emergence of SCV phenotypes through targeted pathways that fine-tune c-di-GMP regulation (Fig. 6). Together, these findings highlight the intricate relationship between hypermutability and SCV phenotypic switching, demonstrating how increased mutation rates, spectral biases, and SSR predispositions collectively facilitate adaptation in biofilms under genetic constraints.
In this study, we focused on SCV conversion not only due to its frequent emergence in the model but also considering its clinical relevance in P. aeruginosa. It is important to highlight the diversification capacity conferred by hypermutability30, which enables the acquisition of distinct phenotypes equally adapted to biofilm growth (Fig. 3a). This observation supports the hypothesis that bypassing genetic restrictions could also occur in these other biofilm-associated phenotypes.
In summary, our findings underscore the pivotal role of hypermutability in enabling adaptation by exploring otherwise inaccessible SCV conversion and reversion pathways, surmounting genetic constraints, and facilitating the translation of mutations into phenotypic variations. While comprehensive research is warranted to fully elucidate how these mutations, operating in a compensatory interplay, intricately modulate c-di-GMP levels, ultimately leading to the emergence of SCVs, our results collectively highlight its crucial significance. They demonstrate how hypermutability allows P. aeruginosa to find alternative solutions when major genetic pathways for evolution and adaptation, which have been exhausted due to successive cycles of biofilm formation and reversion in unstable environments, are no longer available.
Methods
Bacterial strains, plasmids, and culture conditions
The bacterial strains and plasmids employed in the present study are listed in Supplementary Table 4. P. aeruginosa PA14 WT and PA14 mutS deficient strains were provided by Dr. Eliana Drenkard from the Massachusetts General Hospital, Boston, USA. E. coli and P. aeruginosa strains were routinely cultured on LB agar plates from frozen stocks and overnight in LB broth at 37 °C with shaking at 220 rpm. When needed, antibiotics were used at the following concentrations: 10 μg mL−1 gentamicin (Gm), 100 μg mL−1 ampicillin (Amp), 25 μg mL−1 kanamycin (Km), 6 μg mL−1 chloramphenicol (Cl) and 50 μg mL−1 streptomycin (Sm) for E. coli; and 40 μg mL−1 Gm, 30 μg mL−1 tetracycline (Tc) and 500 μg mL−1 Sm for P. aeruginosa. All primers used in this study are listed in Supplementary Table 5.
General DNA manipulation
All kits and enzymes were used according to the manufacturer’s recommendations. Genomic DNA was purified using a Promega Wizard Genomic DNA Purification kit (Promega, USA). Plasmid and DNA purification were performing with NucleoSpin Plasmid EasyPure Mini kit and NucleoSpin Gel and PCR Clean-up Mini kit (Macherey-Nagel, Düren, Alemania). PCR was performed using Phusion High-Fidelity DNA Polymerases (Thermo Fisher Scientific, USA), and OneTaq Quick-Load 2X Master Mix (New England Biolabs, USA). All restriction enzymes were Fastdigest (Thermo Fisher Scientific, USA).
In vitro experimental evolution assay
P. aeruginosa PA14 WT and PA14 mutS strains were used as ancestral clones to start four independent WT and mutS evolutionary lines, respectively. These lines were subjected to successive and alternating cycles of growth in biofilms, during which SCVs frequently emerged (conversion), followed by growth cycles on solid media, wherein SCVs exhibited signs of phenotypic reversion (reversion, Fig. 1b). The beginning of the experiment from ancestors, as well as every conversion cycle, was conducted as follows: from an overnight culture, appropriate dilutions were made to obtain the starting stock of 10–100 cells in 200 µL LB broth. Cells were grown in a 96-well microtiter dish for four days at 37 °C under static conditions, with daily replacement of the culture media with 200 µL of fresh LB broth. Additional precautions were taken to avoid disrupt the ring of growing biofilm attached to the plastic well in each replacement. After incubation, biofilms were harvested from the circumference of the well with a glass rod, mechanically disassembled by vortex and plated on LB agar. After 24 h of incubation, plates were visually inspected for the emergence of SCVs. SCVs were visually distinguished as colonies measuring less than 3 mm in diameter, with a convex, opaque, and rugose appearance. Single SCVs were randomly chosen and stored at −80 °C in skimmed milk. For reversion cycles, SCVs were disaggregated using a pipette tip and appropriate dilutions were plated on MacConkey agar, incubated for 2 days at 37 °C, followed by additional 2 days at room temperature. Reversion events were identified in some SCVs as smooth appendices growing from the edge of the colony, as described in Fig. 1b. The reverted zone was carefully picked and streaked onto LB plates, yielding colonies exceeding 3 mm in diameter and characterized by a smooth appearance. These colonies were carefully isolated from the reverted zone and streaked onto LB plates for further screening. Revertant colonies were randomly chosen and stored at −80 °C in 15% glycerol. This morphotype served as the precursor for a new round of evolution. Evolutionary lines were ended in rounds where the frequency of SCV emergence was below 0.01% among more than 1×10⁵ CFU analyzed.
Phenotypic characterization
Colony morphologies were examined on LB agar plates after 24 h of incubation at 37 °C and recorded using a direct microscope Axioplan (Zeiss, Germany) equipped with a 4X Plan CN objective (Olympus, Japan) and an Axioplan digital camera. Exopolysaccharides production was evaluated by Congo red agar plates (Tryptone, 10 g l−1; Congo red, 40 g l−1; Coomassie brilliant blue, 20 g l−1; agar, 10 g l−1) as described previously65. To determine auto-aggregation, bacterial cells were grown in LB broth for 16 h at 37 °C and 250 rpm followed by an additional incubation of 3 h at room temperature in static conditions, to allow sedimentation. Swarming motility assays were performed in M8 plates with 0.5% agar for 48 h at 37° C66. Biofilm formation was measured using the crystal violet (CV) staining method in a 96-well microtiter plate67, and absorbance was measured with an EpochTM Microplate Spectrophotometer (BioTek Instruments, Inc., Winooski, VT, USA). Conversion frequency was determined as the percentage of SCVs observed in the examined biofilm community by plating on LB agar. Reversion frequency was calculated by plating a disaggregated SCV clones on MacConkey plates and scoring the percentage of cells exhibiting clear signs of reversion from the SCV morphotype.
Determination of mutation frequencies
Mutation frequencies of the ancestral strains were determined by quantifying the number of colonies spontaneously resistant to streptomycin (500 µg/mL) on agar plates. Briefly, 10 mL of LB broth in flasks were inoculated and incubated for 24 h at 37 °C with constant agitation. Serial dilutions of each culture were plated on LB agar to estimate the total cell count. Simultaneously, LB agar plates supplemented with 500 µg/mL streptomycin were used to count colonies that had spontaneously acquired resistance. Mutation frequency was calculated as the number of streptomycin-resistant colonies per 108 cells. The experiment was performed in triplicate and repeated independently twice to ensure reproducibility.
Whole genome sequencing
Ancestors WT and mutS were sequencing using a paired-end (PE) 2x150pb HiSeq 2500 Illumina (Xcelris Labs Limited, India). Mutators mutS clones from cycle 3 as well as clone WT3R4 were sequenced in a 2X100pb on an Illumina HiSeq1500 (INDEAR Genome Sequencing facility, Argentina). The mutS clones from line 1 obtained in cycles 5 and 16 were selected for whole-genome sequencing using a 2X100pb on an Illumina Miseq platform (INDEAR Genome Sequencing facility, Argentina). Sequencing details are described in Supplementary Table 6. Quality of raw reads was firstly assessing with FastQC tool and the adapter sequence were removed by the program Trimmomatic68. Filtered reads were mapped against the PA14 reference genome (GenBank accession no. NC_008463.1) using BWA-mem algorithm with default parameters69. Removing duplicates was performed with Picard MarkDuplicates and single nucleotide polymorphisms (SNPs) and small insertions and deletions (indels) were identified with HaplotypeCaller from Genome Analysis ToolKit (GATK version 4.1.2.0)70. To annotate and to identify their effect on coding DNA sequences, we used SNPeff71 version 1.9.5. The final mutational dataset of each evolved clone was obtained by excluding the variants found in each ancestor genome, which were processed with the same pipeline and considered a potential false positive (Supplementary Table 7). Only variant sites with QUAL equal or greater than 1000 were considered. Subsets of candidate mutations in each evolutionary line were validated by PCR amplification and Sanger Sequencing (University of Chicago Comprehensive Cancer Center DNA Sequencing and Genotyping Facility) using a primer pair for each fragment containing the position of the putative change (Supplementary Table 5). For the mutational history determination, mutation detected by WGS was verify by PCR and Sanger sequencing in every clone belonging to the evolutionary line. In the case of WT2 line and mutS clones from round 4, 5 and 6, candidate genes were amplified by PCR and analyzed through Sanger sequencing to elucidate their mutational history.
Whole-genome sequencing of pools of individuals (Pool-seq)
Twenty biofilms were started with reverted clone obtained in cycle 4 in all WT lines, cultivate in static conditions and harvested as explained before. From here, one SCV clone was obtained in each of the three successful biofilms from WT1 and selected for Pool-seq 1(Fig. 3g). Ten randomly chosen SCV clones from the successful WT4 biofilm were selected for Pool-seq 2 (Fig. 3g). Genomic DNA from each selected clone was collected and purified. The DNA quantity was determined using a Qubit Fluorometric Quantitation fluorometer (Thermo Fisher Scientific, USA), and appropriate dilutions were mixed to equally represent each genome in the final pool. Library preparation and Paired-end sequencing were then performed on an Illumina MiSeq platform producing 2 × 150 bp read lengths (INDEAR Genome Sequencing facility, Argentina). The bioinformatic analysis against the PA14 reference genome was carried out similarly to the above description with a few modifications. For variant calling, the HaplotypeCaller algorithm was set up with the sample ploidy parameter fixed to 3 or 10 for Pool-seq 1 and 2, respectively. The WT ancestor was analyzed under the same parameters, and variants obtained were excluded from the dataset as potential false positives. Only variant sites with a QUAL score equal to or greater than 1000 were considered for the analysis.
Overexpression of a phosphodiesterase (PDE) or a diguanylate cyclase (DGC) experiments
pJN10572 vector was gently provided by Edgardo Jofre from the Universidad Nacional de Río Cuarto, Córdoba, Argentina. Plasmid pJN213373 harboring the PA2133 phosphodiesterase was kindly provided by Caroline Harwood from University of Washington, Seattle, USA. The PA14_16500 gene, encoding the diguanylate cyclase WspR, was cloned in EcoRI/XbaI sites of pJN105, generating the pJN-wspR vector plasmid. Tetracycline resistance cassette was PCR amplified from PBBR1MCS-3 (p3) vector74 and cloned into the pGEM-T Easy vector (Promega) to create pGEM-Tc. The 1.5 Kb fragment was subsequently cloned into pJN105, pJN-2133 plasmids by digestion with NcoI/ApaI to obtain pJNTc, pJNTc-2133. All plasmids were introduced in P. aeruginosa clones by electroporation. Transformants were plated on LB agar supplemented with 0.2% arabinose to induce PA2133 and wspR expression. Colony morphology was analyzed after 24 h of incubation as previously described.
Diversity in biofilms
Serial dilutions from harvested biofilms were plated during 24 h at 37 °C in LB agar. Morphotypic diversity was scored by visual inspection of plates. Diversity (H) was calculated using the Shannon–Weaver index [H = (N log N−Σ nlog ni)/N], where N is the total number of individuals and ni is the number of individuals of each morphotype. The H index is a dimensionless value ranging from 0 to 1, with 1 representing a more heterogeneous community.
Hypermutability and complementation of hypermutability experiments
pMCS-mutS vector75 was digested with ApeI/SpeI and the 2,6 Kb fragment containing a functional copy of mutS gene was cloned in pBBR1MCS-3 (p3) vector. This vector was introduced by electroporation to a reverted mutS clone from round 4 (mutSR4::p3-mutS).
The mutS gene in WTR4 clone was inactivated by introducing a premature stop codon using a CRISPR/Cas9-mediated base editing system76. Briefly, WTR4 clone was transformed with the vector pMBEC6::mutS, which carries the guide RNA with the spacer sequence GCGTCCAGGAGATAAAAGGC, enabling the C463T (Q155*) mutation. Subsequently, a 10 mL of LB with Gm overnight culture was initiated followed by a second overnight culture in 10 mL of LB supplemented with 10% (w/v) sucrose. 100 μL aliquots were plated on LB agar plates and colonies were inspected for loss of Gm resistance in mirror plates. Colony PCR was employed to amplify the region of the mutS gene and Sanger sequencing was used to confirm the premature termination codon. Mutation frequency was assessed by measuring the rate of spontaneous resistance to streptomycin (Sm) as previously described, to confirm the acquisition of a mutator phenotype in WTR4mutS* and the restoration of hypermutability in mutSR4::p3-mutS. For this purpose, LB agar plates were supplemented with 30 µg/mL tetracycline (Tc) (LB-Tc) to maintain either the p3 empty vector or the p3::mutS plasmid in the respective strains (Supplementary Table 1).
Construction of a c-di-GMP P. aeruginosa reporter strain
A c-di-GMP reporter construct, consisting of a GFP coding sequence under the control of the pelA promoter, was integrated as a single copy downstream of the glmS chromosomal region of the different P. aeruginosa variants through tetraparental mating, as previously described38. This reporter system employs a monomeric superfolder green fluorescent protein (msf●gfp) driven by the pelA promoter, which is regulated by FleQ, a transcription factor that modulates pelA activity based on intracellular c-di-GMP levels77,78. At higher c-di-GMP concentrations, FleQ transitions from a repressor to an activator, thereby increasing GFP expression. While the reporter system provides a reliable qualitative measure of relative fluctuations in c-di-GMP levels, it does not establish a strictly linear relationship between fluorescence intensity and absolute c-di-GMP concentrations. Instead, it captures the shifts in c-di-GMP levels that underpin the phenotypic transitions between SCVs and parental-like morphotypes observed during the evolutionary cycles. Thus, GFP fluorescence serves as an in vivo indicator of intracellular c-di-GMP dynamics.
Briefly, E. coli PIR2 pBG-PelA (donor strain), E. coli DH5α-λpir pTnS-1 (strain leading transposase), E. coli pRK600 (helper strain)79, and each P. aeruginosa variant (recipient strains) were mixed in LB medium and streaked together on LB agar and incubated overnight at 37 °C. Positive P. aeruginosa clones for the chromosomal integration of PpelA-BCD2-msf●gfp were selected in agar cetrimide plates supplemented with gentamicin and confirmed by PCR80.
Single-cell analysis by flow cytometry
The expression of msf●gfp in the different variants of P. aeruginosa was evaluated by flow cytometry analysis using a Facscanto II cytometer (BD Bioscience, USA). The msf●gfp protein was excited at 480 nm and the fluorescence signal was measured at 520 ± 40 nm. P. aeruginosa variants tagged with PpelA-BCD2-msf●gfp (WT-PelA or mutS-PelA) were grown in M9 minimal medium supplemented with 0.4% w/v glucose for 24 h in static conditions. An aliquot of each culture was washed and resuspended in PBS. At least 3 x 10⁴ cells were counted per sample. The results were analyzed using the FlowJo v.10 software (FlowJo LLC, Ashland, OR, USA).
Statistical data analysis
Statistical analyses were performed using GraphPad Prism software (GraphPad Sofware, San Diego, California, USA). The data were analyzed by Student´s t-test or one-way ANOVA when appropriate, followed by Tukey’s post hoc test. In all cases, p-values less than or equal to 0.05 were considered statistically significant.
R software was employed for Linear Mixed-Effects with the R package lme481. In this analysis, the arcsine square root of conversion frequency proportions (SCV from cycles 1, 3, and 5) was treated as the response variable. Explanatory variables included cycles, strains (WT, mutS), and their two-way interactions (strain x cycle), as previously described82. Additionally, another model was examined to investigate the random effects associated with each evolutionary line, assuming a relationship between the proportion of SCV history and strain, cycle, and strain-cycle interactions (proportion SCV ~ strain + cycle + strain x cycle + 1|line). Graphic representation was constructed with proportion relative to cycle 1 of conversion with GraphPad Prism software. The data was analyzed using an ANOVA likelihood ratio test, with p-values ≤ 0.05 considered statistically significant.
Responses