Identification of pancreatic cancer-specific protease substrates for protease-dependent targeted delivery

Introduction
Proteases are enzymes that cleave peptide bonds and are classified based on their scissile bond residues into serine, cysteine, threonine, aspartic, glutamic, and metalloproteinases. In humans, 571 proteases have been identified [1], comprising approximately 3% of the protein-coding genes in the genome [2]. Proteases are involved in a myriad of biological processes starting during embryonic development and remain continuously involved in essential processes such as complement activation [3], food processing [4], blood coagulation [5], and apoptosis [6]. As the only irreversible posttranslational modification, proteolysis is tightly regulated, with substrate specificity being crucial for distinguishing the functions of proteases with similar catalytic abilities. Aberrant protease activity can consequently have deleterious effects and plays a pivotal role in a wide variety of pathologies, including cardiometabolic disease [7], musculoskeletal disorders [8], and cancer [9, 10].
In cancer, proteases are key players in tumor proliferation, invasion, and metastasis [11], prompting the development of protease-targeting drugs [12, 13]. However, many of these drugs have shown poor antitumor efficacy and substantial off-target effects in trials [14]. Interestingly, the tumor-specific expression of proteases can be harnessed for protease-responsive targeted drug delivery. Nanocarriers for targeted drug delivery aim to deliver cytotoxic agents precisely at tumor sites, enhancing drug concentration and mitigating off-target effects. In addition, targeted delivery vehicles may increase solubility for compounds that are typically poorly soluble in circulation [15]. A significant advantage of nanocarriers is the almost unlimited range of modifications that can be applied. As a consequence, the differential expression of proteases between healthy and tumor tissue can be exploited to develop protease-sensitive nanocarriers. Indeed, tumor-specific protease activity has been leveraged to improve targeting specificity and drug accumulation [16,17,18], tumor penetration [19, 20], uptake [20, 21], imaging [22], and spatiotemporally controllable drug release [20, 23,24,25,26,27,28,29]. The success of these nanocarriers relies on the specificity of the protease-responsive substrates used for targeting, as insufficient specificity can result in off-target effects.
Tumor-enriched proteases and their respective substrates incorporated on reported nanocarriers have so far been based on mRNA expression profiles and general knowledge of protease substrates. These therapies often lack cancer specificity, as they typically hinge on increased activity in tumors of matrix metalloprotease 2 (MMP2) and -9 (MMP9) [10], even though matrix metalloproteinases (MMPs) are widely expressed by monocytes [30], and MMP2 and MMP9 are also expressed in the healthy tissue of most organs [31], including bone marrow [32]. Pinpointing the role of individual proteases and their respective substrates is complicated by several factors: (1) proteases can recognize multiple substrates with different downstream functions [33], (2) many substrates have overlapping specificities to several proteases within [34] and between [34, 35] different classes of proteases, (3) discriminating between physiologically relevant and irrelevant cleavage events is difficult, (4) current empirical knowledge of substrate selectivity and specificity of proteases is limited [34, 36]. Enhancing tumor-specificity and consequent efficacy of protease-dependent nanocarriers could benefit from directly identifying truly cancer-specific substrates using an exhaustive, unbiased approach.
In prior work, we designed the first protease-responsive nanocarrier for the treatment of pancreatic ductal adenocarcinoma (PDAC) [23, 26, 29]. Using extensive bioinformatic analyses, ADAM9 was identified as PDAC-enriched protease. While demonstrating encouraging efficacy and safety profiles [29], our mesoporous silica-based ADAM9-responsive nanocarrier lacked anti-tumor efficacy in vivo. We hypothesized that unbiased identification of PDAC-specific protease substrates, independent from established protein expression profiles and a priori knowledge, could potentially yield more effective protease substrates. Therefore, we here employ an unbiased approach to identify protease substrates with superior selectivity and sensitivity for PDAC that could be employed in protease-responsive targeted therapies.
Results
Establishing a CLiPS protocol using ADAM9-responsive E. coli
An elegant technology to identify PDAC-specific protease substrates is Cellular Libraries of Peptide Substrates (CLiPS). CLiPS relies on the arabinose-induced expression of outer membrane protein X (OmpX) on the outer surface of E. coli (Fig. 1A, B) [37]. By fusing a (random) amino acid stretch (rNstretch) with a streptavidin-binding peptide (SAbp) to the OmpX sequence (OmpX-rNstretch- SAbp), the resulting protein, rNstretch-SAbp, is expressed and presented on the outer surface of the bacteria when exposed to arabinose. When OmpX-rNstretch-SAbp expressing bacteria are incubated with streptavidin-bound R-phycoerythrin (SAPE), bacteria are fluorescently labeled, which can be quantified using flow cytometry (FACS). Proteolytic cleavage of the rNstretch-SAbp leads to the detachment of SAPE from the bacterial surface, resulting in the loss of the fluorescent signal. Subsequently, bacteria can be selected by FACS sorting, contingent on the preservation or decline of the fluorescent signal. To simplify protocol optimization and proof-of-principle experiments, we first generated a uniform A Disintegrin and Metalloproteinase 9 (ADAM9)-responsive E. coli population (referred to as ADAM9 bacteria) in which the rNstretch consists of the ADAM9 substrate PLAQAVRSSK [38], which is efficiently cleaved by PDAC cells [23, 26, 38]. A schematic overview can be seen in Fig. 1.

A Unstimulated E. coli does not express outer membrane protein X (OmpX) and the rNstretch. B Incubation with arabinose evokes the production of OmpX and outer membrane exposure of rNstretch. C Overview of OmpX containing the ADAM9-substrate and streptavidin-binding sequences. D Incubation of ADAM9 bacteria with streptavidin-coupled phycoerythrin (SAPE) results in fluorescent labeling. E Incubation of fluorescent ADAM9 bacteria with ADAM9 and MMP9 cleaves the substrate with subsequent loss of fluorescent signal, measurable by fluorescence-activated cell sorting (FACS). F Incubation with thrombin, a protease unable to cleave the ADAM9 substrate, has no effect on the fluorescent signal of SAPE-labeled ADAM9 bacteria.
Using the bacteria expressing the ADAM9 substrate, we first assessed whether stimulation with arabinose induced the expression of OmpX-ADAM9-SAbp and subsequent ability for SAPE-labeling. Successful generation of ADAM9-responsive E. coli was confirmed by the presence of SAPE-positivity upon labeling, whereas this was absent in E. coli transformed with an empty backbone plasmid (pB33eCPX bacteria), acting as a negative labeling control (Supplemental Fig. 1A). Clone 2, showing the highest SAPE-positivity, was optimized for labeling and incubation with 20 µg/mL chloramphenicol, exposing to 0.04% arabinose for 1 h, and labeling with 20 mg/mL SAPE for 1 h resulted in the highest labeling efficiency (Supplemental Fig. 1B–D). We first proceeded to determine whether incubation of ADAM9 bacteria with rADAM9 resulted in loss of the SAPE signal. As shown in Fig. 2A, the incubation of bacteria with rADAM9 indeed resulted in a 50% decrease in the number of bacteria in the highest two quartiles of SAPE-signal as measured by FACS (see Supplemental Fig. 2 for gating strategy). In contrast, incubation with thrombin, a protease incapable of cleaving the ADAM9 substrate, did not reduce fluorescence. It is worth noting that the substrate used to test ADAM9 cleavage activity can also be cleaved by several related proteases, including MMP9 [38]. We, therefore, decided to use recombinant MMP9 and its known inhibitor S3304 to further validate that the observed loss of fluorescent signal is truly the result of proteolytic activity. Indeed, incubating ADAM9 bacteria with rMMP9 greatly reduced SAPE-positivity, which remained at similar levels as control and thrombin-treated bacteria upon the addition of S3304 (Fig. 2B).
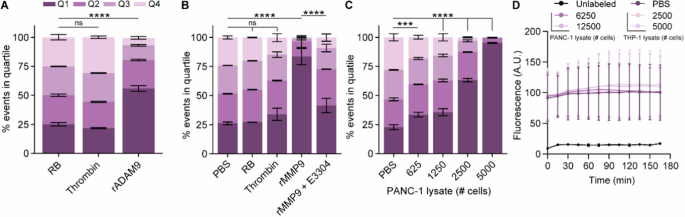
The influence of thrombin and rADAM9 (A), rMMP9 alone or in the presence of the MMP inhibitor E3304 (B), and PANC-1 lysate (C) Incubation of ADAM9 bacteria on the percentage of SAPE-positive bacteria. D Fluorescence levels of SAPE-labeled ADAM9 bacteria upon PANC-1 and THP-1 lysate incubation under static conditions as measured by Biotek over time. Data are shown as the mean ± SD of one representative experiment with n = 2, except for (A) and (D), which represent two experiments with n = 2. Two-way ANOVA was used to compare % of events in Q1. Levels of significance: ns not significant, *** p < 0.001, **** p < 0.0001.
Next, we determined whether PDAC lysates, known to contain ADAM9-substrate cleaving proteases [26], also diminish SAPE positivity. As evident from Fig. 2C, incubation of ADAM9 bacteria with PANC-1 lysate resulted in a dose-dependent reduction in SAPE-positive bacteria, wherein almost no SAPE-positive bacteria were recovered at the highest PANC-1 lysate concentration—signifying near-complete ADAM9 substrate cleavage. To ensure that the observed loss of fluorescence was due to protease cleavage rather than (for instance) SAPE quenching by components present in lysates, we incubated ADAM9 bacteria with PANC-1 and THP-1 lysates, a leukemia cell line, and monitored the fluorescence levels over time under static conditions (i.e., without washing away the possibly cleaved SAPE molecules). As expected, fluorescence levels remained stable over time (Fig. 2D), confirming that the loss of fluorescence following PANC-1 lysate incubation was a result of substrate cleavage. Overall, these proof of principle experiments provide compelling evidence that our workup for protease activity analysis using CLiPS is effective and that the loss of fluorescent signal can be attributed to specific proteolytic activity.
Proof of CLiPS library screening concept
After having established a functional system to assess lysate-mediated substrate cleavage, we set out to generate a CLiPS Library comprising a population of E. coli representing high substrate complexity. Hereto, the ADAM9-substrate present on ADAM9 bacteria was replaced by a random 6 amino acid stretch (Fig. 3A) which resulted in a CLiPS Library with a projected complexity of approximately 107 different substrates. Labeling the CLiPS Library with the optimized protocol for the ADAM9 bacteria resulted in comparably effective labeling efficiency (Supplemental Fig. 1E). Given that the CLiPS Library contains 107 different substrates, incubation with a single protease should not substantially reduce the number of SAPE-positive bacteria. Indeed, incubation with rMMP9 or thrombin did not reduce the distribution of SAPE-positive bacteria as compared to control-treated bacteria (Fig. 3B). On the other hand, incubation with PANC-1 lysate, which contains a plethora of proteases, resulted in a decrease in SAPE-positivity (Fig. 3C). Importantly, combined incubation of the CLiPS Library with PANC-1 and THP-1 lysates resulted in a larger decrease in SAPE positivity than anticipated based on cleavage by individual lysates (Fig. 3D), indicating that PANC-1 and THP-1 cells cleave, at least to some extent, different substrates. Interestingly, increasing the lysate concentration above a certain threshold did not further decrease the amount of SAPE-positive bacteria, indicative that—as expected—not all substrates can be cleaved by PANC-1 and THP-1 lysates. This result is important as it underscores that SAPE-reduction is protease-specific, validating our strategy.
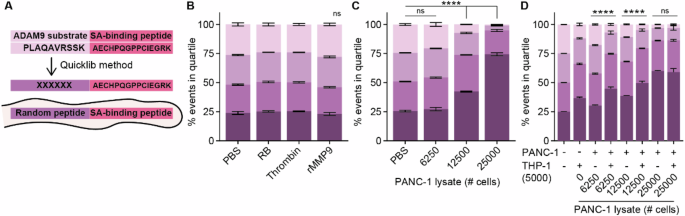
A Schematic overview of the generation of the CLiPS Library by replacing the ADAM9-responsive substrate PLAQAVRSSK present in ADAM9 bacteria with a random stretch of 6 amino acids. The effect of thrombin and rMMP9 (B), PANC-1 lysate (C), and combined PANC-1 and THP-1 lysate (D) incubation of the CLiPS Library on the percentage of SAPE-positive bacteria. Data are shown as the mean +/− SD of one representative experiment with n = 2. Two-way ANOVA was used to compare % of events in Q1. Levels of significance: ns = not significant, **** p < 0.0001.
Having established the complexity of the CLiPS Library and the feasibility of our approach, we next aimed to identify PDAC-specific substrates. To this end, we set out to enrich the CLiPS Library for bacteria expressing substrates specifically cleaved by PDAC cells. A schematic overview of the sequential sorting steps is provided in Fig. 4A and Supplemental Fig. 2). In short, the CLiPS Library was enriched twice to remove peptide substrates that cannot be fluorescently labeled, e.g., by containing a premature stop codon or structural hindrance of the fluorescent binding sequence. This population is called Enrich-2. Next, the resulting Enrich-2 CLiPS Library underwent three sequential incubation rounds with PANC- 1 lysate. Given that the success of systemically administered targeted delivery depends on the absence of substrate recognition in the bloodstream, the Enrich-2 CLiPS Library was also treated with blood lysate as a control. We aimed to represent the complexity of the CLiPS Library tenfold and performed the sorting experiments with 1 × 10⁸ bacteria. This increase in scale prompted us to optimize the labeling protocol once more (as outlined in the method section and shown in Supplemental Fig. 1E–H). The election of SAPE-positive bacteria in Enrich-1 and -2 increased labeling efficacy, as evident from an increased proportion of SAPE-positive bacteria in subsequent steps (Fig. 4B, D).
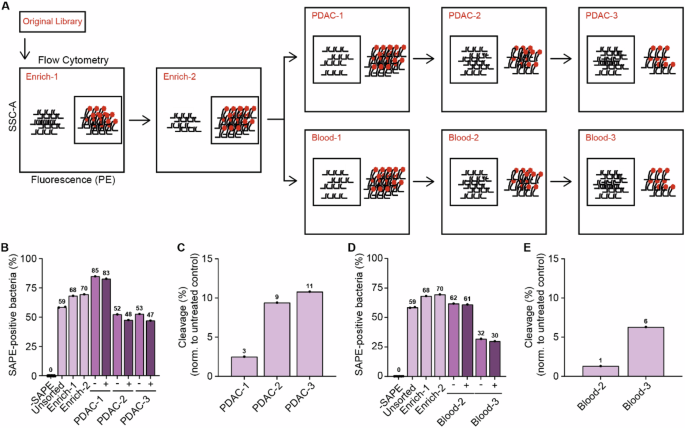
A Schematic overview of the sorting process. B The percentage of SAPE-positive bacteria when untreated (Untreated) SAPE-positive cells are selected (Enrich-1, Enrich-2) and when SAPE-negative bacteria are selected after consecutive incubation with PANC-1 lysate (PDAC-1, PDAC-2, PDAC-3 representing the consecutive rounds of selection). (−). − represents control labeling (PBS), + incubation with PANC-1 lysate. C Normalized reduction of SAPE-positive bacteria after sequential rounds of incubation with PANC-1 lysate (PDAC-1, PDAC-2, PDAC -3 representing the consecutive rounds of selection). D The percentage of SAPE-positive bacteria when untreated SAPE-positive cells are selected (Enrich-1, Enrich-2) and when SAPE-negative bacteria are selected after consecutive incubation with blood lysate (Blood-2, Blood-3). − represents control labeling (PBS), + incubation with blood lysate. E Normalized reduction of SAPE-positive bacteria after sequential rounds of incubation with blood lysate. Blood-1 is missing in panels D and E due to a technical error during data acquisition.
Inversely, sequential incubation with PANC-1 or blood lysate decreased the percentage of SAPE-positive bacteria. Importantly, in all lysate-treated samples the percentage of SAPE-positive bacteria was decreased compared to control-treated bacteria, indicating successful substrate cleavage. Normalization of the percentage of SAPE-positive bacteria in PANC-1 (Fig. 4C) and blood (Fig. 4E) lysate incubation to their corresponding PBS-treated controls revealed an increase in the percentage of cleaved bacteria over the respective sorting rounds, illustrating the enrichment of cleavable substrates during selection. These results collectively demonstrate the enrichment of PDAC- and blood-specific substrates. The reliability of the selection and sorting process was ensured by the observation of consistent sorting recovery rates (Supplemental Fig. 3A) and similar concentrations of bacteria in stocks following the outgrowth of sorted bacteria overnight (Supplemental Fig. 3B) throughout the experiment.
Identification of PDAC-specific peptide substrates using next-generation sequencing (NGS)
After the final selection round, plasmids were isolated for all sorting steps and approximately 99 base pairs before and 63 after the 18 base pair variable protease-responsive region were sequenced. After Enrich-2, the CLiPS Library was found to contain 7.15 × 10⁶ uniquely matched DNA sequences, corresponding to 6.22 × 10⁶ uniquely matched peptide sequences. As shown in Fig. 5A–D, the ratio of uniquely matched DNA and peptide sequences decreased with every consecutive selection round after PANC-1 or blood lysate incubation, indicating successful enrichment of cleavable peptide sequences. To improve readability, peptide sequences will hereafter be referred to as substrates, and PANC-1 and whole blood cell lysates as PDAC- and blood lysates, respectively. To test the technical reproducibility of the NGS library preparation, we repeated the preparation and sequencing process for sample PDAC-3. As evident from Supplemental Fig. 4, the number of unique DNA (S4A) and substrate (S4B) sequences was comparable between sequencing runs. More importantly, a direct comparison of the abundance of individual substrate sequences in Run 1 and 2 showed a strong statistical correlation of p < 0.0001 for the 700.000 substrates with the most reads, all substrates with ≥100 and ≥500 reads, and top 1000, 250, and 100 enriched substrates (Supplemental Fig. 4C).
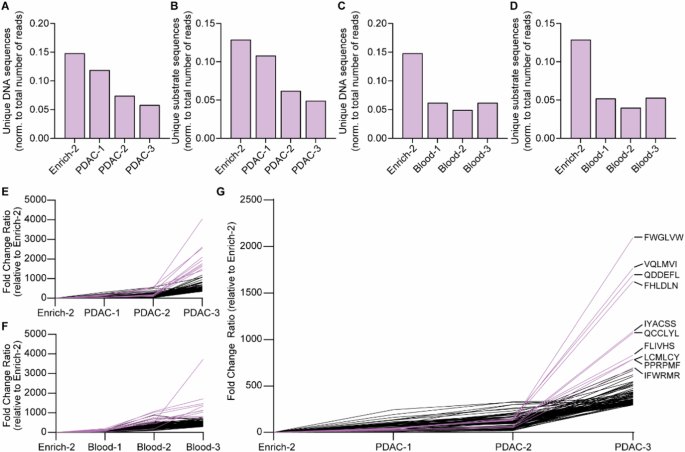
A Normalized count of unique DNA sequences after sequential rounds of incubation with PDAC lysate. B Normalized count of unique substrate sequences after sequential rounds of incubation with PDAC lysate. C Normalized count of unique DNA sequences after sequential rounds of incubation with Blood lysate. D Normalized counts of unique substrate sequences after sequential rounds of incubation with Blood lysate. E Fold change of top 100 enriched substrates during sequential incubation with PDAC lysate compared to Enrich-2. F Fold change of top 100 enriched substrates during sequential incubation with Blood lysate compared to Enrich-2. G Fold change of top 100 enriched substrates after removal of all substrates with a fold increase of ≥10 in Blood-3 from PDAC-3. Enrich-2 constitutes the library before the start of the enrichment experiments with PANC1 or blood lysates. Pink lines in figures E–G resemble the 10 most enriched hits.
Already after a single round of substrate enrichment for PDAC lysate, nearly 70.000 substrate sequences were considerably enriched (≥10-fold), with 97 sequences enriched by ≥100-fold (data not shown). Enrichment levels further increased after the second and third treatment rounds, with 104.421 substrates enriched by ≥10-fold and 37 substrates demonstrating 500-fold enrichment (Table 1). Following one round of blood lysate incubation, 40.000 substrates were enriched by ≥10-fold, with 56 showing ≥100-fold increase (data not shown), 57% less compared to one round of PDAC lysate incubation. After the final round of enrichment, 64,053 substrates were enriched by ≥10 fold, with 27 substrates exhibiting more than 500-fold enrichment (Table 2). Importantly, PDAC- and blood lysate incubation resulted in the identification of numerous different substrates, confirming distinct substrate specificities. Visualization of the sequential enrichment clearly demonstrates a gradual enrichment of the top 100 hits over time (PANC-1; Fig. 5E, Blood; 5F). Interestingly, the top 10 hits after both PDAC- and blood lysate incubation show markedly increased enrichment compared to the remaining top 100 hits.
Finally, we filtered the substrates enriched by PDAC lysate for substrates enriched by blood to identify genuine PDAC-specific substrate sequences (Table 3), from here on referred to as Filtered PDAC. As expected, the fold change of the top 100 enriched substrate sequences from Filtered PDAC revealed similar gradual enrichment over the course of sequential incubation with lysates (Fig. 5G), comparable to PDAC-3 (Fig. 5E) and Blood-3 (Fig. 5F). However, a 40% decrease in average fold change of the top 10 hits could be observed in Filtered PDAC-3 compared to PDAC-3, indicating the removal of non-PDAC specific hits. Direct comparison of the substrate sequences making up the top 10, 25, and 100 enriched substrates before and after filtering revealed the removal of 60, 52, and 37% of the substrates, respectively. Comparison of the ratio of abundance in the start library with the fold increase for the top 15 hits did not result in a statistical correlation, proving that substrate selection is cleavage-initiated and not driven by abundance (Supplemental Fig. 5).
Determination of amino acid composition of enriched substrates
To gain more knowledge into the amino acid preference of PDAC- and blood lysate we determined the amino acid composition of the identified enriched substrates. Hereto, we visualized and compared the ratio of amino acids per position of the substrate before enrichment (Enrich-2; Fig. 6A, D) with that following enrichment (PDAC; Fig. 6B and blood; Fig. 6E, intermediate steps shown in Supplemental Fig. 6). After PDAC enrichment (Fig. 6C), we observed a preference for substrates containing cysteine, phenylalanine, tryptophan and tyrosine, whereas lysine, proline and glycine seem most unfavorable for PDAC lysate cleavage. For proteases present in the blood, only cysteine is significantly enriched compared to Enrich-2, while the abundance of methionine is most markedly reduced (Fig. 6F). Comparison of the enriched amino acids after PDAC cleavage to blood cleavage revealed that cysteine, although also the most enriched in Blood-3, showed even greater enrichment in PDAC compared to blood (Fig. 6G). Additionally, aspartic acid, glutamic acid, and phenylalanine are more enriched in PDAC, while lysine, serine, and asparagine are more depleted. An interesting pattern emerges when the amino acids are grouped based on their hydrophobic, hydrophilic, aliphatic, aromatic, uncharged, acidic, and basic properties. After PDAC selection, the hydrophobic aromatic- (i.e., phenylalanine, tryptophan, and tyrosine) and hydrophilic and acidic amino acids (i.e., aspartic acid and glutamic acid) are consistently more abundant (Fig. 6G). Conversely, the hydrophilic and basic amino acids arginine, histidine, and lysine are scarcer in PDAC compared to blood (Fig. 6G). Taken together, these data indicate that proteases in both PDAC and blood lysate exhibit a preference for cysteine residues, with this preference being particularly pronounced in PDAC. On the other hand, PDAC lysate clearly demonstrates a preference for hydrophobic aromatic and hydrophilic basic amino acids as compared to blood lysate.
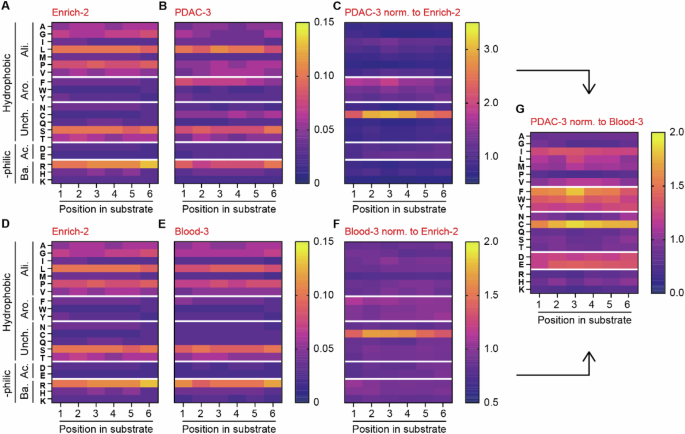
A, D Amino acid distribution across substrates in the CLiPS Library at the start of the sorting experiment (Enrich-2). B Amino acid distribution after three incubation rounds with PANC-1 lysate (PDAC-3). C Change in amino acid ratio in PDAC-3 normalized to Enrich-2. E Amino acid distribution after three incubation rounds with blood lysate (Blood-3). F Change in the amino acid ratio in Blood-3 normalized to Enrich-2. G Comparison of amino acid ratio between normalized PDAC-3 and Blood-3 samples. Arrows indicate sample comparison.
Validation of top 15 enriched substrates
To validate the CLiPS data, we next incubated fluorescence resonance energy transfer (FRET)- peptides corresponding to the top 15 substrates from filtered PDAC-3 with PANC-1 cell lysate and show that 13 of the 15 substrates are indeed cleaved (Fig. 7A). Of note, all 13 substrates cleaved by PANC-1 lysate were also cleaved by lysates from four additional PDAC cell lines (Fig. 7B and Supplemental Fig. 7A–M) suggesting the substrates are generally applicable in PDAC. It is noteworthy, that individual PDAC cell lines exhibit varying efficacy for the substrates, potentially due to differential protease expression among PDAC cell lines or differences in protein content between the lysates (Supplemental Fig. 8A, B). Indeed, protein content and cleavage kinetics are strongly correlated, with a high correlation coefficient of 0.9921 when combining all tested peptides (p = 0.0003; Supplemental Fig. 9A) and individually (Supplemental Fig. 9B–I). Finally, we assessed the PDAC-specificity of the 7 substrates that showed an average fold increase of >3 in the PDAC cell lysates by incubating the FRET-peptides with lysates from healthy murine liver, lung, colon, kidney, and pancreas, as well as human blood (Fig. 7C–H). To assess potential superiority with respect to PDAC specificity of the identified substrates over the previously identified Calpain 2 (CAPN2)-responsive substrate -that showed significant preclinical potential as a proteolytic activity-based gatekeeper [29], we normalized the fold increase by PDAC cell lysates (Fig. 7I) to the average fold increase by blood/organs (Fig. 7J). Interestingly, 6 of the substrates were found to be superior over CAPN2, as evident from a decreased ratio between cell lines and organs (Fig. 7K).
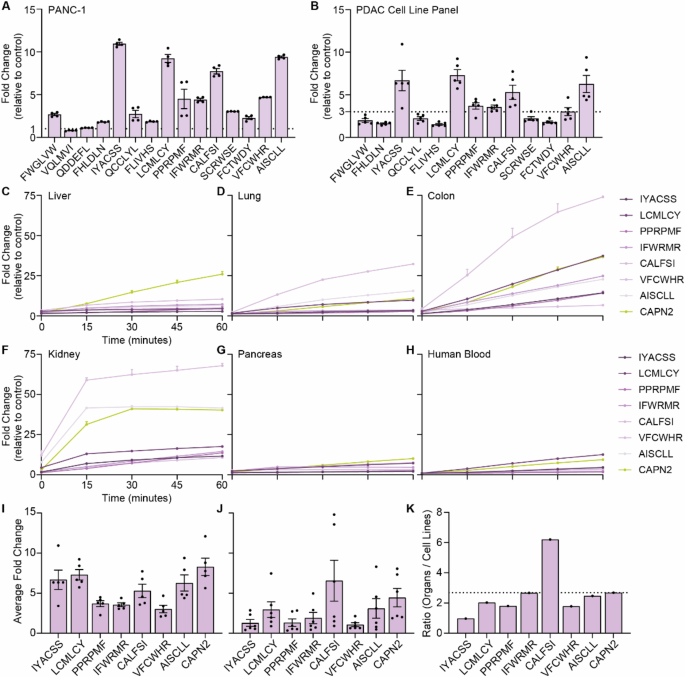
A Fold change in fluorescent signal of FRET-peptides after 1 h of incubation with PANC-1 cell lysate versus incubation PBS (control treatment). The dotted line at y = 1 represents the absence of substrate cleavage. Data depict the mean ± SEM of two representative experiments with n = 2. B Fold change in fluorescence of selected substrates upon incubation with lysates from a PDAC cell line panel consisting of BxPC-3, Capan-1, Capan-2, MIA PaCa-2, and PANC-1. The dotted line at y = 3 represents cut- off point. Data depict the mean ± SEM of two representative experiments with n = 2. Cleavage kinetics of substrates with an average of >3-fold change in PDAC panel, and CAPN2-responsive substrate upon incubation with murine liver (C), lung (D), colon (E), kidney (F), pancreas (G), and human whole blood (H) cell lysate. Data are shown as the mean ± SEM of one representative experiment with n = 2. Average fold change of selected peptides after PDAC cell line panel (I) and organ (J) incubation. Data are shown as the mean ± SEM of two representative experiments with n = 2. All data are normalized to corresponding PBS-treated FRET-peptides. K Normalization of the average fold change of organ incubation to average fold change of PDAC cell line incubation. The dotted line represents the ratio of CAPN2-responsive substrate.
One substrate, termed ‘IYACSS’, showed a ratio of 0.97, indicating more efficient cleavage by PDAC cell lines over healthy organs and blood. To estimate the potential of the ‘IYACSS’ substrate in relation to previously developed protease-responsive nanocarriers, we analyzed the enrichment of substrates incorporated on protease-responsive nanocarriers in our library screen. Among the studies reviewed, two did not specify the substrate, while one employed human serum albumin as an MMP2-responsive moiety, presenting challenges due to multiple cleavage sites. Additionally, four studies utilized gelatin, a complex mixture of protein fragments, hindering substrate characterization. Of the CAPN2-reponsive substrate ‘SGAGLPLFAARPGANS’ no substrates were present in the library. Nanoparticles responsive to MMP2 contained the substrates ‘PLGLAG’ [19, 21, 39] ‘PLGVR’ [22, 27] and ‘GPLGIAGQ’ [40,41,42], MMP9-responsive nanoparticles ‘PLGLAG’ [39], ‘RSWMGLP’ [24, 28] and GGPLGVRGK [43] and ADAM9-responsive nanoparticles ‘SPLAQAVRSSK’ [23, 26], with amino acids in bold indicating the cleavage site. Interestingly, among the 40 substrates in the library containing these cleavage motifs, only one -PLGVRA- was enriched after PDAC selection. However, its fold increase of 1.19 was insignificant compared to the substantial 1084-fold increase observed for the ‘IYACSS’ substrate. This result suggests that the here identified substrates may hold greater potential for PDAC treatment than the previously described substrates, but future pre-clinical animal models should prove or refute this notion.
Discussion
The success of protease-responsive targeted delivery approaches for the treatment of cancer depends on the specificity and sensitivity of the protease for its substrate incorporated into the nanocarrier. To date, nanocarriers responsive to MMP2 [16, 17, 19,20,21,22, 25, 27, 39,40,41,42, 44,45,46], MMP9 [24, 28, 39, 43, 47], ADAM9 [23, 26], and CAPN2 [29] have been designed based on their increased expression in tumors compared to healthy tissue [10, 23, 29], and generally demonstrated promising antitumor effects, limited off-target toxicity and good tolerability. However, incomplete understanding of dysregulated protease activity in tumors and the rudimentary identification of specific substrates for these proteases may hinder the full potential of protease-responsive therapies. For example, ADAM9-responsive MSNs, designed based on increased ADAM9 mRNA expression in PDAC tumors with published ADAM9-specific substrates, showed promising in vitro results but lacked antitumor efficacy in vivo [23, 26]. This could well be due to a discrepancy between ADAM9 mRNA expression levels and ADAM9 activity in tumors, for instance, due to the simultaneous increase of ADAM9 inhibitors in tumors. Alternatively, elevated mRNA levels do not necessarily predict increased protein levels which is evident from genome-wide correlation studies that show poor correlation between mRNA and protein expression levels [48, 49]. Identification of substrates based on proteolytic activity instead of mRNA expression levels within tumors could circumvent this major limitation upon which we here set out to identify PDAC-specific substrates by employing an unbiased CLiPS approach in which around 10 million substrates were screened.
Chemotherapeutics are typically administered intravenously, with leukopenia being a major complication for a significant proportion of treated patients. To avoid off-target cytotoxicity of protease-responsive nanocarriers, which are—in general—also administered intravenously, it is crucial to identify substrates that are insensitive to proteases produced by or present in white blood cells. In addition to selecting PDAC-responsive substrates, we identified substrates cleaved by whole blood lysates and subsequently excluded these from the list of PDAC-enriched peptides to obtain a set of genuine PDAC-specific substrates for intravenous administration. Notably, chemotherapeutics can also be administered orally, intratumorally, or intraperitoneally, and in such cases, excluding whole blood-responsive substrates would not be necessary. In these scenarios, substrates most efficiently cleaved by PDAC lysates (shown in Table 1) may be optimal.
Following the unbiased identification of PDAC-responsive substrates using CLiPS, we validated the top 15 hits using FRET-peptides containing the identified substrates. PANC-1 lysate, used in the CLiPS experiments to identify PDAC-enriched substrates, efficiently cleaved 13 of the 15 selected substrates, confirming the validity of the CLiPS-identified substrates. The lack of cleavage observed in two FRET-peptides is probably due to the absence of amino acids flanking the cleavage site, which are present in the OmpX fusion protein utilized in CLiPS but missing in the FRET-peptides, underscoring the requirement of both upstream and downstream amino acids for proteolysis [50]. Alternatively, proteolytic activity may depend on the tertiary structure of the protein / substrate to be cleaved [51], and the tertiary structure of the OmpX-fusion protein employed in CLiPS may not be replicated by the small FRET-peptides. Importantly, all substrates cleaved by PANC-1 lysate were also cleaved by lysates from other PDAC cell lines, underscoring the general PDAC-sensitivity of the peptides and suggesting that these substrates are ideal candidates to pursue in PDAC research.
The identified PDAC-responsive substrates offer promise for their specificity, potentially reducing cleavage by non-cancerous cells and possibly providing a safer alternative to the CAPN2-responsive substrate, which failed to prevent leukopenia in vivo with paclitaxel-loaded CAPN2-MSN administration [29]. To assess specificity, we analyzed a selection of FRET-peptides with whole blood and (murine) organ lysates. Importantly, whole blood lysates from similar cell numbers (i.e., 1 × 10⁶ cells), as used for PDAC cell lysates, did not cleave any of the FRET-peptides (data not shown). Using increasing protein concentrations for comparison (Supplemental Figure 8B), we found that the CAPN2 substrate and the in this study identified ‘CALFSI’ substrate showed the lowest PDAC-specificity. Other substrates demonstrated enhanced PDAC-specificity compared to the CAPN2 substrate, suggesting that the preclinical efficacy of our previously described protease-responsive nanocarrier [29] could be further enhanced by substituting the CAPN2 substrate with one of these substrates. Protease-responsive nanocarriers are typically developed around MMP2 and/or MMP9 activity. Studies targeting PDAC [40, 43], glioblastoma [27], and lung- [28], breast [16, 21], and liver [20] cancer have used the same substrates that are cleaved by MMP2 and/or MMP9. However, in our library screen only one of the assessed MMP2- and MMP-responsive substrates was mildly enriched (PLGVRA; fold change 1.19). This, combined with the observation that multiple substrates (e.g., PLGLAG and PLGVR) are cleaved by both MMP2 and MMP9, underscores the importance of substrate specificity. Consequently, targeting PDAC with MMP-responsive substrates may not be the most promising approach. The implication that the here identified substrates hold greater promise in future clinical applications regarding PDAC should, however, be further assessed in preclinical in vivo experiments. Only in such models could one fully appreciate anti-tumor activity in conjunction with clinically relevant side effects and such experiments would thus be essential to assess whether the here identified substrates are superior over the previously used CAPN2 substrate. Of note, protease expression may vary in a context/tumor-dependent manner and multiple models should thus be employed to select the optimal substrate to pursue in a clinical setting.
After obtaining a list of substrates cleaved by PDAC cell lysate using CLiPS, we investigated the possibility of identifying a PDAC consensus cleavage site. Although no single consensus site emerged, likely due to the presence of multiple proteases with varying substrate specificities in the cell lysates, our analysis revealed an enrichment for cysteine residues within the cleaved substrates (Fig. 6). This finding is notable as proteases that cleave near cysteine residues are not well characterized, although caspases and granzymes are known to target cysteine-containing substrates. Interestingly, 5 out of the top 7 candidates contain cysteine residues, possibly giving a starting point to identify the scissile bond, or the proteases involved.
While our experimental model was extensively validated and yielded a comprehensive list of PDAC-responsive substrates, it may not have captured all substrates cleaved by PDAC cells in vivo. We lysed PDAC cells via sonication, which, despite generating lysates with significant proteolytic activity, could have impaired the function of some proteases. Additionally, lysis in PBS at a neutral pH (7.4) may have reduced the activity of acidic (aspartic) and alkaline (metallo) proteases, which exhibit optimal activity at pH ranges of 2–5 and 8–11, respectively. Having said that, despite the optimal activity of cathepsins at low pH, cathepsin S, D, and K have been shown to display kinetic activity at a pH between 6.5 and 7.4 [52,53,54], suggesting these proteases would still show proteolytic activity in our lysates. This is important as several cathepsins are highly expressed in PDAC [23, 55, 56] and play significant roles in cancer progression [56]. The absence of essential cofactors such as calcium and zinc in our lysis buffer could also have reduced activity and consequent substrate cleavage of some proteases.
In conclusion, using an unbiased CLiPS-based approach, we identified protease substrates with high selectivity and sensitivity for PDAC that could be employed in protease-dependent targeted strategies in the setting of PDAC.
Methods
Generation ADAM9-responsive E. coli and CLiPS Library
To construct the pB33eCPX-ADAM9-SAbp plasmid, we introduced a streptavidin-binding peptide (SAbp) with the amino acid sequence AECHPQGPPCIEGRK [57] fused to an ADAM9 cleavage sequence (ADAM9seq) with the amino acid sequence PLAQAVRSSK [38] into pB33eCPX (Addgene #23336; AddGene, Watertown, MA, USA [58]). To this end, the KpnI-HindIII fragment of pB33eCPX was replaced by a GeneArt Strings DNA fragment (Thermo Fisher Scientific, Waltham, MA, USA) consisting of a modified KpnI-HindIII fragment containing the GCAGAATGCCATCCGCAGGGCCCGCCGTGCATTGAAGGTCGTAAAGCGGCGCCGCTGGCGCAGGCGGTGCGCAGCAGCAAA SAbp-ADAM9seq coding sequence (with the streptavidin-binding peptide in underscore, a short spacer in bold, and the ADAM9-responsive cleavage site in italic) immediately downstream of the ggccagtctggccag sequence coding for the flexible GQSGQ linker adjacent to the OmpX signal peptide. To generate the CLiPS Library containing six random amino acids fused to SAbp (pB33eCPX-random-SAbp), the ADAM9seq from pB33eCPX-ADAM9-SAbp was replaced by 6 NNK codons potentially coding for all amino acids and the amber stop codon using a pool of GeneArt Strings DNA fragments. pB33eCPX-ADAM9-SAbp and pB33eCPX-random-SAbp plasmids were electroporated into electro-competent TOP10F yielding 1.4 × 10⁷ transformants that were collected in LB broth supplemented with 25% glycerol before storage at −80 °C in a concentration of approximately 1 × 10⁸ bacteria per µl. For the remainder of the paper, the ADAM9-responsive bacteria will be referred to as ADAM9 bacteria.
Validation of ADAM9-responsive bacteria and CLiPS Library
Successful generation of ADAM9 bacteria and the CLiPS Library was confirmed by BigDye Terminator analysis. Plasmid DNA was isolated using the NucleoBond Xtra Midi kit (BIOKE, Leiden, The Netherlands) following the manufacturer’s protocol. The precipitated plasmid DNA was washed twice by adding 70% ethanol and centrifugation at 14,000 rpm for 15 min at RT. After air-drying, the DNA was dissolved in 100 µL RNase-free water and stored at −20 °C. Next, 1 µg plasmid DNA was used in BigDye terminator 3.1 (Applied Biosystems, Thermo Fisher Scientific) Sanger sequencing reaction using the forward primer 5’-TCGTCGGCAGCGTCAGATGTGTATAAGAGACAGGTTCTGGCTTTCACCGCAG-3’.
Bacterial labeling optimization
To optimize the labeling and cleavage protocol, ADAM9 bacteria were grown overnight in 5 mL LB. The following morning, this culture was diluted 100-fold and grown for 1 h at 37 °C after which the bacteria were induced with varying concentrations of arabinose for various time points. Next, the bacteria were reconstituted to 109 bacteria/mL, and 104–107 bacteria were subsequently incubated with streptavidin bound R-phycoerythrin (SAPE; 1.25–20 mg/mL, Thermo Fisher Scientific) for either 30 min, 1 or 2 h under static conditions at room temperature. Finally, the bacteria were washed twice with ice-cold PBS, and the SAPE signal was measured by BD FACSCanto II (BD Biosciences, Franklin Lakes, NJ, USA) at 585 nM. Similar experiments were performed after the generation of the CLiPS Library. All generated data were analyzed using FLOWJO v10 (FlowJo LLC). The gating strategy to discriminate SAPE-positive bacteria from SAPE-negative bacteria is shown in Supplemental Fig. 10.
Cell culture
Human PANC-1, BxPC-3, MIA PaCa-2, Capan-1, and Capan-2 cells (all ATCC, Manassas, VA, USA) were grown in DMEM (Lonza, Basel, Switzerland) supplemented with 10% fetal calf serum, 100 units/mL penicillin and 500 µg/mL streptomycin (all Lonza). THP-1 cells (ATCC) were cultured in RPMI (Lonza) supplemented with 10% fetal calf serum, 100 units/mL penicillin, and 500 µg/mL streptomycin. Cells were cultured in a humidified incubator at 37 °C and 5% CO2. Monthly mycoplasma tests were performed on all cell lines, and their identity was confirmed yearly by STR profiling.
Preparation lysates
For CLiPS experiments, 2.5 × 10⁶ PANC-1 (ATCC, Manassas, VA, USA) or 2.5 × 10⁶ whole blood cells were used for lysate preparation. Whole blood was collected from a single healthy volunteer (following institutional standard operating protocol and under the approval of the Medical Ethics Review Committee) in lithium-heparin-coated blood tubes (BD, Franklin Lakes, NJ, USA). Next, cells were pelleted by centrifugation at 800 rpm for 3 min, the supernatant was discarded, and cells were resuspended in 1 mL ice-cold PBS. Cells (PDAC or the resuspended blood cells) were lysed on ice by needle sonication using a Vibra-Cell X-130 (Sonic & Materials Inc, CT, Newtown, USA) with as protocol 5 rounds of 5 s pulses at 30% amplitude followed by 5 s of pause. To remove remaining cell debris, the lysed samples were spun down at 600 rpm for 3 min, and the supernatant was aliquoted in 200 µL portions and stored at −20 °C. For FRET-peptide cleavage experiments, 1 × 10⁶ cells/mL were lysed as described above. Freshly excised murine lung, liver, kidney, and colon were freeze-dried using liquid nitrogen, subsequently frozen using dry ice, and homogenized in 300 µL PBS using TissueLyser LT (Qiagen, Venlo, The Netherlands) at 50 Hz for 2 minutes. Next, homogenized tissues were centrifuged at 800 rpm for 3 min, the supernatant was transferred to a new tube, and the protein concentration was measured using the Nanodrop 2000 (Thermo Fisher Scientific).
Cleavage assays of ADAM9 bacteria and CLiPS library
Overnight cultures of ADAM9- or CLiPS Library bacteria were subcultured by dilution into fresh LB (1:100) and subsequently grown for 45 min at 37 °C before adding 0.04% arabinose. After 1 hour of arabinose induction, bacteria were labeled with a final concentration of 20 mg/mL SAPE for 1 h. Next, 107 bacteria resuspended in 10 µl PBS were incubated with either 10 µL PBS, reaction buffer (50 mM Tris-HCl, 20 mM NaCl, 2 mM CaCl2 and 10 µM ZnCl2 in PBS), or a final concentration of 75 nM thrombin (Sigma-Aldrich, St. Louis, MO, USA), 10 nM rADAM9 (R&D Systems, Minneapolis, MN, USA), 200 nM rMMP9 (Sigma-Aldrich), and 200 nM rMMP9 + 1 µM S3304 or dilutions of PANC-1 and THP-1 lysates. After 3 h, the bacteria were washed twice with PBS, resuspended in 100 µL PBS, and analyzed on a FACS Canto II using unlabeled bacteria as negative control. All generated data were analyzed using FLOWJO v10 (FlowJo LLC). The gating strategy to discriminate SAPE-positive bacteria from SAPE-negative bacteria is shown in Supplemental Fig. 11.
CLiPS library sorting experiments and culture processing
As we aimed to include the complexity of the CLiPS Library tenfold, we performed the sorting experiments with 1 × 10⁸ bacteria. This constitutes a ten-fold increase of bacteria to label compared to the cleavage experiments to validate the CLiPS protocol, therefore we performed one more round of labeling optimization. Hereto, we found that SAPE-labeling did not improve when increasing the amount of SAPE (Supplemental Fig. 1F). However, it prompted us to increase the amount of arabinose to 0.12% and to extend the incubation period to 2 h (Supplemental Fig. 1G, H). To streamline the sorting process, we first assessed the impact of sorting speed, sheath fluid, and centrifugation on experimental success. Our findings indicate that increasing the sorting speed and shortening the sorting procedure, thereby reducing the exposure time of sorted bacteria to sheath fluid (i.e., sorting fluid), did not affect sorting efficiency (Supplemental Fig. 1I). As sorting takes multiple hours, the incubation time in sheath fluid differs among sorted bacteria; however, we observed no detrimental effects on cell viability across different exposure times to sheath fluid (Supplemental Fig. 1J). Sorting a high number of bacteria, up to 100 million, yields a substantial volume of bacteria in sheath fluid, ideally minimized to facilitate outgrowth in smaller bacteria cultures. Importantly, we observed a near-complete loss of bacterial outgrowth when centrifuging the collected bacteria in sheath fluid prior to initiating a new culture (Supplemental Fig. 4K). To obviate the need for centrifugation post-sorting, we explored the dilution of sheath fluid in an LB medium to support bacterial outgrowth (Supplemental Fig. 4L). To eliminate substrates from the CLiPS Library that express incorrect substrate and binding peptides (e.g., stop codons or sequences containing frame-shift mutations) the labeled CLiPS Library was first sorted twice without any incubation after which SAPE positive bacteria were selected, the resulting cultures are termed Enrich-1 and Enrich-2. Unlabeled bacteria were used to set the positive sorting gates. Next, the CLiPS Library resulting from Enrich-2 was incubated with 200 µL lysates from PANC-1 or human whole blood cells using a sequential incubation series as shown in Fig. 3. All sorting rounds were performed on a SH800 Cell Sorter (Sony Biotechnology, San Jose, CA, USA) using a 70 µm chip at 8000–10,000 events per second. Before sorting, the SH800 and sorting chip were calibrated using Sony SH800 setup beads (Sony Biotechnology). All generated data were analyzed using FLOWJO v10 (FlowJo LLC) similar as described for the protocol optimization experiments. After sorting, 10 µL of the collected SAPE-positive bacteria were plated to estimate recovery rates, and the remaining bacteria were grown overnight in 1 L LB containing 20 µg/mL chloramphenicol. The next day, 200 mL overnight culture was pelleted by centrifugation at 3000×g for 10 min at 4 °C. Dried pellets were stored at −20 °C, and plasmid DNA was isolated as described above. At the same time, 400 mL overnight culture was pelleted, supernatant discarded, and bacteria were resuspended in 10 mL LB and stored as 50:50 glycerol stock. 10 µL of the resuspended bacteria were used to determine the number of bacteria per µL stock by plating.
Sample preparation and next-generation sequencing
Amplification of the region of interest (i.e., the 18 base pairs coding for the random amino acids) and incorporation of overhang adapters was carried out in a 20 µl reaction volume consisting of 5 ng plasmid DNA, 12.5 µl HotStart Ready Mix (Roche, Woerden, the Netherlands), 2 µl forward and reverse primers (10 µM; see Table 4), and 6.5 µl H2O. Samples were subjected to 3 min 95 °C, followed by 25 cycles of 30 s 95 °C, 30 s 55 °C, 30 s 72 °C, followed by 5 min 72 °C. PCR products were cleaned using AMPure XP beads (Beckman Coulter, Brea, CA, USA) following the manufacturer’s protocol. Next, the cleaned PCR products were barcoded by index PCR. 5 µl PCR product, 1 µl forward and reverse index primers (10 µM; see Table 4), 25 µl KAPA HiFi HotStart ReadyMix and 10 µl H2O were subjected to 3 min 95 °C, followed by 8 cycles of 30 s 95 °C, 30 s 55 °C, 30 s 72 °C, followed by 5 min 72 °C. PCR products were cleaned using AMPure XP beads. The concentrations of the final PCR products were determined using D5000 DNA ScreenTape (Agilent, Santa Clara, CA, USA), measured on a Tapestation 4200 (Agilent), and finally, equal amounts per sample were pooled to a final concentration of 10 nM. The resulting library pool was sequenced on a NovaSeq 6000 (Illumina, San Diego, CA, USA) with a depth of 700 M reads (i.e., 100 M/sample).
Bioinformatics analysis
Raw DNA sequencing reads were separated into matching samples using index barcoding and analyzed using custom Perl scripts to determine the total number of DNA sequences, total number of DNA sequences matching linker sequences, and total number of uniquely matched DNA sequences per sample. The variable DNA region was translated into the corresponding peptide sequence. Subsequently, the number of peptide sequences and the number of uniquely matched peptide sequences were determined. Given the observed differences in sequencing depth between samples we decided to calculate the ratio (i.e., abundance) of every individual peptide based on the total amount of reads per sample, allowing us to directly compare samples. Next, the fold change of every individual unique peptide sequence as the experiment progressed was calculated by comparing the ratio in a given sample (PDAC-1, PDAC-2, PDAC-3, Blood-1, Blood-2, Blood-3) to its corresponding start ratio (Enrich-2), and subsequently ordered from highest to lowest fold change based on PDAC-3 (for PDAC-1 and PDAC-2) or Blood-3 (for Blood-1 and Blood-2). Finally, the results were filtered to remove all unique peptides with a fold increase of either ≥1, ≥10, or ≥50 in Blood-3 from PDAC-3. To gain more insight into the amino acid distribution during the experiment, the ratio of every amino acid for every position in each unique peptide in all samples was determined, and fold change in amino acid was determined by normalization of the ratio in a given sample to the start ratio (Enrich- 2). Finally, samples were compared by calculating differences in fold change of Enrich-2-normalized amino acid ratios.
FRET-peptide cleavage assay
FRET-peptides containing substrate sequences corresponding to the top 15 hits and the CAPN2-responsive substrate, SGAGLPLFAARPGANS, were synthesized by modifying the peptide with Dabcyl at the N-terminus and a FAM-group at the C-terminus (LifeTein, Somerset, NJ, USA). Next, 10 μL of 10 μM peptide was incubated with 90 μL of PBS (negative control), PANC-1, MIA PaCa-2, BxPC-3, Capan-1, Capan-2, human blood lysate (1 × 10⁶ cells/mL) or murine lung, liver, kidney or colon lysate. Fluorescence was measured every 15 min at Ex/Em 485/528 nm wavelengths using a Biotek Synergy HT plate reader (Biotek Instruments, Winooski, VT, USA).
Statistical analysis
All statistical tests, sample sizes, and error bar definitions are given in the respective figure legend. Statistical tests were conducted in GraphPad Prism (version 9.1.0, GraphPad Software Inc.), and graphs were made in GraphPad Prism (version 9.1.0, GraphPad Software Inc.).

Responses