Immune environment of high-TIL breast cancer: triple negative and hormone receptor positive HER2 negative

Introduction
Breast cancer is the most commonly diagnosed cancer in women, and cause of cancer-related death world widely1. Neoadjuvant chemotherapy (NAC) is now considered as a main treatment option in patients with breast cancer, especially in triple-negative breast cancer (TNBC). NAC had been used in patients with inoperable breast cancer to downsize the tumor and allowed breast-conserving surgery even in patients with operable tumors. Nowadays, NAC is more precisely applied based on the breast cancer subtypes, and is also considered to have therapeutic effect equivalent to adjuvant chemotherapy2.
Immune cells (IC) are a major component of the tumor microenvironment (TME). In breast cancer, stromal tumor-infiltrating lymphocytes (TIL) have been highlighted as prognostic marker as well as indicator of chemotherapy response in TNBC and human epidermal growth factor receptor 2-positive breast cancer (HER2 + BC)3,4. In TNBC, high-TIL level as well as high-CD8 + TIL level has been thought to have positive prognostic effect and also demonstrates positive correlation with pathologic complete response (pCR) rate5,6. Different from TNBC and HER2+ tumors, hormone receptor-positive, HER2-negative breast cancer (HR + HER2-BC) basically poorly responds to NAC with low pCR rate7,8. Several studies have investigated the underlying mechanism of low chemo-sensitivity of HR + HER2-BC, and suggested different immune activation status or complex interaction between ER signaling with immune system9,10,11. HR + HER2-BC has the lowest TIL level among the breast cancer subtypes12. Also, questionably, high-TIL level of HR + HER2-BC was correlated with inferior clinical outcome13,14. Give these findings, we hypothesized that despite comparable levels of high-TIL, the tumor-immune microenvironment (TIME) exhibits distinct characteristics in HR + HER2-BC compared to TNBC.
In this study, we aimed to conduct a comparative analysis of the TIME between TNBC and HR + HER2-BC harboring high-TIL. We focused on quantitatively assessment of the different proportional distribution of IC subpopulations between these two tumor subtypes using multiplex immunofluorescence (mIF).
Methods
This study was approved by the Institutional Review Board of Gangnam Severance Hospital (3-2022-0131) and adhered to the clinical practice guidelines of the Declaration of Helsinki (2013 amendment). Informed consent was waived for all patients due to the retrospective design of this study.
Patients
Patients with invasive breast cancer (stages I–III; age ≥ 20 years at the time of surgery) who were treated between January 2019 and August 2021 at Gangnam Severance Hospital according to standard protocols were included in the study. Clinicopathologic parameters evaluated in each case from electronic medical records including patient age at initial diagnosis, tumor size, nuclear grade (NG) and histologic grade (HG) based on the Nottingham grading system15, level of TIL, and status of estrogen receptor (ER), progesterone receptor (PR), and HER2. Applying the predetermined inclusion and exclusion criteria, a cohort consisting of 18 TNBC and 14 HR + HER2-BC was selected for this study.
Patients included in the study were aged 20 years or older and had invasive breast cancer treated with upfront surgery. For TNBC cases, the tumors were negative for ER, PR, and HER2. For HR + HER2-negative breast cancer cases, the tumors were positive for ER and/or PR and negative for HER2. Only cases with TIL levels of 60% or higher were selected for inclusion.
Exclusion criteria included cases with inaccessible electronic medical records, patients who had received NAC, cases with TIL levels below 60%, and those where breast cancer tissue was unavailable for the experiment.
Pathologic review and TIL evaluation
Histology slides of patients were reviewed by two pathologists (SJS and YJC). The TIL level was concurrently evaluated according to the guidelines suggested by the International TIL Working Group16. Except for polymorphonuclear leukocytes, other mononuclear cells, including lymphocytes and plasma cells, were counted. Cases having 60% or higher stromal TIL were selected. TSR is defined as tumor cellularity relative to the surrounding stroma in the overall tumor bed17,18. The TSR assessment was conducted using scoring percentages in 10% increments.
Immunohistochemistry (IHC) was used for the evaluation of clinical subtypes. Nuclear staining values of 1% or higher were considered positive for ER (clone 6F11; dilution 1:200; Leica Biosystems, Wetzlar, Germany) and PR (clone 16; dilution 1:500; Leica Biosystems)19. HER2 (clone 4B5; dilution 1:5; Ventana Medical System, Oro Valley, AZ, USA) staining was performed according to the 2018 American Society of Clinical Oncology/College of American Pathologists20. Only samples with strong and circumferential membranous HER2 immunoreactivity (3+) were considered positive, whereas those with 0 or 1 + HER2 staining were considered negative. Cases with equivocal HER2 expression (2+) were further evaluated for HER2 gene amplification via silver in situ hybridization (SISH). SISH groups 2, 4, and 5 were considered negative.
For PD-L1 status, IHC was performed using clone 22C3 (dilution 1:50; Dako, Carpinteria, CA, USA), and the result was reported as combined proportional score (CPS) according to the interpretation guidelines and scoring algorithm provided by the manufacturer21. The CPS of PD-L1 (22C3) expression was calculated as the number of PD-L1 staining cells including tumor cells, lymphocytes, and macrophages divided by the total number of all viable invasive tumor cells, and then multiplied by 100. The CPS was determined at x200 magnification. Areas with edge artifact, crushing artifact, or necrosis were excluded from scoring. PD-L1 (22C3) positivity was defined as a “CPS ≥ 10.”
OPAL mIF and primary data generation
The tyramide signal amplification (TSA)-based Opal method was used in this study for mIF staining. The 4 μm-thick sectioned slides were baked in the oven at 60 °C for 1 h. The slides were deparaffinized in xylene and rehydrated in ethanol. After rehydration, the slides were washed in distilled water and fixed in 10% neutral buffered formalin for 10 min at room temperature. All multiplexed staining was performed with the Opal 7 Immunology Discovery Kit (OP7DS2001KT; Akoya Biosciences, Marlborough, MA, USA). Antigen retrieval was performed in AR buffer using microwave treatment (MWT). After MWT, the slides were incubated at room temperature for 15 min and were covered with a blocking buffer in a humidified chamber for 10 min at room temperature. The following primary antibodies were used: CD8 (clone 108M-96; dilution 1:200; Cell Marque Rocklin, CA, USA), FOXP3 (clone 236 A/E7; dilution 1:50; Abcam, Cambridge, UK), CD4 (clone EPR6855; dilution 1:200; Abcam), CK (clone AE1/AE3; dilution 1:500; Novocastra™, Newcastle upon Tyne, UK), CD20 (clone M0755; dilution 1:200; Dako). Secondary antibodies were incubated in a humidified chamber for an hour at room temperature. TSA visualization was performed using Opal fluorophores (Opal 480, Opal 520, Opal 570, Opal 620, Opal 690 and Opal 780). For the next antibody staining, MWT was performed to remove the antibody-Opal fluorophore complex with AR buffer. All multiplexed staining was performed by repeating MWT through TSA visualization. Multiplexed staining was finished with a DAPI counterstain and the slides were covered by using a mounting solution (S3023; Dako). Opal mIF Images of stained slides were acquired with the Vectra Polaris (Akoya Biosciences) whole-slide scanner using a standardized scanning protocol, and processed using digital image analysis software, inForm® (Ver 2.5, Akoya Biosciences). Manual annotation was carried out for region of interest (ROI) for all slides using Phenochart (Ver 1.1, Akoya Biosciences). ROIs were selected in tumor tissue of each case, which were further categorized in “tumor” and “stroma” (Fig. 1): “Tumor” area was almost exclusively composed of tumor cells (TC) with least intervening stroma. “Stroma” area was exclusive of TC, consisting of a TME, which contained most of the IC. For each ROI, the density of specific cell types expressing CD8, FOXP3, CD4, CD20, and CK per case were quantified by cell counts per square micron. Data table generated from inForm® software was further consolidated using “phenoptr” package of R software (https://www.r-project.org; version 4.3.1).

Using the Phenochart program, the tumor area within the tissue is marked on a multiplex immunofluorescent image (A). Grids are overlaid, with each box representing a field measuring 931 μm by 698 μm (B). A high-power view (magnification, x272) displays the tumor region of interest (ROI), comprised of tumor cell clusters, and the stroma ROI, which includes the tumor stroma within the tumor tissue (C).
Calculation of spatial metrics of TC and IC
Cells expressing CK alone and located in ROI of tumor category were defined as TC. Conversely, cells expressing at least one immune marker were defined as IC, irrelevant of CK status. IC count was separately analyzed in ROI of tumor and stroma, as well as with total ROIs. For each category of ROI, numbers, and area of TC and IC were calculated. With sum of cell area and cell numbers, density of TC and IC were calculated in tumor and stroma area, defined as cell count per mm2. Cells estimated as expressing multiple markers were excluded except for CD4 + FOXP3+.
Cell-to-cell distance was calculated using the x, y coordinates of the centroid of each cell. The cell-cell distance was determined by measuring the shortest distance between each cell. For IC-TC distance, the 50th percentile distance of IC-TC pairs was set as the cutoff for statistical analysis.
Regarding the definition of neighboring cells, we set 15 μm as the threshold where two cells are nearly touching each other22. Given the typical cell sizes of IC (~10 μm) and TC (~20 μm), 15 μm represents the distance between the centroids of two cells. For each TC, the number of IC that contact the same TC and the combination and proportion of IC types were calculated. For every IC within the same samples, unique IC pairs that located within 15 μm from each other were analyzed for their proportional distribution.
Statistical analysis
Statistical analyses were performed using R software (https://www.r-project.org; version 4.3.1). The continuous variables between the two groups were compared using the t-test or Wilcoxon rank sum test. The categorical variables were compared by using the Pearson’s Chi-squared test. To compare the proportion of IC between different subgroups, proportion test was performed using the prop.test() function in R. A p value less than 0.05 was considered statistically significant. The threshold for statistical significance was set at p < 0.05, with a 95% confidence interval (CI) not including 1.
Results
Basal clinicopathologic features of patients
With inclusion and exclusion criteria, a total of 32 patients (TNBC, n = 18; HR + HER2-BC, n = 14) were selected. The basal clinicopathologic information is shown in Supplementary Table 1. There was no statistical difference in age, tumor size, TIL, TSR, and PD-L1 status between TNBC and HR + HER2-BC. In patients with TNBC, the predominant number of patients had high NG (88.9% vs 50.0%, p = 0.042) and high HG (66.7% vs 21.4%, p = 0.029) compared with patients with HR + HER2-BC. The average TIL was 75.6% for TNBC and 75.4% for HR + HER2-BC. TSR was slightly higher in TNBC (61.1%) than HR + HER2-BC (52.1%) but was not significantly different (p = 0.215). Regarding PD-L1 (22C3) status, 72.2% (13/18) and 64.3% (9/14) of TNBC and HR + HER2-BC had CPS ≥ 10.
IC density and regional composition by tumor subtype and PD-L1 status
Overall information of cell metrics is summarized in Table 1. The average number of evaluated fields was 129.4 for TNBC and 75.4 for HR + HER2-BC. The mean ROI of tumor area was larger in TNBC (28.3 ± 30.1 mm2 vs 10.6 ± 11.8 mm2, p = 0.032), but the mean ROI of stroma area was not different. The IC density in both tumor and stroma areas showed no significant difference between the tumor subtypes. When comparing the cellular density of each IC type between tumor subtypes, no statistical difference was found (Supplementary Fig. 1). However, the IC composition in each tissue category of TNBC and HR + HER2-BC showed a significant difference (Fig. 2A). Specifically, TNBC had a significantly higher proportion of CD8 + IC and a lower proportion of CD20 + IC compared to HR + HER2-BC. The proportion of CD4 + IC was similar between TNBC and HR + HER2-BC. However, the proportion of FOXP3 + IC among CD4 + IC was significantly higher in the stroma area of TNBC (3.9% vs 3.0%, p = 0.036, Table 1).

Pie charts depict the comparative immune cell (IC) composition in the stroma and tumor regions for breast cancer subtypes and stratified by PD-L1 status The CD4 + IC component is further differentiated according to FOXP3 status. A All cases. B Triple negative breast cancer. C Hormone receptor positive, HER2-negative breast cancer. D PD-L1 positive cases. TNBC triple negative breast cancer, HR + HER2-BC hormone receptor positive, HER2-negative breast cancer.
Comparing IC composition by PD-L1 status between TNBC and HR + HER2-BC, significant differences emerged (Fig. 2B, C). However, regional IC densities remained consistent between the subtypes (Table 2 and Supplementary Fig. 2). In the PD-L1 positive group of TNBC, stromal IC were primarily CD4 + IC, followed by CD8 + IC, and then CD20 + IC. In contrast, the PD-L1 negative group displayed an order of CD4 + IC, CD20 + IC, then CD8 + IC (p < 0.001, Fig. 2B). Furthermore, stromal FOXP3 + IC proportion in CD4 + IC was higher in the PD-L1 positive group than PD-L1 negative group (4.2% vs 3.0%, p = 0.011, Table 2 and Fig. 2B). Within the tumor area of TNBC, the PD-L1 positive group exhibited comparable proportions of CD8 + IC (44.3%) and CD4 + IC (43.8%). However, the PD-L1 negative group had a much higher prevalence of tumoral CD8 + IC (72.4%) compared to CD4 + IC (14.9%) (p < 0.001, Table 2 and Fig. 2B).
IC distribution in stromal and tumor areas of HR + HER2-BC differed from TNBC. Notably, composition variations based on PD-L1 status were evident (Fig. 2C). In particular, CD20 + IC was the predominant immune cell in the PD-L1 positive group, while CD8 + IC was the most prevalent in the PD-L1 negative group (Fig. 2C). Unlike in TNBC, HR + HER2-BC displayed no significant variance in the FOXP3+ subset proportion within stromal CD4 + IC, regardless of PD-L1 status.
PD-L1 positive cases were further compared by subtype (Table 2). The average density of TC or IC showed no significant difference between the two groups. Compared to PD-L1 positive HR + HER2-BC, PD-L1 positive TNBC showed significantly higher CD4 + FOXP3 + IC density in stroma area (146.4 ± 67.1/mm2 vs 114.3 ± 146.9/mm2, p = 0.036, Table 2). In PD-L1 positive TNBC, CD4 + IC was the predominant type, while CD20 + IC was the least common across all tissue categories (p < 0.001, Table 2 and Fig. 2D). Moreover, the proportion of CD8 + IC was higher in PD-L1 positive TNBC than in PD-L1 positive HR + HER2-BC across all tissue categories (stroma, 26.1% vs 14.8%; tumor, 44.3% vs 23.7%; all p < 0.001, Table 2 and Fig. 2D). Specifically, the proportion of FOXP3 + IC among the CD4 + IC was also significantly different in all tissue categories, higher in PD-L1 positive TNBC than in PD-L1 positive HR + HER2-BC (stroma, 4.2% vs 3.0%, p = 0.010; tumor, 7.4% vs 4.0%, p = 0.017, Table 2 and Fig. 2D).
Spatial distribution IC from the TC in each tumor subtype
Overall, the density plots for each IC showed significant differences in the 50th percentile distance of IC-TC pairs between subtypes, with each density plot showing a single peak (Fig. 3). TNBC consistently presented higher density peaks across all IC subtypes. In TNBC, 50% of ICs were concentrated within 50 μm of TC, while HR + HER2-BC showed a more dispersed IC distribution (Fig. 3A). In PD-L1 positive cases, TNBC had a higher concentration of CD8 + , CD4 + , and CD4 + FOXP3 + IC within 50 μm of TC than HR + HER2-BC (Fig. 3B). Although CD20 + IC density plots largely overlapped for TNBC and HR + HER2-BC, the 50th percentile distance of IC-TC pairs was significantly shorter in TNBC (Fig. 3B).

Density plots illustrating the distribution of immune cell (IC) proximity to tumor cells (TC) for different IC subtypes across two breast cancer subtypes. Each graph represents a specific IC subtype. The shaded regions in each plot indicate where 50% of the IC are located from TC. The numbers marked on the x-axis represent the distance (in µm) where the 50th percentile of IC are located. IC were grouped based on these distances, and a Chi-square test was performed to evaluate statistical significance indicated by (***). A All cases. B PD-L1 positive cases. C Triple negative breast cancer. D Hormone receptor positive, HER2-negative breast cancer. TNBC triple negative breast cancer, HR + HER2-BC hormone receptor positive, HER2-negative breast cancer.
Density plots were compared by PD-L1 status in each tumor subtype (Fig. 3C, D). In TNBC, PD-L1 negative cases showed a more clustered IC distribution near TC and shorter 50th percentile distances for IC-TC pairs (Fig. 3C) For HR + HER2-BC, IC distribution patterns mostly echoed those in TNBC, except for CD20 + IC. Here, PD-L1 positive cases showed a denser concentration close to the TC (Fig. 3D).
Direct interaction of IC and TC and the IC combination adjacent to the same TC
IC within 15 μm of TC were considered to directly interact with them. Each TC associates with a variety of adjacent IC combinations (Supplementary Table 2 and Supplementary Figs. 3, 4). Overall, the proportion of TC directly interacting with multiple IC was similar between tumor subtypes. Additionally, the distribution of unique IC combinations directly interacting with TC showed no significant variation between tumor subtypes (Supplementary Figs. 5 and 6).
When analyzing the frequency and combination of IC, the cumulative occurrences of each IC type within IC combinations differed by subtype and PD-L1 status (Fig. 4). Overall, CD4 + IC was the predominant IC type in all instances. In TNBC, CD20 + IC appeared in smaller proportions in most IC combinations, while it was more dominant in HR + HER2-BC as IC count increased (Fig. 4A). When comparing PD-L1 positive cases specifically, a similar pattern was observed (Fig. 4B). The distribution of IC types varied based on PD-L1 status for each tumor subtype. For instance, in HR + HER2-BC, the PD-L1 negative group showed a higher prevalence of CD20 + IC and CD8 + IC, while the PD-L1 positive group had more frequent occurrences of CD4 + FOXP3 + IC (Fig. 4C). Conversely, CD20 + IC in TNBC showed predominance in the PD-L1 negative group compared to PD-L1 positive group (Fig. 4D).

The stacked bar plot visualizes the composition of immune cells that directly interact with the same tumor cells. The x-axis represents different immune cell combinations, while the y-axis depicts the relative percentage of each cell type within a combination. A placeholder “X” indicates the absence of data for a given column. A All cases. B PD-L1 positive cases. (C) Hormone receptor positive, HER2-negative breast cancer. D Triple negative breast cancer.
Interaction between IC and the distribution of IC-IC pairs
All IC located within 15 μm of each other were analyzed. The current study examined four IC types, resulting in 10 possible IC-IC pairs and their distribution was visualized in Fig. 5. The IC pair solely composed of CD4 + IC was predominant in all samples, irrespective of tumor subtype or PD-L1 status. In the PD-L1 positive subset, TNBC had a higher occurrence of CD4 + IC-CD8 + IC and CD8 + IC-CD8 + IC pairs than HR + HER2-BC. On the other hand, HR + HER2-BC showed more frequent CD20 + IC-CD4 + IC and CD20 + IC-CD20 + IC pairs than TNBC.
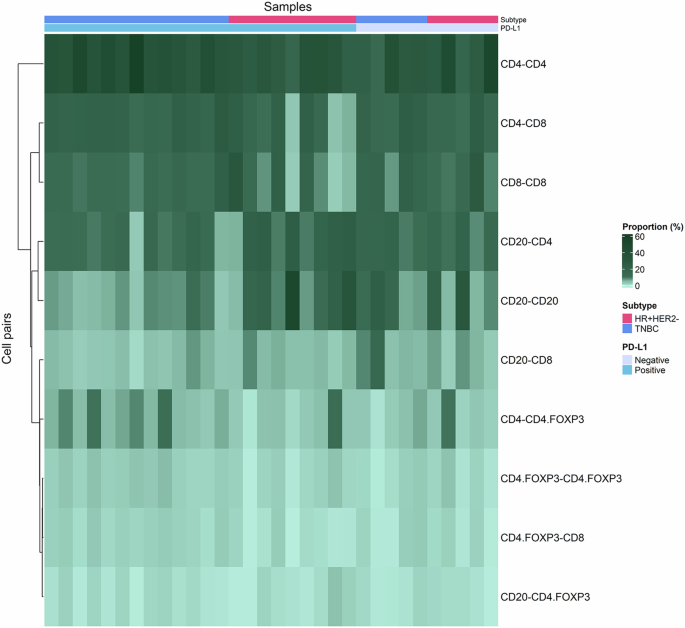
The heatmap provides a visual representation of the relationship between immune cell pairs and their proportion across samples Each row of the heatmap corresponds to a specific immune cell pair combination and the columns represent individual samples.
Discussion
In our study, we found significant differences in IC composition and distribution within the TIME between TNBC and HR + HER2-BC, even under same high-TIL conditions, as revealed by mIF. TNBC predominantly exhibited CD8 + IC and CD4 + FOXP3 + IC, while HR + HER2-BC displayed a predominance of CD20 + IC. Additionally, IC were notably concentrated around TC in TNBC with a larger proportion of T-cells having close interaction with TC.
While TNBC is recognized as the most aggressive BC subtype, it exhibits the highest responsiveness to NAC along with HER2 + BC, compared to the HR + HER2-BC. In TNBC, presence of TIL in TME supports the anti-tumor immune response and higher TIL level has known to be associated with treatment response to NAC as well as post-treatment survival outcome23. Unlike in TNBC, a higher TIL level in HR + HER2-BC is associated with a worse clinical outcome14, and the detailed TIME of HR + HER2-BC remains largely unexplored. So far, only handful of studies investigated the TIME of HR + HER2-BC24,25,26. A study using the GeoMx® ImmunoOncology assay revealed elevated regulatory T-cell (Treg) markers, including CD4, CD25, and FOXP3, in basal-like BC (primarily TNBC) compared to HR + HER2-BC26.
CD4 + FOXP3 + IC, otherwise Treg, have been considered as a significant prognostic marker in cancer outcomes27. Though they have shown both positive28,29 and negative30,31,32 impacts on survival, most reports indicated a negative correlation with survival outcome in cancers across various organs. The prognostic implications of CD4 + FOXP3 + IC in BC is still controversial33,34. In era of ICI, which are largely comprised of PD-1 or PD-L1 inhibitors, CD4 + FOXP3 + IC are reported as predictive biomarker of ICI treatment in variable solid cancers35,36. PD-1/PD-L1 axis and Treg interact with and influence each other. PD-L1 not only induces the expansion of Tregs but also strengthens their suppressive function37,38. Currently, PD-L1 expression and tumor mutational burden are key biomarkers for ICI39. The integration of ICI in TNBC treatment has significantly enhanced patient prognosis, closely tied to PD-L1 and TIL status40. In our study, we observed that FOXP3+ proportion within the CD4 + IC was consistently higher in TNBC, particularly evident in the PD-L1 positive group. This marked increase of stromal Treg in PD-L1 positive TNBC might underscore its superior ICI response compared to HR + HER2-BC, which displayed no variation in Treg proportion by PD-L1 status.
The spatial dynamic of IC surrounding TC varied significantly between TNBC and HR + HER2-BC. In our analysis, all IC types in TNBC were found considerably closer to TC, highlighting the pronounced immunogenic nature of TNBC. Specifically, PD-L1 negative TNBC showed 50% of IC situated within 25 μm of TC. Remarkably, cytotoxic T-cells (CD8 + IC) averaged the closest proximity at 15.3 μm. Considering the usual diameters of IC (7–8 μm) and TC (15–60 μm), these findings emphasize the dense clustering of IC around TC in TNBC. The intimate proximity of CD8 + IC, combined with their significant fraction in the tumor area, indicates potent direct antitumor activity, particularly when compared to PD-L1 positive TNBC and HR + HER2-BC.
Historically, B-cells, or CD20 + IC, have been overshadowed by T-cells in discussions surrounding the TIME. However, there is growing evidence highlighting the significance of tumor-infiltrating B-cells in tumor control41. In our study, CD20 + IC was predominant in HR + HER2-BC, especially in stromal and tumor regions of PD-L1 positive cases, while TNBC showed an inverse CD20 + IC prevalence trend by the PD-L1 status. B-cells operate a range of multifaceted mechanisms within the TME, from recruiting and organizing other immune cells, activating innate immunity, and exerting direct antitumor effects, to potential immunosuppression mediated by regulatory B-cells41. Importantly, their influence often depends on interactions with other TIME elements such as macrophages, dendritic cells, NK cells, and T-cells, which is contrasts with the direct actions of CTL or NK cells42,43,44,45. B-cells has been considered as a positive prognostic indicator in breast cancer46,47. In a preclinical TNBC model with high mutation burden and immune cell activity, immune checkpoint blockade amplified the role of both T follicular helper cells and B-cells in the anti-tumor response48. Nonetheless, the role of B-cells in HR + HER2-BC remains undefined. Most studies have focused on luminal B molecular subtype of BC, some of which may clinically align with clinical HR + HER2 + BC, potentially more immunogenic than HR + HER2-BC46,47. Based on ER expression status, low ER tumors showing <10% ER expression have been reported to exhibit similar biological behavior to basal-like tumors, with comparable CD8 + IC, high TIL, and good response to immunotherapy49 In our study, we included only HR + HER2-BC cases with >33% ER expression (Allred score ≥6), which provided a clear contrast to TNBC. Further subcategorization of ER expression status and investigation of the TIME in high-TIL HR + HER2-BC could offer valuable insights into the differing clinical behaviors and responses to immunotherapy.
Our findings underscore that CD20 + IC made up a larger fraction in HR + HER2-BC than in TNBC under high-TIL status. Intriguingly, these cells were observed to be in closer vicinity to tumor cells in PD-L1 positive HR + HER2-BC compared to PD-L1 negative samples. Given the adverse prognosis of high-TIL HR + HER2-BC, this prevalent B-cell compartment may predominantly consist of regulatory B-cells known for mediating immunosuppression. Conversely, considering the immunosuppressive nature indicated by the PD-L1 positive status, the close proximity of CD20 + IC could suggest a suboptimal organization in exerting a potent antitumor effect in HR + HER2-BC.
In our study, high-TIL TNBC exhibited a marked shift in immune composition based on PD-L1 status. Specifically, we observed an increase in CD4 + IC and CD4 + FOXP3 + IC, but a decrease in CD20 + IC in the PD-L1 positive group. This aligns with prior studies highlighting a correlation between PD-L1 expression and FOXP3 + IC infiltration50,51. Conversely, for high-TIL HR + HER2-BC, both CD4 + IC and CD4 + FOXP3 + IC levels remained consistent regardless of PD-L1 status.
There are several limitations in our study. Despite analyzing numerous IC, our sample size was modest and primarily limited to high-TIL cases. We focused on high-TIL cases to decipher the TIME of HR + HER2-BC, but the study was restricted to lymphocytes by the antibodies available, leaving out a broader range of IC types and myeloid cells. A recent study highlights the crucial role of macrophages in the TIME of HR + BC52. While we identified differences in IC composition between different tumor subtypes and PD-L1 status, the interplay among IC components didn’t reveal clear distinctions between subgroups. This ambiguity may have resulted from the lack of data on the functional status of IC in our study. Additional qualitative evaluations, like gene expression analysis, would provide clearer insights. Lastly, our dataset did not include survival outcomes. Given the biological differences between TNBC and HR + HER2-BC, comparing survival rates with our sample size might not be conclusive. Subsequent studies should further investigate the long-term survival outcomes of HR + HER2-BC and the treatment response in TNBC.
In conclusion, TNBC and HR + HER2-BC have different TIME in similar high-TIL status. TNBC displayed a higher proportion of CD4 + FOXP3 + IC linked with PD-L1 positivity and denser IC clustering near TC. In HR + HER2-BC with high-TIL, the B-cell compartment was the predominant component. In depth comprehensive evaluation, covering an extended range of TIME elements and integrating transcriptional analysis, could elucidate the complexities of the BC TIME, potentially influencing patient survival outcomes.

Responses