Impact of green bonds on CO2 emissions and disaggregated level renewable electricity in China and the United States of America
Introduction
The joint climate action declaration of the USA and China in Glasgow proves that the influence of these countries goes beyond their desirable economic impact on the global economy. The contribution of these countries to global greenhouse gas (GHG) emissions is as worrying a challenge for them as the worldwide quest for carbon neutrality (Wang et al. 2024a). These countries face fierce economic and trade competition (Bergsten 2018; Dollar 2022). The USA and China are responsible for around 45% of global energy-related emissions. At the same time, the trio of China, the USA, and the European Union are responsible for around 40% of global GHG emissions (International Energy Agency 2023a). Through the glaring report of the Intergovernmental Panel on Climate Change, human activities have inevitably consumed about four-fifths of the global carbon budget for the 1.5 °C target (National Oceanic and Atmospheric Administration 2023), increasing the pressure on the world’s leading economies to reduce their GHG emissions.
Although CO2 emissions per person in the USA have continued to fall since 2000, the average CO2 emissions per person in the USA are still almost twice as high as in China (National Oceanic and Atmospheric Administration 2023). In the overall view and the sectoral interpretation of CO2 emissions, however, the industrial and energy sectors are primarily responsible for higher emissions in China than in the USA (see Fig. 1).
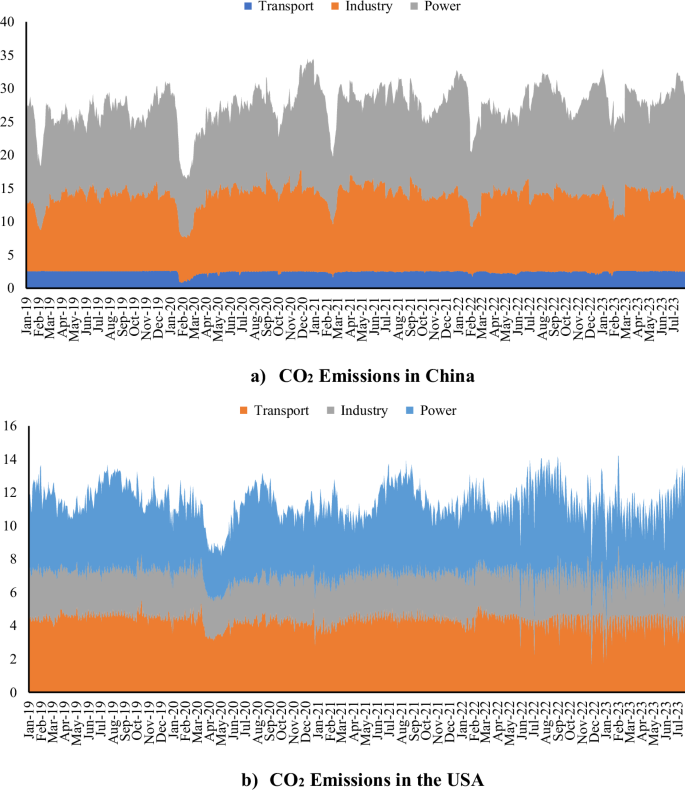
Source: Carbonmonitor (2023) Notes: The unit is Metric Tons of CO2 (MtCO2)/Day.
As shown in Fig. 1, CO2 emissions in the USA only exceed those of China in the transportation sector, which confirms that this sector makes the largest contribution to GHG emissions in the USA (Environmental Protection Agency 2023).
Investment in renewable energy technologies, mainly green energy, has increased significantly in the USA and China. China is the global leader in renewable energy investment, having supported renewable energy research and development to the tune of around 83.4 billion dollars in 2019 (Statista 2023a). Investments in renewable energy and technologies are significantly higher in the USA and China than in other countries worldwide.
According to Goldman Sachs Research, China will reach a combined capacity of 3.3 terawatts of solar and wind energy by 2030, which will enable the country to generate about double its initial target of electricity from wind turbines and solar panels and become an energy-self-sufficient economy by 2060 (Goldman Sachs 2023a). For the USA, Goldman Sachs notes that the recent Inflation Reduction Act, which provides for approximately $3 trillion of investment in renewable energy technologies, has further strengthened the commitment to a carbon-neutral future (Goldman Sachs 2023b). This approach to reducing GHG emissions by through increased generation of green power or electricity is now responsible for a significant economic turnaround in these countries. In the case of China, for example, about 90 percent of the upstream market for solar products and 30 percent of the market for wind turbines are now controlled by that country (Goldman Sachs 2023a).
As shown in Fig. 2, daily electricity generation from the three primary renewable energy sources, i.e., hydro, solar, and wind, is making significant progress over time. As can be seen from the above information, reducing CO2 emissions and increasing electricity generation from renewable energy sources are two essential elements on the political agenda of China and the USA.
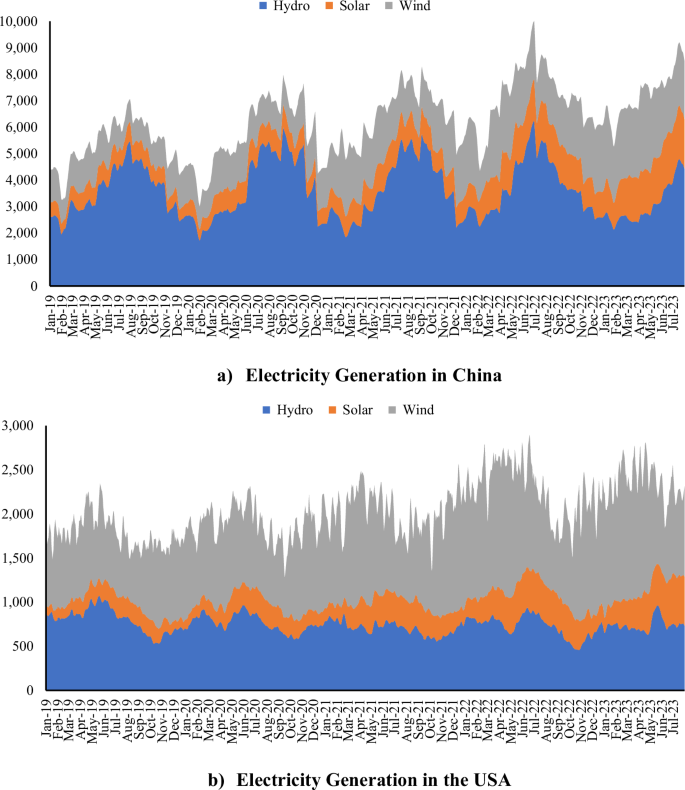
Source: Carbonmonitor (2023) Notes: The unit is gigawatt-hours (GWh)/Day.
Various policy instruments are available for the sectoral reduction of CO2 emissions and the promotion of green electricity generation. Financial resources are essential for reducing environmental degradation and providing renewable energy. In this respect, GBs have recently emerged as a critical tool for financial resources (Maltais and Nykvist 2020; Maino 2022). GBs are “debt financial instruments issued specifically by firms to raise capital to finance ‘green’ projects/assets” (World Bank 2015). The International Capital Market Association (2023) also defines GBs as “financial bonds that enable the raising of capital for existing or new investments with environmental benefits and promote a zero-emission economy”. GBs provide environmental benefits and are closely linked to a sustainable financial system and energy sector (Maltais and Nykvist 2020; Maino 2022; Marín-Rodríguez et al. 2022).
The GB market experienced rapid growth, distinguishing itself from other bonds as a “green label” in January 2014 (Reboredo et al. 2020). GBs are characterized by sustainable financing in terms of carbon reduction (Leitao et al. 2021). GBs can be vital in the fight against global warming and the implementation of climate-friendly environmental policies (Mejía-Escobar et al. 2021). Issuing GBs requires green investments in companies that promise sustainable development (García et al. 2023). The issuance of GBs provides a bridge between financial needs and demand while reducing carbon intensity (Chang et al. 2022). GBs oblige companies to provide funding for green projects and play an essential role in mitigating climate change by promoting green buildings and contributing to the development of climate-sensitive finance (Alamgir and Cheng (2023)).
GBs are a relatively new and little-analyzed phenomenon in the literature (Benlemlih et al. 2023). Given this motivation, the relevance of quantifying the impact of GBs on CO2 emissions at the sectoral level and renewable EG at sourced-based can be supported. Although this sparse and emerging dimension of the relationship between CO2 emissions and GBs has barely been addressed in recent studies (Cui et al. 2020; Yu et al. 2021; Chang et al. 2023; Xu and Li 2023), the role of GBs or assets has neither been explicitly defined in the context of sector-level emissions nor analyzed comparatively using the USA and China.
In comparing the impact of GBs on the USA and China, this study takes a novel theoretical and empirical approach. China and the USA are the two countries that issue the most GBs. In 2021, the issuance of GBs in China amounted to USD 68 billion, while the issuance of GBs in the USA amounted to USD 82 billion (Climate Bonds Initiative 2022). The US and Chinese markets for GBs had similar characteristics, especially during the coronavirus-19 period (Guo and Zhou 2021). However, the difference is that China allocates 1/3 of its GBs to wind, solar, and other renewable energy projects (Jia (2023)). The USA directs 1/4 of its GBs to the energy sector (Bargaoui et al. 2024) and lags behind China with these energy-related statistics. Considering the similarities and differences between the US and Chinese GBs, does the impact of GBs on renewable EG and CO2 emissions differ on a sectoral basis? This study attempts to find an answer to the relevant research question for two significant economies (China and the USA), which are responsible for 43% of global GDP (Investopedia 2023).
The study aims to uncover the impact of GBs (represented by the Financial Times Stock Exchange-FTSE Chinese (Onshore Chinese Yuan Renminbi-CNY) Green Bond Index for China and the FTSE USA Broad Investment-Grade Green Bond Index for the USA) on disaggregated sectoral CO2 emissions and renewable EG in China and the USA as the objective of the investigation. Thus, the study also assesses the impact of GBs on energy in the form of daily EG from hydro, solar, and wind power sources. The attempt to explore this new dimension utilizes daily updated datasets and recently developed empirical tools to provide the necessary and appealing results. Therefore, the results of the research should further inform stakeholders on the policy pathway to carbon neutrality based on a sectoral approach to emissions reduction and insights into green assets.
The study contributes to the contemporary literature by presenting novel insights into the impact of GBs on disaggregated levels of CO2 emissions and renewable EG through the application of novel nonlinear quantile methods. The study examines comparative evidence for China and the USA, which are among the leading CO2-emitting countries. This study provides new insights by benefitting from the high-frequency daily dataset and nonlinear quantile methods as novel features, and extending the current knowledge. In this way, the study presents novel findings (i.e., GBs help to reduce CO2 emissions from the transportation sector in China and the USA, the increase of solar and WEG-related GBs to increase renewable EG in China further, the inefficiency of GBs in renewable EG in the USA, and varying impact across quantiles, sectors, and EG sources).
The study allows the researchers to discuss various policy options, such as encouraging companies that manufacture solar panels and wind turbines to issue GBs, providing finance to encourage individuals to consume green by issuing GBs to public and private banks, and increasing the attractiveness of green projects to investors by lowering interest rates to expand the issuance of GBs in China; support CO2 reduction by continuing to issue GBs that actively promote green transportation, by focusing on the quality rather than quantity of GBs, and by increasing the effectiveness of GBs through sustainable and transparent regulations, and imposing sanctions that allow stricter monitoring of whether buyers are complying with the environmental commitments in GBs, and by encouraging bond buyers to meet the commitments in the USA.
This section is followed by information about the theoretical background and transmission mechanism in Section “Theoretical Background and Mechanism”, an overview of related literature in Section “Literature Review”, a description of the dataset in Section “Methods”, and a commentary on the results in Section “Results”. Section “Conclusion” concludes by highlighting the findings, policy recommendations, limitations, and directions for future research.
Theoretical Background and Mechanism
Theoretical background
The formulation of the environmental aspect of human activities builds on several earlier accounts, notably the work of Holdren and Ehrlich (1974), Grossman and Krueger (1991), and Beckerman (1992). Holdren and Ehrlich (1974) conceptualize the impact on the environment regarding the critical aspects of population growth, affluence, and technological development. Beckerman (1992) makes it clear that environmental protection is hardly possible in poor countries due to the scarcity of resources. In addition, Grossman and Krueger (1991) demonstrate the link between environmental degradation and economic prosperity, using the insight of non-linearity described by Kuznets (1955). Following these earlier investigations and conceptual frameworks, quantifying environmental impact using econometric approaches has become increasingly important in the literature and has been investigated frequently (e.g., Pata et al. 2024).
One of the theoretical determinants of environmental pollution and energy consumption is financial development. As pioneers, Sadorsky (2010; 2011) analyzes the impact of financial development on energy consumption, and Tamazian et al. (2009) and Tamazian and Rao (2010) analyze the impact of financial development on the environment. These pioneering studies explained the theoretical rationale for the impact of financial development on energy and the environment. A more developed financial sector can encourage support for environmental projects by providing finance at a low cost, thus improving environmental quality (Tamazian et al. 2009). In contrast, financial development can increase economic growth and environmental pollution by encouraging foreign direct investment (Tamazian and Rao 2010). As for the interaction between energy and finance, financial development can increase people’s energy consumption by providing cheaper funds and resources for the purchase of machinery, appliances, and more energy-intensive vehicles (Sadorsky 2010). In addition, financial development leads to the development of stock markets, so that individuals demand more energy as their wealth increases (Sadorsky 2011).
Given the theoretical foundations explained above, GBs can also influence energy demand and environmental factors. GBs are elements of stock markets that promote the financing of green and climate-friendly environmental projects (World Bank 2015; Maltais and Nykvist 2020; Maino 2022; Babic 2024). Theoretically, it can be assumed that the development of GBs can increase the use of further renewable energy and help minimize environmental destruction. In this regard, the impact of GBs on the environment and renewable energy, as well as the empirical analysis of the support of GBs for these areas is an important research topic that has recently attracted much attention.
GBs can also finance R&D facilities, new technologies, and investments (Maltais and Nykvist 2020; Maino 2022; Babic 2024). In this way, GBs can have a declining impact on CO2 emissions by discouraging the use of fossil fuels in various sectors and encouraging further clean (renewable) energy. GBs can increase renewable EG at various sources, especially solar and WEG, by making the crucial elements for these types of renewable EG much more accessible through favorable financing conditions. In this way, GBs can actively support various Sustainable Development Goals (SDGs), especially SDG-13 (climate action) by further enabling green technologies that play a crucial role in addressing climate issues and SDG-7 (clean energy) through promoting more renewables for EG and their use in the total energy mix.
Mechanism
Consistent with the theoretical background, there is a strong relationship between GBs, the environment, and renewable energy. As concerns about environmental issues and the need to increase the use of renewable energy develop, so does the need to rely on GBs. This can have various causes, which affect the transmission mechanisms of GBs on the environment and renewable energy. Thus, the impact of GBs on the environment and renewable energy can be recognized through different transmission mechanisms.
The first transmission mechanism is the financing of clean EG projects (Maino 2022). By enabling investors for new clean EG projects, GBs can support further clean EG. While the share of clean EG in the total energy generation mix increases, this can have a displacement effect on the share of fossil energy in the total energy generation mix. By limiting the use of fossil fuels in EG through the promotion of clean energy sources and making strong commitments to environmental targets, GBs can therefore have a direct impact on renewable energy. In this way, GBs can also indirectly contribute to a reduction in CO2 emissions.
The second transmission mechanism is to encourage clean EG investors to invest further (Mertzanis 2023). While GBs have visibility to conventional investors and a flexible structure (Ng and Tao 2016) as well as reducing overinvestment to decline CO2 emissions (Jebri et al. 2024), they can enable clean EG investors by diversifying the investor base as well as providing access to a larger and more stable investor base (Maino 2022). These points are extremely important for large-scale clean EG investments, as such investments are usually associated with higher risk and potentially lower returns (Quatrini 2021). GBs can therefore help to balance these points and support further decarbonization through clean EG.
The third transmission mechanism is to ensure diversity in energy production by financing clean EG projects (Mertzanis 2023). Diversity in energy policy is associated with higher GB issuance. This sheds light on the relationship between green finance and environmental considerations, whereby some types of renewable EG (such as nuclear and solar) can be pioneering catalysts that drive the growth of the GB market. In this way, the diversity of energy production, which is closely linked to SDG-7 and SDG-13, can be promoted through GBs.
The fourth transmission mechanism is to support funding sources for environmental and energy-related new technologies, including R&D facilities (Tamazian et al. 2009; Babic 2024). This can either help to promote energy efficiency, which can lead to far fewer sources of EG being used, or reduce environmental degradation through eco-friendly solutions.
Literature Review
CO2 emissions and GBs
According to Fatica and Panzica (2021), GBs issued by non-financial companies are associated with environmental benefits, with the impact of conventional bonds on CO2 emissions being more pronounced, long-lasting, and significant. Chang et al. (2022) consider 10 green financing countries using the quantile-on-quantile regression (QQ) technique to examine time series dependence. Although GBs significantly improve environmental quality compared to the ecological footprint in 8 of the 10 countries, there is evidence of an asymmetric relationship between GBs and the ecological footprint in some countries. Meo et al., (2022) utilize the QQ method for 10 selected countries and report that GBs reduce CO2 emissions.
Feng et al. (2023) examine the Chinese case for the period 1970–2020 using the nonlinear autoregressive distributed lag (ARDL) method and conclude that an increase in GBs has a curbing impact on environmental degradation. Marín-Rodríguez et al. (2023) investigate the global case and determine that there is a strong co-movement between the GB index and carbon futures returns. Sun et al. (2023) use system generalized methods of moments (GMM) estimates and find that GBs mitigate CO2 emissions in 25 Chinese provinces. Xu and Li (2023) explore the influence of GBs on CO2 emissions for 355 cities in China between 2016 and 2020. By applying different empirical methods, the generalized result is that GBs significantly mitigate CO2 emissions at the city level. Furthermore, improving green innovations confirms the environmentally desirable impact of GBs across the city. Likewise, the study shows that the negative impact of GBs on city-level CO2 emissions can be enhanced by environmental compliance. Furthermore, Kaewsaeng-on and Mehmood (2024) examine SAARC countries between 2005 and 2022 and conclude that green finance helps mitigate environmental risk in higher quantiles.
Some studies have defined either an inverse or a mixed impact of GBs. Hammoudeh et al. (2020), for example, examine the relationship between GBs and CO2 emissions in the USA from July 30, 2014, to February 10, 2020, by using monthly data and a time-varying Granger causality method. The findings show that GBs are not a cause of CO2 emissions. Adebayo and Kartal (2023) examine the case of the USA and conclude that GBs have a curbing impact on industrial CO2 emissions in the short term, while an increasing effect of GBs can be observed in the long term. Alamgir and Cheng (2023) examine the relationship between CO2 emissions and GBs from 2007 to 2021 using a selected panel of 67 countries. The investigation documents that GBs reduce per capita CO2 emissions (about 0.8 tons) and boost renewable energy generation (about 66 kWh) in the studied panel. Although GBs do not have a significant impact on CO2 emissions before 2015, they have a negative impact after 2015. ElBannan and Löffler (2024) document that GBs can help companies finance carbon reductions, but a significant portion of GB financing does not result in measurable environmental benefits. Kartal et al. (2024a) analyze the global case and define that GBs are highly effective on global CO2 emissions. Similar results are determined by Kartal et al. (2024b) for China.
Although studies in the literature have examined the impact of GBs on CO2 emissions, none have focused on sectoral CO2 emissions. Various sectors may respond differently to the constraints of GBs and mandatory green investment requirements. Therefore, the lack of a study examining the impact of GBs on sectoral CO2 emissions with daily data is a gap in the literature.
Renewable energy and GBs
Previous studies have generally discussed the impact of financial development on the renewable energy sector (e.g., Anton, Nucu (2020)). However, financial development includes various indicators, such as the prevalence of credit in the banking sector, the development of stock markets, and the increase in foreign investment, and these indicators are optional for green investors. In this respect, GBs differ from financial development, and researchers have recently begun to discuss their impact on renewable energy types.
Alharbi et al. (2023) perform common correlated effect mean pooled estimators and define that GBs foster renewable energy in 44 countries. Dong et al. (2023) employ panel data estimators and note that GBs have a supporting influence on renewable energy consumption in six Asian countries. Feng et al. (2023) analyze China for the period 1970–2020 and define that an increase in GBs has a stimulating impact on investment in renewable energy and, thus, on renewable energy consumption. Taghizadeh-Hesary et al. (2023) employ the ARDL method and report that GBs stimulate wind and solar energy deployment in Japan. Ye and Rasoulinezhad (2023) apply the fully modified ordinary least squares (FMOLS) and note that GBs have a positive impact on renewable energy efficiency in selected 15 Asia-Pacific countries. Zhao et al. (2023) use a rolling-window-based causality method and conclude that GBs increase renewable energy investments in China. Cheng et al. (2024) analyze 12 Asian economies from 2015 to 2022 using the CS-ARDL method and define that an increase in the GB market leads to an increase in resource efficiency in both the short and long- term. However, Wang and Taghizadeh-Hesary (2023) conduct the FMOLS method for 16 OECD countries and conclude that GBs have no impact on solar energy, while green finance stimulates wind and hydro energy.
Based on the best knowledge, only Taghizadeh-Hesary et al. (2023), by using the ARDL method, and Wang and Taghizadeh-Hesary (2023) by performing panel FMOLS method, have examined the impact of GBs on renewable energy from a disaggregated perspective for Japan and 16 OECD countries, respectively. The gap in the literature is that there needs to be a study that analyzes the impact of GBs on disaggregated renewable EG for China and the USA using novel nonlinear quantile methods.
Evaluation of the literature
The literature review on the relationship between CO2 emissions and GBs, as well as between renewable energy and GBs shows that there are various theoretical studies (e.g., World Bank 2015; Maltais and Nykvist 2020; Maino 2022; Babic 2024) and research that examines the relationship empirically. Although the above studies have examined the relationship between GBs and environmental aspects as well as the time-varying evidence of the relationship (e.g., Dai et al. 2023), there is still a need for further literature.
The gaps in the literature arise from the scope (i.e., mainly examining a single country), the models (i.e., not using novel methods), the dataset (i.e., generally using aggregate-level data rather than disaggregated-level data and low-frequency data rather than high-frequency data), and the subcomponents (i.e., not examining environmental degradation at the sectoral level and renewable energy at the source level). To fill this gap and make a significant contribution to the current knowledge, this study attempts to provide a comparative account of the relationship of GBs with the environment and energy situation of the world’s two leading economies (i.e., China and the USA), which are also among the world’s leading CO2 emitting and energy-intensive countries. In this way, the study aims to fill the gaps in the literature by comparatively examining the impact of GBs on sectoral CO2 emissions and disaggregated levels of renewable EG for both China and the USA.
Methods
Data
The study uncovers the impact of GBs on both carbon neutrality and renewable energy. It uses CO2 emissions as a proxy indicator for carbon neutrality and renewable EG as a proxy indicator for renewable energy, focusing on the cases of China and the USA. Furthermore, the study considers CO2 emissions and renewable EG at a disaggregated level. In other words, the study uses sectoral CO2 emissions and renewable EG on a source basis.
The study collects high-frequency (daily) data for country-based sectoral CO2 emissions from Carbonmonitor (2023) for China and the USA. Data for country-based renewable EG (i.e., HEG, SEG, and WEG) are also obtained from Carbonmonitor (2023). Moreover, data for the GB indices (i.e., FTSE Chinese (Onshore CNY) Green Bond Index and FTSE USA Broad Investment-Grade Green Bond Index) are gathered from Bloomberg (2023).
Carbonmonitor (2023) is the data source because it enables researchers to obtain high-frequency (daily) data on CO2 emissions and renewable EG for the countries. Bloomberg (2023) is also used as the data source since it provides high-frequency (daily) data on GBs by using selected proxy indicators for the countries. Daily data based on working days for both GB indices are collected by Bloomberg (2023) from January 2, 2019, to July 31, 2023.
Variables
The study collects data from Carbonmonitor (2023) and Bloomberg (2023) and includes three sectoral CO2 emission indicators, three renewable EG indicators, and two GB indices. Table 1 presents the information of the variables.
Empirical methodology
By considering the renewable EG and GBs to propose a roadmap to carbon neutrality, the study follows the process presented in Fig. 3.
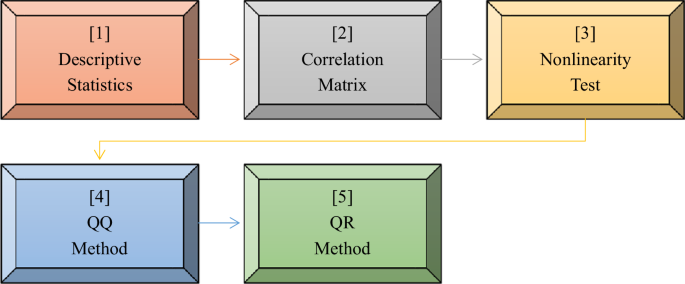
Source: Authors’ own construction.
As part of the introductory steps, the study analyzes the preliminary statistics of the variables. The descriptive statistics and the correlations between the variables are examined. In addition, the non-linearity properties of the variables are investigated using the BDS test (Broock et al. 1996). Later, the QQ method is applied to uncover the impacts of GBs on carbon neutrality and renewable energy indicators at various quantiles (levels) (Sim and Zhou 2015). The quantile regression (QR) method is also used to check whether the results obtained by the QQ method are robust (Koenker and Bassett 1978).
The QR method is a modification of the standard regression based on quantiles. This method is used to analyze the impact of an independent variable on another variable in a specific quantile. Because the QR method provides heterogeneity and accounts for nonlinearity, it can provide richer information and outputs than standard regression analysis. The first stage of the QR method is shown in Eq. (1):
where ({x}_{t}) includes the independent variables, (beta left(tau right)) represents the coefficients, and ({Q}_{{Y}_{t}}left(tau |{x}_{t}right)) denotes the τ-th quantile of the dependent variable. In the second and third stages, the loss function (L) is minimized, and the asymmetric function φτ (u) is obtained as in Eqs. (2) and (3), respectively.
The fourth and final stage of QR is used to examine the θth conditional quantile of yt as in Eq. (4):
The QQ method developed by Sim and Zhou (2015) solves the problem that QR ignores the complete dependency between the series. The QQ method strongly reflects the complete dependence at low, medium, and high quantiles. The relationships between TRA and GBs for the USA can be illustrated by Eq. (5) for the first stage of the QQ method.
where (theta) is the (theta)th quantile, ({z}_{t}) is the quantile error term, and ({beta }^{theta }) (.) is assumed to be unknown. The TRA-GBUSA association at the θth quantile, proxied by ({{EG}}_{t}^{tau }), ({beta }^{theta }) can be linearized by the first-order Taylor rule as in Eq. (6):
where ({beta }^{{theta }^{{prime} }}) shows the responsive impact. ({beta }^{theta }{{{GBUSA}}_{t}}^{tau }) and ({beta }^{{theta }^{{prime} }}left({{{GBUSA}}_{t}}^{tau }right)) are transformed to ({beta }_{0}left(theta ,tau right)) and ({beta }_{1}left(theta ,tau right)), respectively. In the last stage, the impacts of GBUSA on TRA in θth quantiles are estimated separately, as in Eq. (7).
Quantile-based methods provide estimates that are resistant to nonlinearity and nonnormality. In addition, the QQ method makes it possible to analyze the impact of a variable in a specific quantile on another variable in a different quantile. Thus, in contrast to linear econometric methods, the QQ method provides visually robust results, which is why the QQ method is preferred in this study.
In this study, nonlinear quantile methods are employed because the application of linear methods is incorrect when the variables have a nonnormal distribution and nonlinear structure. The QQ and QR methods can provide more effective and reliable results by capturing the nonlinear structure of the variables. Consistent with the data characteristics, the application of nonlinear quantile methods is in line with recent research in the literature (e.g., Alola et al. 2022; Kartal et al. 2024c). Therefore, it is possible to work with the nonnormal and nonlinear dataset by utilizing the latest high-frequency daily data and considering the differentiating impact across quantiles and countries. By applying the nonlinear quantile methods to the high-frequency daily dataset, this study allows researchers to look for new insights related to the research question, which is to investigate the role of GBs on carbon neutrality represented by CO2 emissions at the sectoral level and renewable EG from various sources.
Results
Preliminary statistics
The study first examines the preliminary statistics of the variables, where they are presented in Table 2.
In China, POW has the highest mean value among the sectoral CO2 emissions, and HEG has the highest mean value among renewable EG. HEG has the highest volatility compared to all other variables. Furthermore, all variables show a non-normal distribution. In the USA, TRA has the highest mean value among sectoral CO2 emissions, and WEG has the highest mean value among renewable EG. WEG has the highest volatility compared to all other variables. Except for HEG, all variables are non-normally distributed. In both China and the USA, the renewable EG sources (i.e., HEG, SEG, and WEG) show a higher variation than the other variables. Therefore, these sources of renewable EG are highly susceptible to weather influences. These variables show a higher fluctuation compared to the other variables, which is predictable.
In the second step, Table 3 shows the correlation coefficients between the variables in China and the USA.
Based on the mean correlation analysis, GBs correlate both positively and negatively with sectoral CO2 emissions and renewable EG in China and the USA. This means that an increase in GBs can lead to an increase in renewable EG and can also lead to an increase in sectoral CO2 emissions. On the other hand, GBs correlate negatively with POW and HEG in China and HEG and SEG in the USA. This means that an increase in GBs may have a decreasing impact on POW and HEG in China as well as a declining impact on HEG and SEG in the USA, as they are not used efficiently enough to support renewable EG. GBs can either be inefficient in these sectors or they need to be better distributed across these sectors to have a beneficial impact on increasing renewable EG and declining sectoral CO2 emissions.
In the third step, Table 4 demonstrates the results of the analysis of the nonlinearity of the variables.
Table 4 shows that all variables have a nonlinear rather than a linear structure.
In the case of the overall evaluation, the preliminary statistics show that the variables vary widely, are not generally normally distributed, and have a nonlinear structure completely. Given these characteristics of the variables, the study applies nonlinear methods for empirical investigations as they suit these data characteristics better.
Impact of GBs on carbon neutrality and renewable energy
As part of the further empirical investigation, the study applies the QQ method, which makes it possible to examine the impacts across various quantiles. In this context, Fig. 4 presents the impact of the GBs on carbon neutrality.
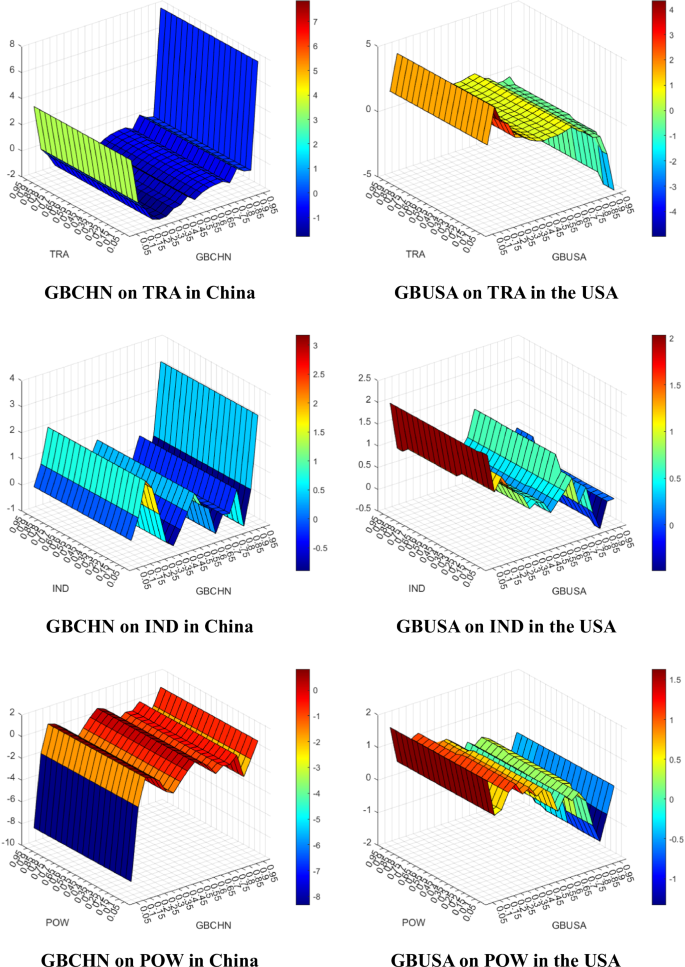
Source: Authors’ own collections from R and MATLAB software. Notes: x, y, and z axes denote the independent variable, dependent variable, and coefficient, in order. The unit for GBCHN and GBUSA is the basis point. The TRA, IND, and POW unit is the MtCO2/Day.
In China, the GBs stimulate CO2 emissions from the transport sector in the first phase. The GBs have increased in the low quantiles, while the impact has reversed (i.e., decreased) at middle and higher quantiles. In the industrial sector, the GBs have a mixed impact. GBs have a decreasing impact for some quantiles (0.30–0.40, 0.65–0.75), while the impact reverses (i.e., an upsurge) for other quantiles. In the power sector, the GBs have a decreasing impact at the lower quantiles (0.05), while they have almost insignificant impacts at the middle and higher quantiles. The results collected for China are generally consistent with the studies of Kartal et al. (2024b), which deal with China, in which they indicate the differential effects of GBs on CO2 emissions across times, frequencies, and quantiles.
In the USA, GBs are increasingly influencing CO2 emissions from the transport sector at the lower and middle quantiles (0.05–0.75). At higher quantiles (0.80–0.95), however, they have managed to bring about a decrease. GBs have a generally stimulating impact across all quantiles in both industry and the power sector, except for some upper quantiles around 0.80. The results obtained for the USA are generally similar to the studies by Adebayo and Kartal (2023) and Kartal et al. (2024a), dealing with the USA and global case, in order, in which they define the varying impact of GBs on CO2 emissions across times, frequencies and quantiles.
Overall, increasing GBs in China and the USA contributes positively to enabling carbon neutrality (i.e., a declining impact on CO2 emissions) in the transport sector. However, GBs do not contribute to reducing CO2 emissions in the industrial and power sectors. Similar to the studies present in the recent literature, this investigation determines the quantile-based varying impacts of GBs on sectoral CO2 emissions in China and the USA. Thus, the inefficiency of GBs in some sectors (i.e., industrial and power sectors) may be due to the country’s sectoral structures. The USA and China are still the countries that consume the most energy from fossil fuels worldwide. In 2022, China relied on fossil fuels for 65% of its electricity generation and the USA for 60% (Our World in Data 2024). While the European Union average is 37%, China’s and the USA’s reliance on fossil fuels in the EG is high. Therefore, GBs cannot reduce CO2 emissions in the power sector.
China is one of the countries with the most significant industrial sector in the world, and China’s massive industrial growth is leading to increased energy consumption. In 2022, global industrial value added amounted to USD 24,247,186.49, of which China accounted for around 27% and the USA 17% (World Bank 2024). According to Safeguard Global (2023), China accounts for almost half of global manufacturing production at 28.4% and the USA at 16.6%. Such high production levels increase fossil fuel consumption and CO2 emissions. For this reason, GBs can be ineffective in preventing high CO2 emissions from the industrial sector. The recent widespread use of electric vehicles can explain the fact that GBs are helping to reduce transportation-related CO2 emissions in China and the USA. Electric vehicles, some of which are supported by GBs, contribute to transportation-related CO2 reduction and the goal of carbon neutrality.
Figure 5 presents the impacts of the GBs on renewable energy.
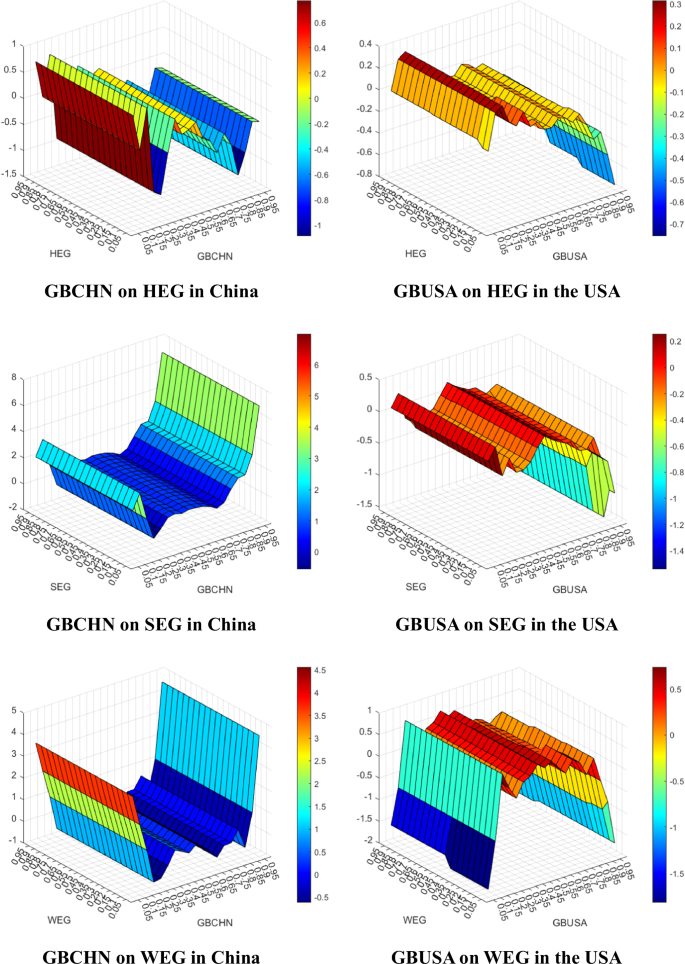
Source: Authors’ own collections from R and MATLAB software. Notes: x, y, and z axes denote the independent variable, dependent variable, and coefficient, in order. The unit for GBCHN and GBUSA is the basis point. The HEG, SEG, and WEG unit is the GWh/Day.
In China, GBs have a mixed impact on HEG. Although GBs have an increasing impact on some lower (0.05–0.15) and middle (0.35–0.50) quantiles, they have a negative impact on other quantiles. In particular, GBs have an increasing impact on SEG. Similarly, GBs stimulate WEG across all quantiles except for some middle and higher (0.20–0.85) quantiles. The results for the Chinese case are consistent with the study by Kartal et al. (2024b), which deals with Chinese case and determines the changing impact of GBs on clean EG.
In the USA, GBs have an increasing impact on HEG at the lower quantiles (0.05–0.35), while they cause a decrease at the other quantiles. Similarly, GBs have an increasing impact on SEG at the lower and middle quantiles, while they have an opposite impact at the higher quantiles. GBs have a mixed impact on wind-EG, with a decreasing impact on the lower (0.05–0.15) and higher (0.85–0.95) quantiles and an increasing impact across the middle quantiles. The results for the USA are along the same lines as the study by Kartal et al. (2024b), who examine China and conclude that the impact of GBs on clean EG varies.
To sum up, an increase in GBs favors an increase in solar and WEG in China. However, the GBs have no positive impact on HEG in China and all types of renewable EG in the USA. Based on these determinations, it can be stated that at the higher levels (i.e., quantiles) there is room for growth in the use of GBs in stimulating renewable EG for China, whereas it is not the case for the USA for all clean EG types. These findings are mainly compatible with the studies present in the recent literature, where GBs have a differentiating impact on renewable EG across its types and quantiles.
Robustness check
In the final step, the study applies QR methods to check the robustness of the results of the QQ method. Figure 6 presents the results of the QQ and QR methods compared to the impacts of the GBs on carbon neutrality.
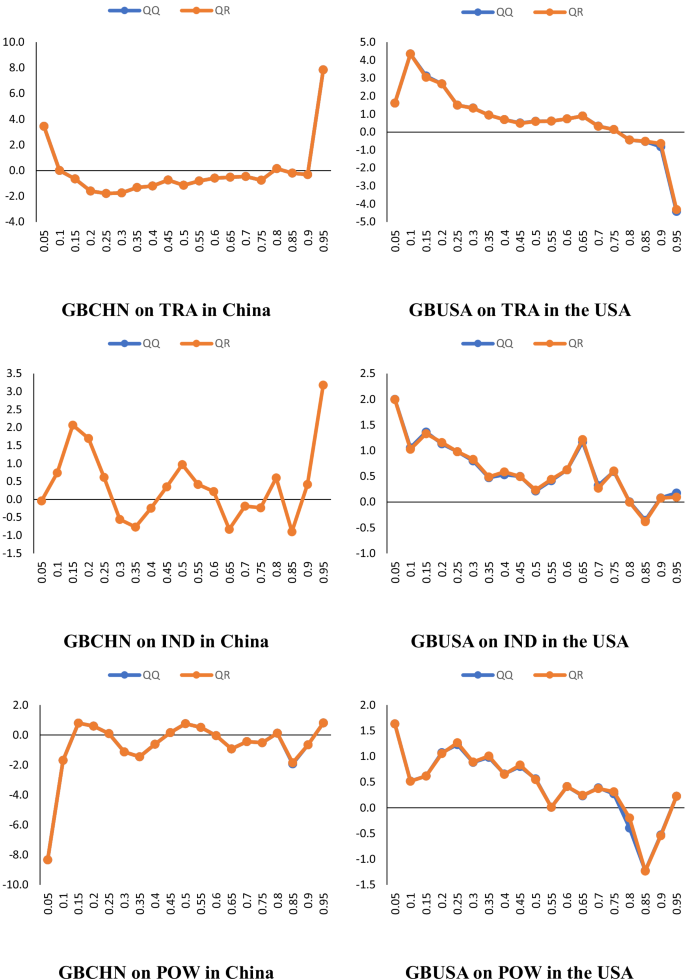
Source: Authors’ own collections from R software. Notes: The x and y axes denote the quantiles and coefficients, in order.
As shown in Fig. 6, the results of the two methods are quite similar in terms of the impact of GBs on carbon neutrality, demonstrating the consistency of the results across the methods applied. Figure 7 also demonstrates the results of the QQ and QR methods compared to the impact of GBs on renewable energy.
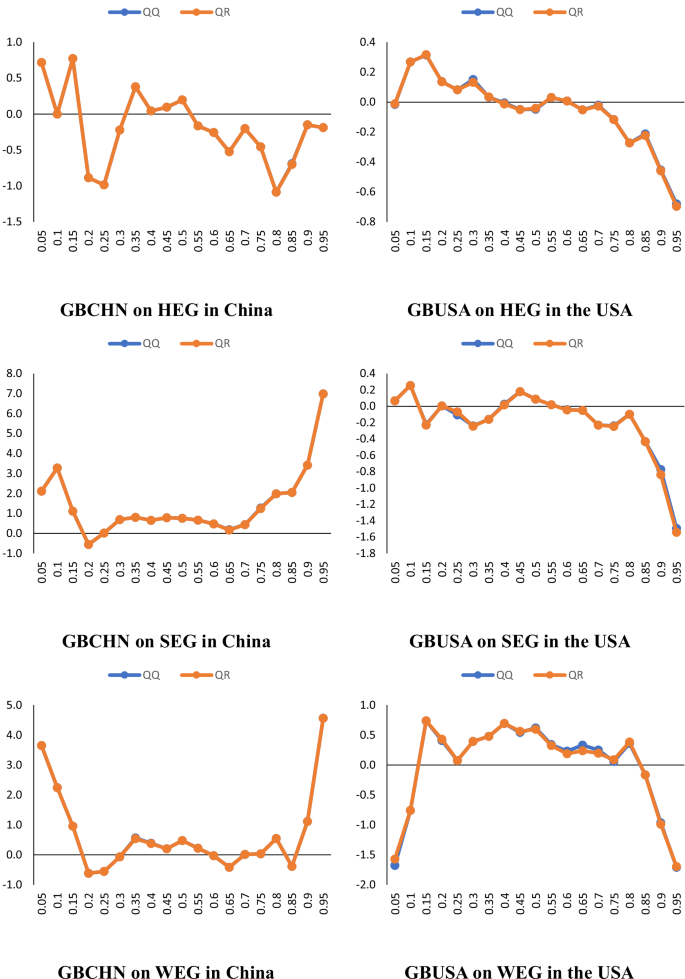
Source: Authors’ own collections from R software. Notes: The x and y axes denote the quantiles and coefficients, in order.
Figure 7 demonstrates that the results of the two methods are highly parallel in terms of the impact of GBs on renewable energy, demonstrating the robustness of the results. Figure 7 shows the results of the QQ and QR methods in comparison to the impact of GBs on renewable energy.
Lastly, Table 5 summarizes the results of the robustness check analysis by presenting the correlation between QQ and QR results.
As summarized in Table 5, the results are almost identical, of which correlations between QQ and QR methods are higher than 99%. The values in Table 5 along with the graphs in Figs. 6, 7 show that QQ and QR results support each other and it can be stated that the results are robust. Accordingly, the USA can continue to use GBs to reduce CO2 emissions from the transportation sector. Also, China can use GBs to minimize CO2 emissions from the transportation sector and promote renewable energy in achieving greener power generation through improving the ties between GBs and renewable EG.
Discussion
Considering the literature gap resulting from the scope (i.e., the exclusive study of single country cases), the econometric models (i.e. the omission of novel methods), the dataset (i.e. the main use of aggregate-level data instead of disaggregated-level data and low- frequency data rather than high- frequency data), and the subcomponents (i.e., no consideration of environmental degradation at the sectoral level and renewable energy at the source level), the study aims to investigate the impact of GBs on disaggregated level CO2 emissions and renewable EG in China and the USA, which is the primary research objective.
The key findings show that GBs are appropriate for the USA and China to reduce CO2 emissions in the transportation sector. In addition, GBs play a supportive role in China’s development of solar and wind power. GBs encourage companies to increase their investment in green energy. In this context, GBs in China support the release of wind turbines, investment in offshore wind farms, and state-of-the-art solar cells. In the USA, GBs do not support the development of renewable energy, but they help reduce CO2 emissions from transportation. GBs play more of a role in reducing pollution in the USA than in changing the energy structure. In fact, China is a world leader in renewable energy and has made considerable investments in recent years. The quantile-based results show that the USA is effectively using GBs to achieve its carbon neutrality goals. However, they also show that the country’s policymakers should take steps to utilize GBs for renewable energy diffusion effectively.
In line with the definition and main properties, GBs have various benefits for the related parties, such as providing financing for long-term sustainable projects and promoting sustainability and climate transition in the long term by raising people’s environmental awareness (Barua and Chiesa 2019; Bhutta et al. 2022; Teti et al. 2022). Given the long-term impact of GBs on sustainable development, policymakers in the USA and China should encourage the adoption and diversification of bonds that support the use of green energy in the transportation sector.
Conclusion
The global focus is on achieving carbon neutrality and progress in the use of renewable energy sources to ensure the achievement of SDGs (Musah et al. 2024; Wang et al. 2024b), especially after the oil crisis in the 1970s. Minimizing carbon intensity and ensuring renewable energy deployment is particularly important for the country that is most responsible for climate change worldwide (Wang et al. 2023). In this context, the study aims to analyze the impact of GBs on carbon neutrality and renewable energy development using high-frequency and disaggregated data in China and the USA, the two largest economies in the world and the biggest environmental polluters. The study employs novel nonlinear quantile methods for this purpose.
The study’s findings show that GBs contribute to achieving the goal of carbon neutrality by reducing CO2 emissions from the transportation sector only at high quantiles for China and the USA and that GBs have no positive impact on CO2 reduction in the industry and energy sectors. In addition, the study finds that GBs only incentivize renewable energy in China, promoting solar and wind energy sources and that GBs do not contribute to developing renewable energy EG in the USA. Thus, the findings mainly reveal that the impact of GBs on environmental development strategies varies depending on the sectoral structure of CO2 emissions, the type of renewable energy, the country, and the quantiles. Conducting analysis and presenting policy recommendations considering these differences is essential to determine the role that GBs can play in a cleaner world order in the future. With these findings, the study offers important policy recommendations for achieving the SDG targets and reaching carbon neutrality in 2030.
Policy recommendations
GBs offer benefits such as environmental awareness for the buyer, energy security and sustainable growth for the government, ethical investment for the green bond issuer, and reduction of global temperature rise for the world community (Azhgaliyeva et al. 2020). GBs, one of the green financing instruments, can encourage companies that are reluctant to take risks through governments and thus ensure efficient consumption of natural resources through the spread of green projects (Ye and Rasoulinezhad 2023). For this reason, GBs are an essential tool for green change in Chinese and American environmental policy.
In China, GBs incentivize the reduction of carbon emissions in the transportation sector and the development of renewable energy. GBs, which create budgetary and financial resources that benefit nature and the environment, can play a crucial role in China’s sustainable development in the future. In this context, the Chinese government should encourage companies producing solar panels and wind turbines to issue GBs. With the GBs issued by renewable energy companies, they can generate additional revenue to realize their investment and support the improvement of environmental quality by fulfilling their commitments to meet the environmental conditions of the GBs. In addition, by issuing GBs to public and private banks, the Chinese government can provide financing to encourage individuals to consume green food. In this way, individuals can receive funding to use greener products and contribute to reducing carbon intensity. As another policy option, the Chinese government can make green projects more attractive to investors by lowering interest rates to expand GBs.
In the USA, the findings show that GBs only help to reduce CO2 emissions from transportation. US banks should support CO2 reduction by issuing GBs to encourage green transportation. Furthermore, the fact that GBs do not increase the penetration of wind or solar energy in the USA is a questionable result. The USA is the country that has issued the greenest bonds in the world over the last 10 years, and the findings of the study show that green bond issuance in the USA has no impact on the renewable energy sector. In this context, the USA should focus on the quality rather than the quantity of GBs and increase the effectiveness of GBs through sustainable and transparent regulations. To this end, the US government can impose sanctions that enable stricter monitoring of whether buyers are complying with the environmental commitments in GBs and encourage bond buyers to comply. China is expected to increase net renewable electricity capacity in 2024 with over 60 GW of onshore wind and over 160 GW of solar photovoltaics, but in the USA, onshore wind will be able to provide an additional capacity addition of about 10 GW and solar photovoltaics of 30 GW in the same year (International Energy Agency 2023b). This situation shows that the USA could continue to lag behind China in solar and wind energy. Therefore, the US government should gain an advantage in the competition with China for renewable energy by expanding GBs and various other incentives for renewable energy.
As part of green finance, GBs support SDG-13 for the transportation sector in China and the USA. In this context, policymakers in China and the USA should promote GBs that favor clean transportation, such as electric vehicles in the transportation sector and rail vehicles that use wind and solar energy for their operations. Furthermore, as GBs promote renewable energy and SDG-7 in China, the Chinese government can increase the use of renewable energy by expanding GBs for the private sector to achieve the SDGs.
In terms of CO2 emissions, the study practically argues that GBs have some dampening impact on CO2 emissions in the transportation sector in both China and the USA. Therefore, Chinese and American policymakers can continue to rely on GBs to combat CO2 emissions in the transportation sector as they benefit from the impact of GBs. On the other hand, it is clear that GBs are not beneficial in reducing CO2 emissions in the industrial and energy sectors, so additional measures are needed to make GBs effective in reducing CO2 emissions in these sectors. Accordingly, policymakers should work with market participants in these sectors to identify how GBs can effectively contribute to the decarbonization of these sectors by encouraging the issuance of GBs, as the findings suggest that some issues prevent countries from using GBs in these sectors. Therefore, the best solution to this issue can be found through collaboration between policymakers and market participants.
In terms of renewable EG, the study practically discussed that GBs help to increase solar and WEG in China, while they are not beneficial to any of the subtypes of renewable EG at higher levels in the USA. Therefore, China has the opportunity to rely on GBs to promote solar and WEG in the current pathway. However, the USA should take immediate action to benefit from a further increase in renewable EG, as it currently does not promote any of the subtypes of renewable EG much more. The cause of this state of affairs can be related to the intensive use of nuclear EG, which can have a crowding-out impact on the subtypes of renewable EG as it requires high investment. Thus, similar to the case of CO2 emissions, policymakers should again work with market participants to find optimal solutions to ensure that GBs effectively support the subtypes of renewables.
From a practical point of view, policymakers should be aware that there is no way to benefit from the instruments, including GBs, without the involvement of market participants. Only by involving them in the development, formulation, and application of policy measures can all shortcomings be clearly and correctly defined and better solutions to these issues be proposed, planned, and implemented as well.
Limitations and future research
This study uses daily data and applies nonlinear quantile methods for China and the USA to examine the role of GBs in sectoral CO2 emissions and renewable EG at a disaggregated level. While the study takes a comprehensive approach from theoretical and empirical perspectives, it has limitations.
First, the study focuses only on the USA and China, which are among the world’s biggest polluters. These countries have caused a large amount of CO2 emissions and consume a large amount of energy. According to the Energy Institute (2023), the USA (14%) and China (30.7%) are responsible for 44.7% of global CO2 emissions in 2022. This situation highlights the need to examine the global effectiveness of GBs in reducing CO2 on a sectoral basis for other countries (e.g., India, Russia, Japan, etc.) that are also responsible for higher CO2 emissions. In addition, the USA and China spent 379.95 and 281.91 billion USD worth of GBs between 2014 and 2022 (Statista 2023b). However, the monetary value of the sum of GBs issued by France, Germany, the Netherlands, Sweden, and the United Kingdom is higher than that of China and the USA. Therefore, it is necessary to investigate the relationship between GBs and CO2 emissions and between GBs and renewable EG for other countries. Thus, there is still a need to examine the global effectiveness of GBs in reducing CO2 emissions at the sectoral level for countries that are responsible for a significant share of global CO2 emissions beyond the USA and China.
Second, the study only considers the time-domain properties of the series in the interaction between GBs and CO2 emissions and between GBs and renewable EG. In future studies, researchers using methods based on wavelet transforms can gain new insights by also considering the frequency-domain properties of the series. In addition, by using time-varying methods, researchers can determine how the relationship of GBs with the environment and renewable EG changes over different times. Even, other econometric method, such as panel data techniques, can be evaluated to be used.
Third, the study does not consider the impact of some significant events, such as COVID-19. The pandemic has significantly changed the financial markets, and digitalization and remote working have become commonplace processes. Green finance has also established itself in the digital environment. These and similar structural changes undoubtedly affect the structure of GBs. Therefore, future studies can consider such structural breaks when analyzing the relationship between GBs and the environment using Fourier functions and similar econometric methods.
Fourth, although the political environment is implicitly considered in this study, it is not explicitly examined. Since political environment can significantly impact the issuance of GBs, an explicit consideration of the political environment in new studies is strongly recommended.
Finally, fiscal and financial environment as well as some other factors, such as economic growth structure, energy transition, energy-related R&D investments, environmental policy stringency, can have the effect of the carbon neutrality of the countries. So, new studies can evaluate to consider these critical factors in investigating carbon neutrality to make a more comprehensive multivariate modelling. Overall, new studies conducted with the above research propositions can help determine the effectiveness of GBs on a global scale and in detail, and help target green projects.
Responses