Impact of pandemic-related worries on mental health in India from 2020 to 2022

Introduction
The COVID-19 pandemic has presented an unprecedented challenge to not only the physical well-being but also the mental health of individuals1. Global surveys have consistently reported a surge in depression, anxiety, and stress symptoms linked to the COVID-19 pandemic2,3,4,5,6,7. A comprehensive review analyzing 41 studies from various countries, including China, Spain, Italy, Iran, the US, Turkey, Nepal, and Denmark, revealed relatively high occurrences of anxiety (ranging from 6.33 to 50.9%) and depression (ranging from 14.6 to 48.3%)8. This increase in mental health problems extends beyond individuals diagnosed with COVID-19, affecting the wider population as a result of psychosocial stressors like lifestyle disruptions, the fear of contracting the virus, and concerns over potential economic downturns9.
As the world’s second most populous nation, India’s handling of the COVID-19 pandemic is considered pivotal in contributing to the global response to the crisis10. Extant literature suggests that this crisis has been marked by a pronounced surge in the prevalence of adverse mental health among the Indian general population throughout the pandemic period11. A cross-sectional study conducted in April 2020 found that 40.5% of the respondents reported either anxiety or depression12. This marked increase sharply contrasts with the pre-pandemic national depression rate of 2.7% estimated in the National Mental Health Survey of 201513. Several other studies have also emphasized the elevated levels of anxiety and depression experienced by the Indian population during the pandemic. These researchers explored a spectrum of factors associated with mental health outcomes, including age, gender, education, urban–rural residential status, states of residence, and occupations14,15,16,17. Moreover, some studies concentrate on understanding symptoms of mental illness within specific subgroups in India, such as healthcare workers18,19, college students20, migrant laborers21, and pregnant women22.
In the early stages of the pandemic, the Indian government swiftly implemented a nationwide lockdown from March to May 2020, affecting the mobility of over 1.4 billion people. During the second wave in 2021, various states also enforced restrictions on their residents23,24. Rehman et al.25 showed that being unprepared for lockdown was linked to an increase in mental health conditions. The stringent lockdown measures led to the closure of public services, commercial establishments, transportation, and educational facilities. This resulted in a dramatic spike in unemployment rates in India, escalating from 8% in March 2020 to 23% in May 2020, and further to 35% by June 2020, as reported by the Centre for Monitoring Indian Economy26. The year 2020 also saw a significant downturn in the economy, marked by a 7% reduction in Gross Domestic Product (GDP), which was most pronounced in the first quarter with a steep decline of 24%27. These situations may lead to a decline in household income and a scarcity of necessary resources, including food and other essentials. A large-scale study conducted in 2020 among 12 states in India found that ~80% of the households faced a decrease in their food consumption, while over 60% reported insufficient funds to cover a week’s worth of essential expenses28. Another longitudinal study conducted in Uttar Pradesh also reported a significant shift in food security status in 2020, with 62% of households transitioning from being food secure to food insecure29. Financial hardship and food insecurity may also disproportionately impact vulnerable population segments, such as migrant laborers, street vendors, rural inhabitants, and women28,30.
Prior studies have revealed the associations between financial stress, food insecurity, and deteriorating mental health during the COVID-19 pandemic in other countries. Wilson et al.31 found a significant association between heightened financial stress and increased depressive and anxiety symptoms in the United States. Parallel results were reported by Borrescio-Higa et al.32 from a cross-sectional survey conducted in Chile, Blix et al.33 from Norway, and Zajacova et al.34 from Canada. On the other hand, Fang et al.35 highlighted that food insecurity caused by the pandemic was linked to an increased risk of mental illness in the United States. The consistent findings were further affirmed in subsequent publications36,37,38,39. Despite existing research, there is still a notable gap in studies focusing on the general population in India. Lathabhavan40 highlighted financial stress as a key factor linked to depression and anxiety, although their research was confined to small business entrepreneurs. Similarly, Chatterji et al.41 reported comparable results, but the sample of their study was limited to a rural agrarian community in Maharashtra. Moreover, the fear of contracting COVID-19 has also emerged as another risk factor for adverse mental health symptoms. In a survey involving Indian college students, Lathabhavan and Vispute42 discovered an association between the fear of COVID-19-related illness and stress. Worries regarding the illness could significantly contribute to mental health and wellness in India, particularly given the country’s vulnerable healthcare system and inadequate investments during this unprecedented pandemic43.
In this study, we used data from the Global COVID-19 Trends and Impact Survey (CTIS), conducted in collaboration between Meta/Facebook and the University of Maryland, spanning from 2020 to 202244. With its broad coverage of COVID-19-related inquiries, which includes mental health assessments, this survey stands as a key resource for the investigation of mental health trajectories across the world during the pandemic. In the context of the United States, researchers have analyzed both county-level and individual-level data to assess the factors associated with anxiety, depression, and isolation during the pandemic45,46,47,48. In addition, Kush et al.49 observed a higher prevalence of anxiety symptoms among teachers compared to other professions. Expanding the lens globally, Botha et al.50 conducted a study on the trajectories of depression and anxiety across five Australian states from 2020 to 2021. Their research highlighted the mediating roles of financial stress and COVID-19-related illness concerns in the effect of the lockdown on mental health conditions. However, the majority of ongoing studies using the CTIS are primarily focused on the United States, whereas little or no attention has been given to low- or middle-income countries (LMICs) like India. Furthermore, while prior research in India has promptly assessed mental health status during the pandemic’s initial phase12,14, there is a dearth of knowledge regarding mental health trends throughout subsequent periods of the pandemic, which is crucial for assessing the lingering effects of COVID-19.
The primary objective of this research is to investigate the mental health dynamics among Indian adults over the period 2020–2022 during the pandemic. We consider depression and anxiety as the primary outcomes and explore their possible associations with pandemic-related worries, including financial stress, food insecurity, and COVID-19-related illness concerns, after adjusting for demographic variables and calendar time.
The structure of this paper is outlined as follows: “Methods” details the study design, the measures of the variables, and the statistical methods employed in our analysis. “Results” presents the exploratory and analytical results. Finally, “Discussion” delves into a discussion of the reported findings and limitations of this study.
Methods
Study design
In our study, we used non-aggregated data sourced from the Global COVID-19 Trends and Impact Survey (CTIS)44. Daily, it invited a stratified random sample of adults from the Facebook Active User Base (FAUB) to complete a cross-sectional questionnaire. The questionnaire covered various aspects of the COVID-19 pandemic, including mental health, pandemic-related worries, demographics, and more. To ensure the survey respondents accurately represented the general adult population, Facebook implemented a two-fold weighting strategy51,52. First, non-response weights were calculated using an inverse propensity score weighting method. This adjustment was made to mitigate potential non-response bias, thereby enhancing the representativeness of the survey participants within the FAUB. Second, post-stratification weights were applied to align the survey data with the United Nations (UN) Population Division’s 2019 World Population Projection in terms of age and gender. This step was to address the non-coverage bias arising from inactive Facebook users or those without internet access. For our research, we accessed individual response data and the corresponding weights through a Data User Agreement with the University of Maryland from its data repository53. This paper is deemed exempt by the Institutional Review Board (IRB) because it involves secondary data analysis based on data from the CTIS.
The CTIS initiated inquiries into mental health outcomes on April 23, 2020, and expanded to cover financial stress, food insecurity, and COVID-19-related health concerns starting June 27, 2020. Our study used responses from June 27, 2020 (the first date when the relevant data became available), up to the last data collection day on June 25, 2022 (N = 2,576,174 adult respondents in India; average sample size around 25,000/week). A major alteration in survey structure occurred on May 20, 2021, involving the randomization of respondents into two different question modules instead of responding to all questions. Specifically, questions pertaining to mental health, financial stress, and food insecurity were included in only one of these two modules, and inquiries about COVID-19 health concerns were phased out from the survey. This structural shift resulted in discontinuities in several survey estimates53, prompting us to divide our analysis into two distinct periods: June 27, 2020, to May 19, 2021 (referred to as Period 1; N = 1,532,776), and May 20, 2021, to June 25, 2022 (referred to as Period 2; N = 1,043,398). Only complete cases from both Period 1 (N = 595,229) and Period 2 (N = 152,767) were used for modeling (Supplementary Fig. 1).
Measures
Outcomes
We investigated two commonly studied mental health outcomes: depression and anxiety. Self-reported depression was assessed with the question, “During the last 7 days, how often did you feel so depressed that nothing could cheer you up?” For self-reported anxiety, participants were asked, “During the last 7 days, how often did you feel so nervous that nothing could calm you down?” Responses were recorded on a 5-point scale: 1 = “all the time”, 2 = “most of the time”, 3 = “some of the time”, 4 = “a little of the time”, 5 = “none of the time”. These questions were adapted from the Center for Epidemiological Studies Depression Scale (CES-D) and the Generalized Anxiety Disorder-7 (GAD-7), which are widely acknowledged for screening depression and anxiety, respectively54,55. These short-form, single-item adaptations of the aforementioned scales reflect self-reported symptoms of depression and anxiety and do not reflect clinical diagnoses of related psychiatric health conditions (e.g., major depressive disorder and general anxiety disorder). The phrasing of the survey questions and the initial participant responses are detailed in Supplementary Table 1. For the analysis, we dichotomized the responses into binary indicators: 0 for “some, a little, or none of the time”, and 1 for “all or most of the time”, aligning with prior research46,48,49,50.
Primary exposures
The primary exposures were subjective worries about the pandemic, assessed through three aspects: financial stress, food insecurity, and COVID-19-related illness concerns (Supplementary Table 1). Financial stress was assessed using the question, “How worried are you about your household’s finances in the next month?”. For food insecurity, participants were asked, “How worried are you about having enough to eat in the next week?” In terms of COVID-19-related illness concerns, the question posed was, “How worried are you that you or someone in your immediate family might become seriously ill from coronavirus (COVID-19)?” Responses were recorded on a 4-point scale: 1 = “very worried”, 2 = “somewhat worried”, 3 = “not too worried”, 4 = “not worried at all”. For the analysis, we dichotomized the responses into binary indicators: 0 for “somewhat worried, not too worried, or not worried at all”, and 1 for “very worried”, in alignment with existing literature48,50.
Other covariates
Demographic information often used as covariates was also collected from the respondents (Supplementary Table 1). Gender was self-reported and categorized into “male”, “female”, “other”, and “prefer not to answer”. In our analysis, we considered gender as a binary variable, excluding those who reported “other” (N = 1593; 0.01%) or preferred not to answer (N = 12,534; 0.05%). Age was categorized into groups: 18–24, 25–34, 35–44, 45–54, 55–64, 65–74, and 75+ years old. Due to the limited sample size, we combined 65–74 and 75+ years old into a group of 65+ years old. Regarding educational attainment, participants were initially asked to report the number of years of education completed via an open-ended question in Period 1. In Period 2, this was changed to a multiple-choice question asking for the highest level of education completed. To mitigate potential measurement errors, we only included non-negative responses below a reasonable threshold (50 years) in Period 1 for analysis. For consistency, we dichotomized education responses in the two periods into binary indicators: 0 for less than a high school degree (less than 12 years) and 1 for a high school degree or more (12 years or more). The residential status was converted from a categorical response to a binary indicator: 0 denoting rural settings (village or rural), and 1 denoting urban environments (city or town). Respondents reported their Indian state or territory of residence, which we grouped into six regions based on the divisions by the zonal councils. Occupations were analyzed as a categorical variable, including agriculture, construction, education, health, tourism, transportation, and others.
Statistical methods
For the exploratory analysis, we utilized the full sample for both periods (Supplementary Fig. 1). First, we calculated both unweighted and weighted summary statistics for demographic factors, worries about the pandemic, and mental health outcomes. We used weights provided by Facebook to account for non-response and non-coverage bias, as mentioned in the previous section. In addition, we provided demographic proportions among FAUB, estimated by the Facebook advertising tools56, and those of the general Indian adult population, sourced from the latest Census (2011) or National Sample Survey57. Second, to assess the unadjusted correlations between mental health outcomes and worry variables without applying weights, we calculated both the Kendall rank correlation coefficients and Pearson correlation coefficients. Third, we generated time-series plots illustrating the trajectories of depression and anxiety over time. These plots were constructed using weekly weighted proportions after computing the 7-day rolling averages. To complement these visualizations, we also presented time-series plots depicting weekly new confirmed COVID-19 cases and weekly new COVID-19-related deaths in India, sourced from the Johns Hopkins Coronavirus Resource Center58.
For the statistical analysis, we fitted separate survey-weighted logistic regression models for depression and anxiety as outcomes within each period, using the complete cases only. First, we constructed unadjusted models, each incorporating a single covariate from pandemic-related worries (financial stress, food insecurity, and COVID-19-related illness concerns), demographics (gender, age, education, urban–rural residential status, region, and occupation), and calendar time (categorized by month and year). Second, we fit partially adjusted models with a single exposure (namely using one worry variable at a time) and all other covariates (demographics and time). Third, we formulated fully adjusted models integrating all three worry variables simultaneously and adjusting for the covariates. Fourth, we added the interaction term between gender and each worry exposure separately within the fully adjusted models, aiming to examine whether the association between pandemic-related worries and mental health outcomes varies by gender. Fifth, we explored whether the associations between exposures and mental health symptoms were modified by reported urban vs. rural residential status, by adding the interaction term between residential status and each of the worry exposures separately to the fully adjusted model. Sixth, we assessed the interaction between time and pandemic-related worries on psychological distress, by introducing time interactions with each of the three primary exposures separately, alongside the fully adjusted models. We employed robust sandwich estimators for variance and conducted the Wald test to investigate statistical significance. The analysis was performed using the survey R package59 in R version 4.3.2.
Results
Descriptive statistics
Table 1 presents a summary of both unweighted and weighted statistics for the variables within the full sample (N = 2,576,174 respondents aged ≥18 years in India). Regarding mental health outcomes, the weighted proportions of respondents experiencing feelings of depression and anxiety were 8% and 6%, respectively, in both periods. In terms of subjective worries, in Period 1, 21% of the respondents post-weighted reported financial stress, 8% reported food insecurity, and 24% reported COVID-19-related illness concerns. Period 2 showed similar weighted statistics (17% for financial stress; 8% for food insecurity), except that COVID-19-related illness concerns were discontinued from the survey at this time. Notably, the demographics of the CTIS respondents, even after applying weights (considering age and gender), did not align accurately with the general Indian adult population. Specifically, the weighted sample had a larger proportion of males (66% in Period 1 and 57% in Period 2, as opposed to 52% in the census), people aged between 25 and 34 years (37% in Period 1 and 31% in Period 2, compared to 27% in the census), people having education levels of at least high school (83% in Period 1 and 93% in Period 2, as opposed to 27% in the census), and people residing in urban areas (75% in Period 1 and 75% in Period 2, compared to 31% in the census).
We analyzed the unadjusted correlations between the outcomes and primary exposures using the full sample (N = 2,576,174) and the complete Likert scales (5-point scale for depression and anxiety, and 4-point scale for worry variables), without applying weights. For the outcomes, the responses for depression and anxiety were moderately correlated, with Kendall rank correlation coefficients of 0.59 in Period 1 and 0.58 in Period 2 (Supplementary Table 2). For the exposures, financial stress and food insecurity were moderately correlated, while both were weakly correlated with COVID-19-related illness concerns. For instance, the Kendall rank correlation between financial stress and food insecurity was 0.55 in Period 1, compared to 0.25 between financial stress and COVID-19-related illness concerns (Supplementary Table 2). Additionally, depression and anxiety showed weak correlations with pandemic-related worries. For example, the Kendall rank correlation between depression and financial stress was 0.20 in Period 1 and 0.24 in Period 2 (Supplementary Table 2). Similar patterns were observed with Pearson correlation coefficients (Supplementary Table 2). Pearson correlation coefficients showed upward inflation compared to Kendall rank correlation coefficients as expected.
Figure 1 illustrates the weekly weighted prevalence of depression and anxiety from June 27, 2020, to June 25, 2022, using the full sample (N = 2,576,174). The vertical dashed line marks the time of the major change in the survey structure. Notably, there were three peaks in both the weekly new cases and deaths during the study period, occurring approximately in September 2020, May 2021, and January 2022. During the second wave in May 2021, there was a noticeable increase in the prevalence of self-reported depression (10.11%) and to some extent for anxiety (7.61%), compared to January 2021 (7.58% for depression and 5.80% for anxiety). This shows a concurrent worsening in self-reported mental health outcomes during the peak of the second COVID-19 wave. However, this pattern was not as prominent during the first and third waves. When comparing the weighted proportions of individuals experiencing depression and anxiety at the start and end of the study period, the values in 2022 (8.29% for depression and 6.17% for anxiety) were higher than those observed in 2020 (7.24% for depression and 4.77% for anxiety). This underscores the enduring impact of the pandemic-related concerns on mental health within the Indian population.

The full sample was used to calculate the proportions of mental health outcomes. Facebook-provided weights were applied to account for non-response and coverage bias. A 7-day smoothing method was used to calculate the weighted averages. COVID-19 case and death data were sourced from the Johns Hopkins Coronavirus Resource Center. A vertical dashed line marks the major survey structure change on May 20, 2021.
Our gender-stratified analysis revealed notable distinctions in the weighted proportions. Regarding self-reported mental health problems, females showed a higher prevalence of depression than males in both Period 1 (10% vs. 6%) and Period 2 (9% vs. 8%), as well as increased anxiety in Period 1 (7% vs. 5%). Regarding the worry variables, males reported greater concerns about their financial situation (23% vs. 18% in Period 1; 19% vs. 14% in Period 2) and food status (9% vs. 6% in Period 1; 9% vs. 5% in Period 2) compared to females.
Likewise, we examined urban–rural differences in weighted proportions. In Period 1, the incidence of self-reported depression and anxiety among rural residents mirrored that of urban dwellers (8% vs. 8% for depression and 5% vs. 5% for anxiety), whereas Period 2 saw a higher occurrence in rural areas (9% vs. 8% for depression and 7% vs. 5% for anxiety). Concerning pandemic-related worries, rural individuals consistently reported greater levels of financial stress (28% vs. 19% in Period 1; 25% vs. 15% in Period 2) and food insecurity (12% vs. 7% in Period 1; 13% vs. 6% in Period 2) compared to urban residents.
Associations between worry variables and mental health outcomes
Table 2 displays the odds ratios for worry variables (considered as exposures) obtained from weighted logistic regression analyses. The analysis was based on complete cases from two distinct periods: Period 1 (N = 595,229) and Period 2 (N = 152,767). Here, we first report results from the fully adjusted models that concurrently incorporated all worry variables and other covariates, namely demographic factors and calendar time. The results from the fully adjusted models in Period 1 indicate significant associations between all three subjective worries (financial stress, food insecurity, and COVID-19-related illness worries) and mental health problems (both depression and anxiety). Notably, financial stress emerged as the most influential factor among the three worries. In particular, the odds of experiencing depression and anxiety were 2.36 (95% confidence interval, CI: [2.27, 2.46]) and 1.91 (95% CI: [1.81, 2.01]) times higher for those concerned about their financial situation compared to those without such worries, after adjusting for other variables, respectively. Individuals reporting food insecurity had higher adjusted odds for depression (odds ratio: 1.45, 95% CI: [1.38, 1.53]) and anxiety (odds ratio: 1.56, 95% CI: [1.47, 1.66]) compared to those without this concern. Similarly, the adjusted odds ratios regarding COVID-19-related illness worries were 1.65 (95% CI: [1.59, 1.71]) for depression and 1.81 (95% CI: [1.73, 1.90]) for anxiety.
As depicted in the second part of Table 2, both financial stress and food insecurity had significant associations with mental health problems in the fully adjusted models in Period 2, mirroring findings from Period 1. Particularly, after accounting for all other variables, individuals experiencing financial stress had higher odds of feeling depressed (odds ratio: 2.52, 95% CI: [2.30, 2.77]) and anxious (odds ratio: 1.91, 95% CI: [1.70, 2.15]) compared to those without financial stress. Likewise, individuals reporting concerns about food insecurity exhibited significantly elevated adjusted odds of experiencing depression (odds ratio: 2.32, 95% CI: [2.07, 2.60]) and anxiety (odds ratio: 2.71, 95% CI: [2.31, 3.11]) compared to those without this concern.
In addition to the fully adjusted models, Table 2 presents outcomes from two other model types for each worry variable: unadjusted models, which only include a single exposure, and partially adjusted models, which include one exposure at a time together with demographic factors and calendar time. The comparisons across the three models for both periods highlight differences in the results. Notably, the odds ratios for all worry variables, consistently significant across models, were higher in the unadjusted models for both depression and anxiety. These values diminished in the partially adjusted models and were further reduced in the fully adjusted models. Taking financial stress as an example, in Period 1, individuals reporting financial stress had a 3.45 (95% CI: [3.34, 3.57]) times higher odds of experiencing depression compared to those without such worries, as indicated by the unadjusted model. This odds ratio decreased to 3.03 (95% CI: [2.93, 3.14]) with adjustments for demographics and calendar time, and further dropped to 2.36 (95% CI: [2.27, 2.46]) with additional adjustments for food insecurity and concerns about COVID-19-related illness. The ranking of the worry variables by their odds ratios also varied depending on whether adjustments were made, even within the same period and for the same outcome. For instance, in the first period, food insecurity showed the highest odds ratios for experiencing anxiety in both unadjusted (odds ratio: 3.29, 95% CI: [3.14, 3.45]) and partially adjusted models (odds ratio: 2.98, 95% CI: [2.83, 3.13]). Yet, in the fully adjusted models, the odds ratio for food insecurity (odds ratio: 1.56, 95% CI: [1.47, 1.66]) was lower than that for financial stress (odds ratio: 1.91, 95% CI: [1.81, 2.01]).
Associations between other demographics covariates and mental health outcomes
Supplementary Table 3 and Supplementary Table 4 present odds ratios of other covariates derived from weighted logistic regression models for both unadjusted models, featuring a single covariate, and fully adjusted versions that incorporate a complete set of relevant covariates, including the collective inclusion of all three worry variables. In Period 1, the analysis of fully adjusted models, as presented in Supplementary Table 3, revealed significant relationships between demographic factors—such as gender, age, urban–rural residential status, geographical region, and occupation—and the prevalence of depression or anxiety. Key findings indicate that factors associated with poorer mental health outcomes include being female, being in the young adult age group, residing in urban areas, hailing from the southern regions, and engaging in occupations outside the agricultural sector. Notably, after controlling for other variables, individuals employed in the education sector had 1.23 (95% CI: [1.14, 1.34]) and 1.30 (95% CI: [1.18, 1.43]) times higher odds of reporting depression and anxiety, respectively, compared to those in agriculture. Similarly, those working in the tourism industry faced 1.55 (95% CI: [1.36, 1.77]) and 1.46 (95% CI: [1.24, 1.71]) times higher odds of experiencing depression and anxiety, respectively, in comparison to agricultural workers.
In Period 2, the influence of demographic variables on depression and anxiety mirrored the results observed in Period 1, with significant associations identified for gender, age, residential status, geographic region, and occupation after adjusting for other factors (Supplementary Table 4). This period also highlighted the significance of education, a factor not previously noted in Period 1. Notably, the fully adjusted models showed that individuals without a high school diploma had a 1.24 (95% CI: [1.11, 1.39]) and 1.17 (95% CI: [1.04, 1.32]) times higher odds of experiencing depression and anxiety, respectively, compared to individuals with at least a high school education.
Effect modification by gender on the associations between worry variables and mental health outcomes
Our analysis explored potential modification of the associations between three pandemic-related worries on depression and anxiety by self-reported gender, by adding an interaction term between gender and each of the worry variables separately into our fully adjusted survey-weighted model. Figure 2 and Supplementary Table 5 illustrate the odds ratios for depression and anxiety across different worry variables within each gender, after adjusting for other worries, demographic factors, and calendar time. Throughout both periods, every pandemic-related worry variable demonstrated a significant association with mental health problems in both genders from the fully adjusted survey-weighted models. In Period 1, females had a significantly lower odds ratio of reporting depression and anxiety compared to males regarding the same concern (Pint <0.01, where Pint denotes the P value corresponding to the gender by worry interaction term in the fully adjusted model). Specifically, in terms of concerns about financial status, the odds ratios for feeling depressed and anxious were 2.03 (95% CI: [1.88, 2.19]) and 1.74 (95% CI: [1.58, 1.91]) for females, respectively, lower than the corresponding odds ratios for males, which were 2.59 (95% CI: [2.49, 2.70]) and 2.02 (95% CI: [1.92, 2.12]). Similarly, the odds ratios regarding food insecurity for depression and anxiety were 1.21 (95% CI: [1.07, 1.36]) and 1.32 (95% CI: [1.16, 1.51]) for females, respectively, again lower than those for males, who showed odds ratios of 1.56 (95% CI: [1.49, 1.64]) for depression and 1.67 (95% CI: [1.57, 1.77]) for anxiety. In Period 2, the smaller sample size resulted in wider confidence intervals, leading to no statistically significant gender differences in the odds ratios for the worry variables (for depression, Pint = 0.17 in finance stress and Pint = 0.43 in food insecurity; for anxiety, Pint = 0.34 in finance stress and Pint = 0.70 in food insecurity), despite varying point estimates.
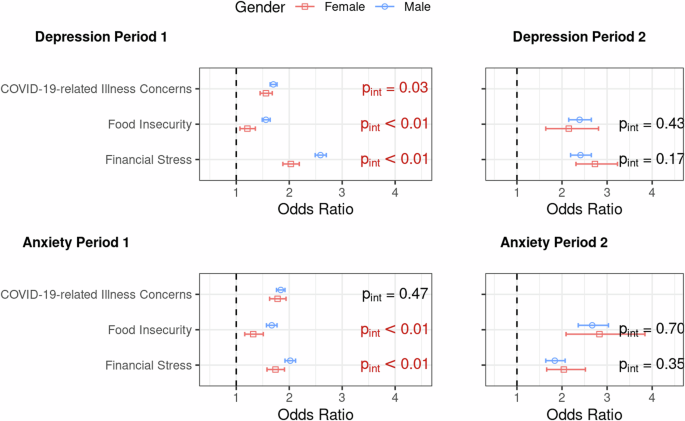
Due to the significant survey structure change on May 20, 2021, the analysis was split into two periods: Period 1 (June 27, 2020, to May 19, 2021) and Period 2 (May 20, 2021, to June 25, 2022). Complete cases from each period were analyzed using separate fully adjusted models that included pandemic-related worries (financial stress, food insecurity, and COVID-19-related illness concerns), demographics (gender, age, education, urban–rural residential status, region, and occupation), and calendar time (categorized by month and year), with each model also adding an additional interaction term between gender and one of worry variables. Presented are odds ratios and their corresponding 95% Wald confidence intervals. Significant interaction terms (Pint) from Wald tests (significance level: 0.05) are highlighted in red. All models integrate survey weights within the logistic regression. Robust sandwich estimators were used for variance calculation. The vertical dashed line denotes the odds ratio of 1.
Effect modification by urban–rural residential status on the associations between worry variables and mental health outcomes
We also examined how urban and rural residents were differently affected by three specific pandemic-related worries in terms of self-reported depression and anxiety. We added an interaction term for residential status and each worry variable separately into the fully adjusted model, accounting for survey weights. Figure 3 and Supplementary Table 6 display the odds ratios for depression and anxiety associated with each worry variable within urban and rural settings, after controlling for other worries, demographic factors, and calendar time. Consistently, across both urban and rural contexts, each worry variable was significantly linked to mental health challenges. In Period 1, urban dwellers exhibited greater odds ratios of experiencing depression and anxiety regarding all of the three COVID-19-related worries than rural residents, with statistically significant interaction terms (Pint <0.01) observed in all models. For instance, in terms of financial stress, urban individuals showed odds ratios of 2.44 (95% CI: [2.33, 2.56]) for depression and 1.98 (95% CI: [1.87, 2.09]) for anxiety, surpassing the odds ratios for rural residents, which stood at 2.12 (95% CI: [1.98, 2.26]) and 1.71 (95% CI: [1.58, 1.86]), respectively. In Period 2, urban residents continued to report significantly higher odds of depression and anxiety regarding these worries when compared to rural residents (for depression, Pint <0.01 in finance stress; for anxiety, Pint <0.01 in finance stress and Pint = 0.03 in food insecurity) expect the case with food insecurity for depression (Pint = 0.31). For example, in terms of worries about the financial situation, the odds ratios for urban individuals were 2.80 (95% CI: [2.52, 3.12]) for depression and 2.19 (95% CI: [1.92, 2.50]) for anxiety, which were higher than those for rural individuals, with odds ratios of 1.98 (95% CI: [1.73, 2.26]) for depression and 1.41 (95% CI: [1.20, 1.66]) for anxiety).
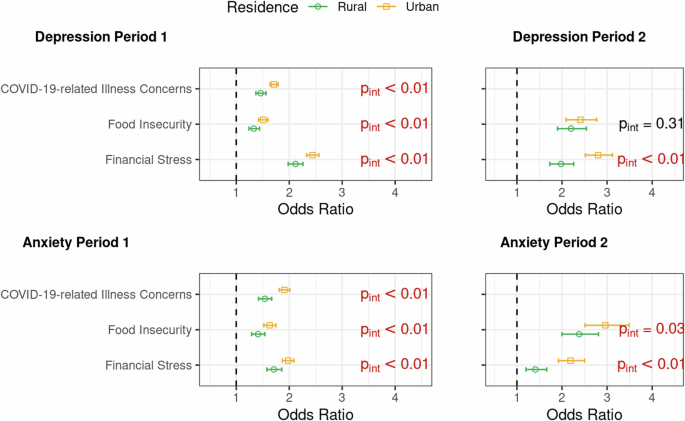
Due to the significant survey structure change on May 20, 2021, the analysis was split into two periods: Period 1 (June 27, 2020, to May 19, 2021) and Period 2 (May 20, 2021, to June 25, 2022). Complete cases from each period were analyzed using separate fully adjusted models that included pandemic-related worries (financial stress, food insecurity, and COVID-19-related illness concerns), demographics (gender, age, education, urban–rural residential status, region, and occupation), and calendar time (categorized by month and year), with each model also adding an additional interaction term between residential status and one of worry variables. Presented are odds ratios and their corresponding 95% Wald confidence intervals. Significant interaction terms (Pint) from Wald tests (significance level: 0.05) are highlighted in red. All models integrate survey weights within the logistic regression. Robust sandwich estimators were used for variance calculation. The vertical dashed line denotes the odds ratio of 1.
Temporal variation in the associations between worry variables and mental health outcomes
We further delved into how the impact of the three subjective worries on depression and anxiety evolved over time by introducing interaction terms for time (categorized by month and year) with each worry variable individually into our fully adjusted survey-weighted models. Figure 4 presents the adjusted odds ratios for financial stress, food insecurity, and COVID-19-related concerns in relation to feeling depressed and anxious across time, in both periods. Vertical dashed lines represent the timing of the three peaks in newly confirmed COVID-19 cases and COVID-19-related deaths (September 2020, May 2021, and January 2022). During Period 1, financial stress emerged as the most influential factor affecting both depression (the range of odds ratios: [2.02, 2.71]) and anxiety (the range of odds ratios: [1.59, 2.19]), after adjusting for other variables. Although no discernible temporal patterns were evident for financial stress and food insecurity, there was a notable upswing in the odds ratios regarding COVID-19-related health concerns of reporting depression (odds ratio: 2.13, 95% CI: [1.90, 2.39]) and anxiety (odds ratio: 2.25, 95% CI: [1.98, 2.56]) during the second wave in May 2021 compared to the previous month (odds ratio 1.62, 95% CI: [1.46, 1.80] for depression and odds ratio: 1.73, 95% CI: [1.54, 1.94] for anxiety). During Period 2, the interpretation of time trends is constrained due to the smaller sample size, resulting in wider confidence intervals compared to Period 1. For anxiety, the point estimates for the effects of food insecurity (the range of adjusted odds ratios: [2.34, 3.75]) consistently surpassed those for financial stress (the range of adjusted odds ratios: [1.60, 2.43]) over time, while no significant differences were observed between these two sources of worry concerning depression.
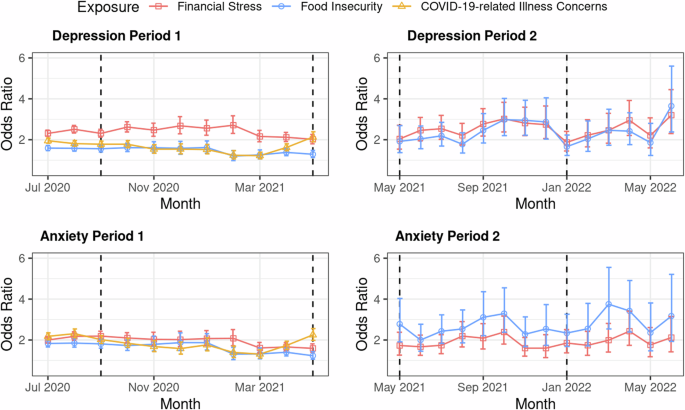
Due to the significant survey structure change on May 20, 2021, the analysis was split into two periods: Period 1 (June 27, 2020, to May 19, 2021) and Period 2 (May 20, 2021, to June 25, 2022). Complete cases from each period were analyzed using separate fully adjusted models that included pandemic-related worries (financial stress, food insecurity, and COVID-19-related illness concerns), demographics (gender, age, education, urban–rural residential status, region, and occupation), and calendar time (categorized by month and year), with each model also adding an additional interaction term between time and one of worry variables. Presented are odds ratios and their corresponding 95% Wald confidence intervals. All models integrate survey weights within the logistic regression. Robust sandwich estimators were used for variance calculation. Vertical dashed lines denote the three peaks in new COVID-19 confirmed cases and related deaths in September 2020, May 2021, and January 2022, respectively. Due to limitations in sample size, data from June 2020 were merged with the June 2021 category.
Discussion
We summarize the main findings of our study. To our knowledge, this is the first study in India to examine mental health trends over an extended period, from 2020 to 2022, using a large-scale sample drawn from the nationwide general adult population. Our findings indicate a significant association between pandemic-related worries (financial stress, food insecurity, and COVID-19-related health concerns) and self-reported symptoms of depression and anxiety. Additionally, we identified gender, urban–rural residence, and calendar time as potential effect modifiers of these associations. Our results advocate for the inclusion of financial allowances, subsidies, and food rations within public health prevention strategies60. Effective policymaking should not only focus on saving lives from the disease but also on safeguarding livelihoods and ensuring social protection for the future.
In addition, data paucity and opacity have hindered effective real-time policymaking in India. While nationally representative panel studies launched nimbly during a public health crisis are the gold standards, social media platforms such as Facebook, despite their systematic biases, can be deployed to collect “quick and dirty” data on a large user base. However, caution must be exercised regarding the type of information that can be meaningfully extracted from these biased but large datasets. Our findings suggest CTIS surveys provide insight into relative association measures between self-reported depression and anxiety with specific worry variables. Although the point estimates may be biased for a given association, the entire analysis in totality enhances our understanding of the human experience during a pandemic.
The significant associations between worry variables and mental health outcomes observed in our study align with previous research conducted on specific subgroups within India28,29 and parallel findings from studies in other countries31,35. Notably, financial stress emerged as the most significant factor affecting mental health during the first phase of our study period (June 27, 2020, to May 19, 2021) when adjusting for other worries, demographics, and time. Individuals concerned about their financial situation were found to have higher odds of experiencing depression (adjusted odds ratio: 2.36, 95% CI: [2.27, 2.46]) and anxiety (adjusted odds ratio: 1.91, 95% CI: [1.81, 2.01]), compared to those without such worries. This heightened impact of financial stress may be attributed to India’s economic structure, which is heavily dependent on low-wage informal labor and lacks robust social security measures to mitigate the negative effects of economic hardships among individuals61. Since financial stress may be correlated with and affected by an individual’s financial condition, we conducted a sensitivity analysis of the weighted regression results for this specific worry variable, adjusting for an indicator of the household situation (Supplementary Table 7). This new survey question inquires about “the number of bedrooms used for sleeping in current home” and may be considered as an economic indicator. The odds ratios corresponding to financial stress remained largely unchanged with this additional adjustment, indicating the robustness of our findings to economic status.
Our findings underscore gender differences in the prevalence of mental health problems and their associations with pandemic-related worries. Females had higher adjusted odds of both depression and anxiety compared to males. In Period 1, the adjusted odds ratio for depression was 1.52 (95% CI: [1.45, 1.59]), and for anxiety, it was 1.35 (95% CI: [1.28, 1.42]). This is consistent with earlier findings in India41. Pre-pandemic studies showed that men were 1.96 times more likely to visit tertiary healthcare centers than women62, suggesting fewer opportunities for mental health screenings among women. Since regular healthcare visits are strongly linked to better mental health outcomes, this disparity may help explain the higher prevalence of mental health issues in females.
However, interaction analysis revealed that females had significantly lower odds ratios for both depression and anxiety in relation to the same pandemic-related worries compared to males. For instance, regarding financial concerns, the odds ratios for depression and anxiety in females were 2.03 (95% CI: [1.88, 2.19]) and 1.74 (95% CI: [1.58, 1.91]), respectively, which were lower than the corresponding odds ratios for males: 2.59 (95% CI: [2.49, 2.70]) for depression and 2.02 (95% CI: [1.92, 2.12]) for anxiety. Such gender differences in odds ratios are consistent with findings from both COVID-19-related41 and other research63. These findings may reflect the influence of gender socialization roles64, where financial concerns might play a more central role in male social identities65.
Our analysis revealed distinct urban–rural differences in the reported rates of depression and anxiety, along with how these mental health problems were linked to worry variables. Specifically, in Period 1 and without including interaction terms in our fully adjusted survey-weighted models, we observed that rural individuals were less likely to report depression and anxiety compared to urban individuals, with odds ratios of 0.82 (95% CI: [0.79, 0.85]) for depression and 0.89 (95% CI: [0.84, 0.93]) for anxiety. These findings align with similar observations made in China during the COVID-19 pandemic66 and previous research conducted in India before the pandemic67,68. Furthermore, our results indicate that urban residents had higher odds ratios of self-reported mental health problems than rural residents regarding the same pandemic-related concern. This increased vulnerability among urban dwellers may stem from greater exposure to policies enforcing social isolation66. COVID-19-related research in India has also underscored the significant impact of the pandemic on immigrant workers in urban areas, who were among the most affected groups21,28 In addition, we investigated three-way interactions involving gender, residential status, and worry variables (Supplementary Table 8 and Supplementary Table 9). However, the interpretability of these findings is constrained by the relatively small sample size available for each specific group.
We further examined changes over time in the prevalence of self-reported depression and anxiety and their association with pandemic-related worries. Notably, during the second wave of the pandemic in May 2021, there was a significant rise in the proportion of individuals self-reporting depression and anxiety. The adjusted odds ratios for both of these outcomes, in relation to COVID-19-related health concerns, also showed a substantial increase. This suggests that as new cases and deaths surged, heightened fears of infection likely made individuals more vulnerable to worsened mental health. This period (May 2021) coincided with a severe public health crisis in India, marked by an overwhelmed healthcare infrastructure and a dramatic rise in hospital admissions69. The crisis was further exacerbated by the emergence of the B.1.617.2 sub-lineage, first identified in India, which the World Health Organization classified as a Variant of Concern in early May70.
In our analysis, we divided the study timeframe into two distinct periods, with the demarcation set for May 20, 2021, due to significant alterations in the format of the survey. The exploratory and statistical analysis revealed some discrepancies between these intervals. Specifically, the weighted prevalence rates for depression and anxiety in 2022 were substantially higher (8.29% for depression and 6.17% for anxiety) compared to those in 2020 (7.24% for depression and 4.77% for anxiety). In addition, we observed variations in the odds ratio point estimates for worry variables. It is crucial to acknowledge the different phases of the pandemic these periods represent. For instance, the general availability of the COVID-19 vaccine in India commenced on May 1, 202171, coinciding with the end of Period 1. Existing literature highlights the impact of COVID-19 vaccination on mental health outcomes48,72, suggesting varying vaccination rates may contribute to the differences observed between the periods. Furthermore, external factors unrelated to the pandemic, such as political events like a general election, may also affect the prevalence of mental health disorders73. Therefore, careful consideration is necessary when interpreting and comparing the findings across these distinct periods.
Some existing psychiatric literature suggests that anxiety is a symptom of depression74. To assess whether the two questions regarding depression and anxiety in CTIS measure the same latent variable, we calculated Cronbach’s alpha between these two outcomes. The alpha value was 0.78 in Period 1 and 0.79 in Period 2, which is considered acceptable evidence of a common underlying construct in standard practice75. When we combined the two scales into one construct (coding responses of “all or most of the time” to either the depression or anxiety question as one), the odds ratios for the combined outcome, corresponding to the worry variables, remained similar to those for the depression scale in fully adjusted models after weighting. The results are presented in Supplementary Table 10.
We chose to report the two outcomes separately for two primary reasons. First, there is extensive literature in psychiatry detailing shared and distinct characteristics of depression and anxiety symptoms76,77. Second, most papers based on CTIS and other datasets report results corresponding to these two outcomes separately45,46,48,49,50. For purposes of cross-country comparison or potential future meta-analyses, reporting comparable estimates is preferred.
Despite the serial (weekly) cross-sectional design of our study, with some overlap among the study sample across weeks, determining whether specific worries or depression/anxiety come first is nearly impossible. Thus, our analysis is purely correlative. The selection of dependent and independent variables (outcomes and exposures) was made to align with prior research describing the relationship between worry variables and mental health outcomes31,35. Our approach of treating the domain-specific worry variables as explanatory variables is consistent with how existing studies have modeled these associations (Supplementary Table 11). In a sensitivity analysis where we swapped the roles of our independent and dependent variables, the strong associations remained unchanged.
Our study has important limitations due to its reliance on a non-probability, self-selected sample of participants who are active Facebook users in India. Despite constructing and using two sets of weights to address non-response and non-coverage bias51,52, the summary characteristics of the weighted sample (for example, urban–rural residential status) do not fully align with those of the target adult Indian population. The weights provided by Facebook were not sufficient to ensure the representativeness of either the Facebook Active User base (sampling frame) or the general Indian population (target population), as they accounted only for age and gender. Moreover, it is well-documented that Facebook/social media users are more prone to consuming negative information than the general population3, which may result in higher levels of worry among this group. This raises critical concerns about selection bias and the generalizability of our results to the adult Indian population. Given the large sample size, the Big Data Paradox suggests that our prevalence estimates for depression, anxiety, and worry may deviate significantly from the true population values, amplified with misleadingly narrow confidence intervals78.
For example, the weighted prevalence rates for depression (7.55%, 95% CI: [7.47%, 7.64%]) and anxiety (5.49%, 95% CI: [5.41%, 5.56%]) in Period 1 may not accurately reflect the general population and are notably lower than estimates from previous studies79. A similar pattern is observed with the worry variables, where the weighted proportion of individuals experiencing financial stress in Period 1 (21.3%, 95% CI: [21.1%, 21.4%]) is also lower than previously reported numbers80. However, it is important to emphasize that the primary goal of our study was not to provide unbiased prevalence estimates but rather to examine the associative relationships between key variables and their changes over time on a relative scale. As Yang et al.81 highlight, the Big Data Paradox tends to have a reduced impact when the estimand shifts from overall population averages to analyzing successive trends and subgroup differences in population means. We believe that despite the concerns regarding generalizability, characterizing relative trends and associations with data from India over a long period during the pandemic is an important contribution.
Another major limitation in our analysis is that the mental health outcomes reported in the CTIS, which we used as outcomes, are self-reported and should not be interpreted as clinical diagnoses or as reflective of a medical history of depression or anxiety disorders. These responses capture subjective experiences rather than formal assessments by healthcare professionals. Therefore, the associations we report are, at best, associations with a coarse measurement of the underlying true outcome and should only be considered as proxies. Likewise, the self-reported nature of gender and residential status could also introduce measurement errors. In addition, the same respondents were not followed over time in the CTIS data, which precluded the application of formal longitudinal methods. Moreover, to conform to the existing literature, in our regression models, we dichotomized the outcome and primary exposures, which were originally measured on 5-point and 4-point Likert scales, respectively. Dichotomizing any scale leads to loss of information. Our correlation analysis using the full Likert scale exhibited similarly strong associations. Although future research could benefit from using probabilistic survey samples for greater representativeness of the general population with more rigorous screening, we argue that our study offers a detailed and informative insight into the trends in mental health throughout the pandemic period in India.


Responses