Impact of truck electrification on air pollution disparities in the United States
Main
At face value, electrifying heavy-duty trucks, whose externalities fall disproportionately on historically marginalized racial–ethnic groups and disadvantaged communities, should advance environmental justice across the United States. However, the net impact of heavy-duty truck charging on electricity generation and power plant emissions is both uncertain and likely to shift over time. Like trucks, the air pollutant emissions from power plants have been shown to disproportionately affect disadvantaged communities, as fossil-fuel power plants are more likely to be located in or near historically marginalized areas1,2. This paper fills a gap in the literature by answering the question of whether electrifying Class 8 heavy-duty trucks will reduce the absolute and relative air-pollution-related health burdens in disadvantaged communities and across different racial–ethnic groups over time with an evolving electricity grid mix.
Trucks haul 72% of freight by value, 71% by tonnage and 43% by ton-mile in the United States3, enabling the movement of goods between supply and demand centres, but they also contribute to air pollution exposure disparities and associated health effects4,5,6,7. Numerous studies have found that the emissions from heavy-duty trucks disproportionately affect disadvantaged communities5,8,9. These emissions consist of primary fine particulate matter (PM2.5) and relevant precursors for formation of secondary PM2.5 such as nitrogen oxides (NOx). Heavy vehicles (gross vehicle weight rating (GVWR) > 8,500 pounds) contribute 50% of on-road PM2.5 and 43% of on-road NOx emissions10. These emissions lead to an estimated 7,700–8,600 deaths annually from medium- and heavy-duty trucks combined (Class 3–8) across all routes11,12. Of these, 500–900 deaths are attributable to select Class 8 heavy-duty inter-regional and drayage (that is, short-haul, intermodal freight) trucking routes4,13, with susceptible populations often being the most affected6,7,14. The volume of truck traffic, local population density and the age of trucks operating on different corridors all impact the resulting health burdens. Drayage trucks are often older, have higher emissions and operate in urban areas due to the proximity to port and rail, making these short-haul corridors a prime target for electrification15,16,17,18,19. Whereas the high air pollutant emissions and health burden make Class 8 heavy-duty trucking a priority for a shift to zero-tailpipe-emissions vehicles20, the cost, scale of infrastructure requirements and technological challenges21 mean that policy support is necessary to catalyse this shift22,23.
The US federal government has, through the Inflation Reduction Act of 2022 (IRA), committed to investing US$369 billion in a clean energy economy, including grid decarbonization and zero-emission vehicles24. As of August 2024, the private sector has invested US$265 billion in clean energy since the IRA was passed, in large part due to tax credits that incentivize renewable energy sources such as wind and solar25. The IRA provides tax credits and direct funding for zero-emission heavy-duty trucks and charging infrastructure through programmes such as the Diesel Emissions Reduction Act, the Clean Heavy-Duty Vehicle Program, the Grants to Reduce Air Pollution at Ports Program and the Commercial Clean Vehicle Tax Credit24,26. In conjunction with these recent policies, the federal government directs 40% of the benefits of specific federal investments, including the Inflation Reduction Act, to disadvantaged communities through the Justice40 Initiative27. Disadvantaged communities are defined as economically disadvantaged and disproportionately burdened by environmental factors27,28. These communities are identified using the Climate and Economic Justice Screening Tool (CEJST), which draws on a diverse set of metrics, including being at the 90th percentile or above for diesel particulate matter exposure, asthma cases or traffic proximity and volume28. However, recent literature has found that emissions-reductions strategies under the Justice40 Initiative may not rectify the larger air pollution disparities present among racial–ethnic groups29,30,31. For this reason, it is useful to evaluate clean energy policy in terms of overall health effects and relative impacts, measured as air pollution disparity, for both disadvantaged communities and between racial–ethnic groups.
In this paper, we evaluate both a full (100%) truck electrification scenario and spatially targeted strategies to determine whether 40% or more of the human health benefits of corridor-specific and nationwide electrification accrue in disadvantaged communities, based on the goals of the Justice40 Initiative (Fig. 1). Given the recent debate about the effectiveness of the Justice40 Initiative at reducing air pollution disparities, we go further by quantifying air pollution inequalities by race–ethnicity. Whereas prior work has examined the effects of zero-emission trucking on mortality and exposure inequalities at regional/local scales18,32,33, this study quantifies the impacts of truck electrification on air-pollution-related disparities at a national scale for the United States. On the basis of these results, which span the present through 2050, we show which corridors could be prioritized for electrification to shift the balance of benefits towards more equitable health outcomes.
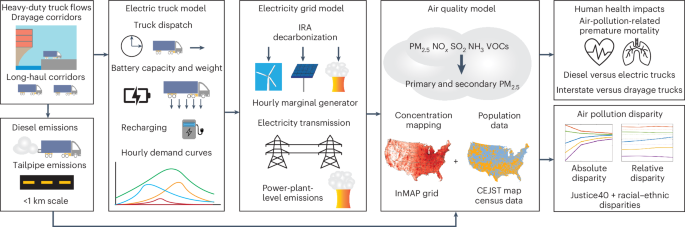
Integrated assessment framework comparing air-pollution-related health and disparity impacts for disadvantaged communities and racial–ethnic groups from heavy-duty diesel tailpipe versus electric truck grid emissions.
Results
To quantify the air-pollution-related human health damages from heavy-duty diesel and electrified Class 8 heavy-duty trucks, we simulate truck flows and, for battery-electric trucks, charging loads based on dispatch schedules and payload. Truck flow data come from the Freight Analysis Framework34 (FAF), which is based on the 2017 Commodity Flow Survey, providing us with present-day traffic counts and projections of overall increases in vehicle miles travelled (VMT) and payload through 2050 across the network. Following Tong et al.35, we transform FAF highway traffic counts into an origin-and-destination database. The baseline of this analysis is emissions from present-day (year-2024) Class 8 diesel trucks, which are projected into future years through 2050 based on increases in VMT. We compare diesel truck emissions to electricity grid emissions from a full transition to an electric truck fleet under two different electricity grid scenarios, high and low renewable energy cost and across years (present day to 2050). We provide these results before and after structural changes under the IRA. Diesel truck tailpipe emissions are based on on-road measurements for specific model years20,36,37, whereas we feed hourly charging load curves through 2050 for electric trucks into a grid model that leverages National Renewable Energy Laboratory (NREL) Standard Scenarios38 and power-plant-level emissions factors39 to estimate the locations and marginal emissions associated with meeting truck charging loads. We estimate local health damages for diesel and electric trucks with the widely used InMAP Source–Receptor Matrix (ISRM), a reduced-form air quality model that, due to its computational efficiency, allows for the running of multiple scenarios because it simplifies atmospheric physics and chemistry1,12,40. Using the ISRM outputs, we calculate exposure disparities as absolute differences (measured as differences in concentration) and relative differences (measured in percentage difference) for disadvantaged communities (as defined by CEJST) and racial–ethnic groups compared to the total population from heavy-duty diesel and electric truck emissions on a national scale.
Mortality and disparity in disadvantaged communities
As shown in Fig. 2a, beginning in 2030 under all scenarios studied, battery-electric trucks reduce the relative share of air-pollution-related health impacts borne by disadvantaged communities relative to conventional diesel trucks (Fig. 2a, Supplementary Appendix and Supplementary Table 2). Whereas both diesel and electric trucks are expected to haul more freight over time, premature mortality decreases over time for electric trucks as the electricity grid becomes cleaner, and premature mortality increases for diesel trucks (assuming no substantial improvements in efficiency or on-board emissions control technologies). However, as total premature mortality decreases for electric trucks, the relative disparity between disadvantaged and non-disadvantaged communities increases steadily over time from 0.7% to 6.9%. The relative disparity metric is a method of normalizing pollutant concentrations to compare relative exposure between populations (Methods, ‘Health effects and air pollution exposure inequality calculation’). Note that the constant relative disparity from diesel trucks at 7.1% represents the fact that we only consider how the total quantity of freight will change along current routes rather than how individual routing patterns may change over time. Additionally, we do not incorporate any projected shifts in population between regions within the United States, as there are no projections available at a fine enough spatial and socio-economic aggregation for this type of distributional analysis. The positive relative disparity for electric trucks indicates that disadvantaged communities experience a greater share of remaining human health burdens than what would be equitable given their population size (perfectly equitable would correspond to a disparity of zero). This share increases over time but remains below the share of burdens these communities currently experience with diesel trucks. With premature mortality decreasing over time for both disadvantaged and non-disadvantaged communities, both populations benefit from truck electrification. However, the increasing relative disparity in grid emissions shows that non-disadvantaged communities are receiving a greater relative benefit compared to disadvantaged communities. This is additionally reflected in Supplementary Table 11, which shows that only 20% or less of the benefits of truck electrification accrue in disadvantaged communities under a low renewable energy cost scenario. The electric truck results shown in Fig. 2a represent a low renewable energy cost scenario. The premature mortality and disparity for electric trucks under a high renewable energy cost are in Supplementary Appendix and Supplementary Tables 1 and 2. This result suggests that a uniform transition to electric trucks across all freight trucking corridors, while broadly beneficial and an improvement relative to diesel trucks in terms of equality, may not be sufficient to meet the Justice40 Initiative’s goals.
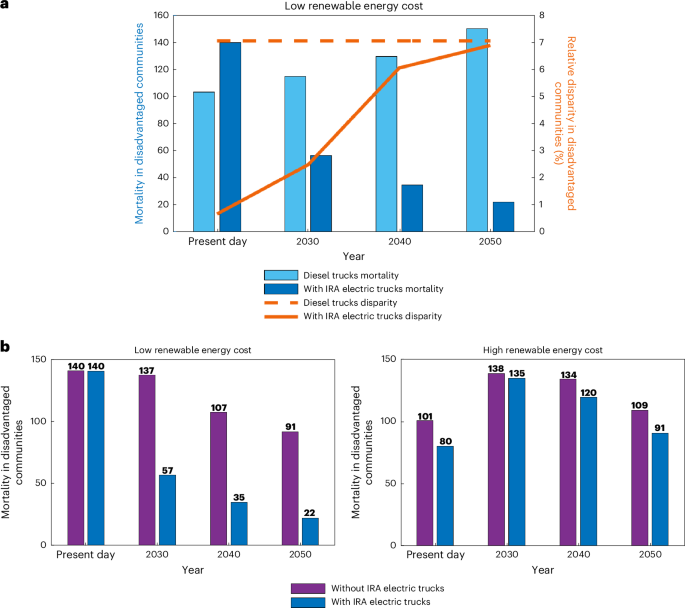
a, Premature mortality and relative disparity of heavy-duty diesel tailpipe versus electric truck grid emissions in disadvantaged communities. Results represent a low renewable energy cost scenario. b, Premature mortality in disadvantaged communities from electric truck grid emissions with and without renewable energy tax credits from the IRA. Results represent a low renewable energy cost scenario (left) and a high renewable energy cost scenario (right).
IRA effects on health
Whereas Fig. 2a compares a diesel truck scenario to an electric truck scenario with IRA renewable tax credits, Fig. 2b compares the net premature mortality impacts of electric trucks on disadvantaged communities with and without renewable energy tax credits from the IRA for two renewable energy cost scenarios (Fig. 2b, Supplementary Appendix and Supplementary Table 1). Figure 2b shows that low renewable energy costs combined with IRA incentives drive a rapid decrease in air-pollution-related premature mortality in disadvantaged communities, dropping by 84% between now and 2050 as compared to a 35% drop without the IRA. Under a high renewable energy cost scenario, the combination of slower grid decarbonization and increased future truck flows cause premature mortality to peak in disadvantaged communities by 2030 before ultimately decreasing in 2040 and 2050 (Fig. 2b, Supplementary Appendix and Supplementary Table 1). Additionally, the net effect of the IRA is smaller under a high renewable energy cost compared to a low renewable energy cost scenario. This difference is driven by assumptions that underpin the low and high renewable energy cost scenarios, which include projections for multiple renewable energy and battery technologies38. There is considerable regional heterogeneity in these results. Regions that continue to use fossil fuels to satisfy marginal load increases (which is particularly noticeable in the high renewable energy cost scenarios) result in greater health burdens for disadvantaged communities near electrified trucking corridors compared to diesel trucks.
Drayage trucking corridors
If uniform electrification across all trucking corridors in the United States does not offer the meaningful shift in burdens away from disadvantaged communities sought by environmental justice advocates and the Justice40 Initiative, the question that follows is whether particular regions or corridors can be targeted for an accelerated transition to facilitate a more equitable outcome. Results in Fig. 3 indicate that electrifying drayage trucking corridors yields substantially greater near-term human health benefits for disadvantaged communities compared to long-haul freight trucking corridors (Fig. 3). Currently, 95% of drayage VMT are already beneficial to electrify in terms of air-pollution-related premature mortality in disadvantaged communities compared to only 33% of VMT on long-haul corridors. By 2030, 100% of drayage VMT would yield net human health benefits in disadvantaged communities if electrified, as compared to 84% for long-haul trucking corridors. It is worth noting that this analysis isolates the impacts of the changing electricity grid, meaning that grid decarbonization is solely driving the changes seen over time in this figure. Previous literature has estimated the share of drayage corridors that are beneficial to electrify for the total population13. We find here that electrifying drayage corridors yields a disproportionately higher share of air-pollution-related health benefits for disadvantaged communities compared to the total population. This study adds to the existing body of literature showing that electrifying drayage trucks benefits disadvantaged communities18. These results suggest that near-term investments in electrifying short-haul drayage corridors, particularly in urban areas and near ports, could help to shift burdens away from disadvantaged communities. However, by modelling a dynamic and evolving electricity grid, we show that the gap in benefits between electrifying drayage and long-haul corridors closes by 2040, with nearly all corridors beneficial to electrify for health in disadvantaged communities in the long term.
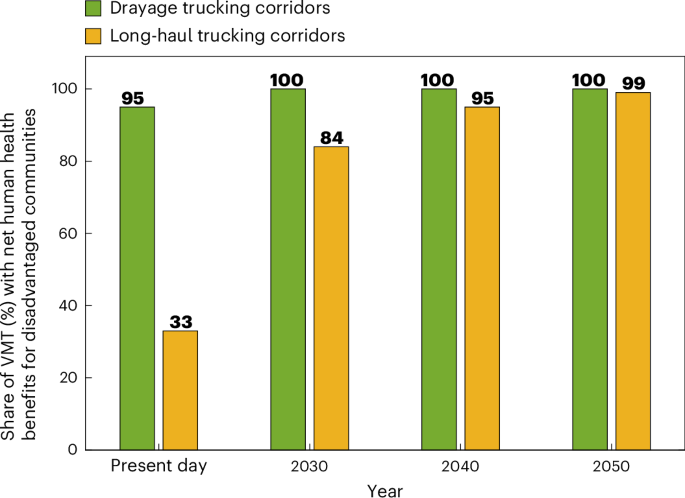
Results represent a low renewable energy cost scenario.
Racial–ethnic exposure disparities
So far, the results have been presented based on disadvantaged community classifications, but quantifying disparities between racial–ethnic groups can also provide valuable insights, particularly in comparison to CEJST. The CEJST map has several limitations, including using income as one of the primary determinants for disadvantaged classification (in addition to environmental factors) as opposed to race–ethnicity28, despite previous literature noting high air pollution disparities present by race–ethnicity and people of colour being more exposed to air pollution across the income spectrum41,42. These limitations of CEJST are further explored in the ‘Discussion’ section. Results show that the absolute air pollution exposure disparities by racial–ethnic group from electric truck grid emissions decrease from now until 2050 (Fig. 4a) whereas the relative disparities remain relatively unchanged (Fig. 4b). The convergence of lines in Fig. 4a indicates that every group is benefiting from decreased emissions (that is, truck electrification benefits public health). However, the relatively flat lines in Fig. 4b suggest that a corridor-agnostic approach that uniformly electrifies the truck fleet across all corridors is unlikely to shift existing relative disparities without targeted corridor- or region-specific strategies. Black populations are the most exposed group to power-generation emissions and diesel tailpipe emissions (Fig. 4b). Marginal grid emissions caused by truck charging loads have a higher relative air pollution disparity in Black populations than diesel tailpipe emissions, indicating that truck electrification may reduce absolute air pollution disparities while doing little to rectify or even increasing relative air pollution disparities. Notably, relative air pollution disparities are larger by racial–ethnic group than by disadvantaged versus non-disadvantaged communities.
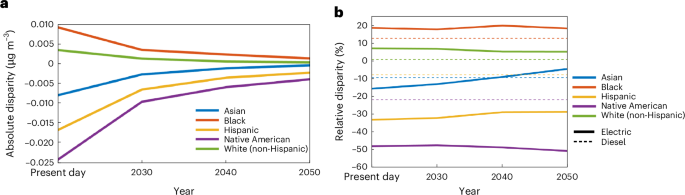
a, Absolute exposure disparity by year from electric trucks for each racial–ethnic group compared to the total population. b, Relative exposure disparity by year, including diesel and electric trucks, compared to the total population. Results represent a low renewable energy cost scenario.
Targeted approach
Figure 5a illustrates the locations of modelled fossil-fuel-fired power plants that ramp up to meet electric truck charging loads, classified based on whether they are located within five miles of a disadvantaged community. The 91 power plants in Fig. 5 represent the highest-emitting power plants in 2050, defined as plants in the 95th percentile of annual marginal emissions in response to increased load from electric trucks. Seventy-one of the 91 total high-emitting plants on the margin are within five miles of a disadvantaged community. However, it also highlights one challenge of using disadvantaged community classifications: these classifications take into account legacy pollution sources and current ambient air quality28. Thus, having a high-emitting power plant in or near a community makes it inherently more likely to be classified as disadvantaged (although the same could be said for communities near major freight corridors). Our results highlight the tension between the need to leverage some existing infrastructure and the historical injustices associated with where that infrastructure was built. With 2050 still several decades away, there is still time to plan strategically to counterbalance these injustices. Employing targeted corridor- and region-specific strategies (for example, drayage corridors) and simultaneously addressing emissions from existing and future fossil-fuel-fired power plants can produce better, more just outcomes. Figure 5b shows what a targeted approach would look like under two different goals: (1) reducing air-pollution-related premature mortality in disadvantaged communities (2) meeting Justice40 goals (Fig. 5b). The comparison between health and equity goals in this figure shows that corridors that benefit health in disadvantaged communities do not necessarily meet Justice40 goals. In fact, far more corridors meet the goal of reducing air-pollution-related premature mortality than meet Justice40 goals. Additionally, the number of beneficial corridors for health tends to increase over time due to grid decarbonization whereas the number of corridors that meet Justice40 goals stays relatively stagnant. Supplementary Figs. 1–3 show additional corridor-level analyses, Supplementary Figs. 4–7 show zoomed-in regional results for specific states and cities and Supplementary Tables 1–13 show numerical results of all figures and additional results.
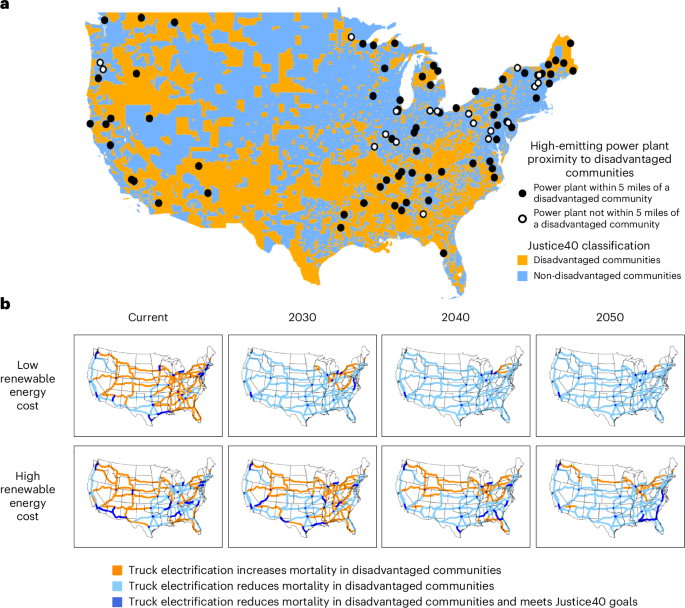
a, Proximity of highest-emitting power plants (95th percentile) to disadvantaged communities in 2050. Emissions are due to increased generation from heavy-duty truck electrification. Results represent a low renewable energy cost scenario. b, Diagram showing which freight corridors should be electrified for reducing premature mortality in disadvantaged communities and meeting Justice40 goals. Corridors meet Justice40 goals if 40% of the benefits of truck electrification compared to diesel truck baseline accrue in disadvantaged communities. Results reflect two scenarios based on renewable energy cost: low (top) and high (bottom).
Discussion
In this study, we outline the health and equity impacts for disadvantaged and minority communities of electrifying diesel trucks. In terms of a starting point for truck electrification, our results show that electrifying drayage trucking corridors provides a much greater relative benefit to disadvantaged communities in the present day (95% of VMT are net beneficial to electrify for air quality in disadvantaged communities) compared to long-haul corridors (33% of VMT beneficial to electrify). However, a cost–benefit analysis is needed, as drayage trucks have historically been low-cost, older trucks and replacing them with higher-cost electric trucks may require substantial policy support in the form of subsidies, incentives and/or regulation21,43. This cost–benefit analysis should consider that current and future regional and local regulations are aimed at reducing emissions from drayage trucks at port locations, which may result in fleet turnover to newer models44.
The results of this study show that truck electrification and grid decarbonization benefit public health by reducing air-pollution-related premature mortality in disadvantaged communities. Although truck electrification paired with grid decarbonization results in lower air-pollution-related health effects for all groups, the relative disparity between disadvantaged and non-disadvantaged communities increases, suggesting that a disproportionate share of benefits accrue in non-disadvantaged communities. Similarly, whereas absolute disparity in grid emissions decreases over time for all racial–ethnic groups, relative disparity remains largely unchanged, with Black populations being the most exposed. These results have been validated by a recent study, Koolik et al.45, which found that California’s vehicle emissions reduction policy reduced overall air pollution exposure but increased relative exposure disparities for the most exposed communities and racial–ethnic groups. Camilleri et al.33 found similar results to our health analysis with truck electrification in an urban location, Chicago, resulting in avoided premature mortality. Whereas their results for Chicago showed higher benefits for Black and Hispanic/Latino residents, our national-scale results found that truck electrification does little to rectify, or even increases, existing racial–ethnic exposure disparities. This difference is caused by scaling up the analysis of electric truck inequalities to a national scale, a result that has been confirmed by other national studies including Thind et al.4, which found that urban and rural freight trucks affect different populations. By expanding the considered routes to long-haul trucks, in addition to urban and drayage trucks, our results show that while a general electrification approach may work for large urban centres, a targeted approach is required nationwide to reduce air pollution disparities from heavy-duty truck electrification. Supplementary Figs. 4–7 show the effects of truck electrification in specific states and cities for comparison with other studies such as Camilleri et al.33.
Beyond the near-term advantages of electrifying drayage trucks, our analysis also highlights the fact that any single environmental justice metric is inherently incomplete and the CEJST map is no exception. Analysing the impacts by racial–ethnic group still provides a useful additional dimension. Whereas air quality improves across the United States in our truck electrification scenario, Black populations remain most exposed through 2050, and the relative disparity is largely unchanged. The metrics that CEJST used to define disadvantaged communities do not directly include race–ethnicity, with recent literature suggesting that the Justice40 Initiative may not be enough to rectify the largest air pollution exposure disparities in the United States27,28,29. The definition of disadvantaged communities is also quite broad with around one-third of the US population being labelled as disadvantaged29. However, it is arguably too early to predict how federal investments will ultimately impact the pace of electrification by region and corridor. This study analyses widespread electrification of Class 8 trucks on long-haul and drayage corridors in the United States. In reality, the choices of hauling companies, charging station developers and the presence of state-level policies are likely to alter the pace of electrification on a regional scale.
Another important topic to address in future studies is the fact that several components of battery manufacturing are conducted abroad and contribute to environmental justice and human rights concerns elsewhere46,47. While this analysis was focused on domestic health effects and air pollution disparity, future work should ideally quantify premature mortality and disparities associated with upstream battery manufacturing emissions. Diesel trucks have additional tailpipe emissions due to hotelling, idling and cold starts36. The location of these emissions is uncertain, driven largely by traffic and driver rest schedules. Future work should develop a framework for determining the location and quantity of these emissions as considering them would further highlight the benefits of truck electrification for reducing on-road emissions. Further, brake, clutch and tyre wear cause additional non-tailpipe emissions from trucks that are largely unregulated and were not included in the present study. Ignoring these emissions may make diesel and electric trucks appear to be more favourable in this study than they are in reality, while neglecting potential improvements in truck emissions factors may make them appear less favourable than in reality. The quantity of these non-tailpipe emissions and truck improvements are not necessarily balanced and may differ for diesel and electric trucks, so future work should consider quantifying these emissions in similar analyses. Another limitation of this study that could be addressed in future work is the scope of the trucking sector that is covered. We analysed the 200 long-haul and drayage corridors used by Tong et al.20 and McNeil et al.13 but did not include all possible routes or medium-duty trucks. Use of the ISRM relies on assumed background concentrations of air pollutants that may change over time48, particularly under scenarios in which the grid is aggressively decarbonized and vehicles are electrified. The ISRM simplifies complex atmospheric physics and chemistry into a linear approximation. This improves computational efficiency, allowing us to run a nationwide air quality model thousands of times across each scenario and corridor but potentially misses nonlinear formation processes for secondary PM2.5 that can affect health in disadvantaged communities at hyperlocal, equity-relevant scales. Full-form air quality models are better able to capture these processes, but computational efficiency limits their geographic range and makes analyses of nationwide policies challenging. The ISRM has additional limitations related to its use of an outdated National Emission Inventory (NEI), which may not accurately represent 2050 emissions. We recognize that the literature has not reached a consensus on established methods for varying background concentrations when conducting future scenarios. We follow several other studies such as Goforth and Nock49 and Jackson et al.50, who conducted analyses of future policy scenarios (up to 2050) using reduced-form air quality models based on a previous NEI. A valuable potential next step would be the development of future scenario-specific ISRMs that account for expected changes in background air pollutant concentrations. This study projects health and disparity impacts for several decades into the future, yet over time, populations are likely to shift along with the communities that meet the criteria to be categorized as a disadvantaged community. We did not consider this in the present analysis to isolate the impacts of decarbonization and due to data availability limitations on future population projections at equity-relevant scales. Future studies should quantify the impacts of this shift on air-pollution-related health effects and disparity. Similarly, truck VMT are likely to shift along with these population shifts and infrastructure investments. Future work should determine the health and equity impacts of shifting trade patterns over time.
This study highlights both the opportunity for heavy-duty freight truck electrification to reduce health burdens for all communities and the additional work required to ensure that the benefits are distributed in a manner that corrects for historical environmental injustices. Overall, heavy-duty truck electrification will be a major win for public health by lowering air pollution concentrations and associated health effects for both disadvantaged and non-disadvantaged communities. The Justice40 Initiative aims to direct 40% of the benefits of federal investments, including truck electrification and grid decarbonization, to the approximately one-third of the population located in disadvantaged communities. The results indicate this outcome cannot be taken for granted in the context of freight truck electrification, but targeted efforts to mitigate power plant emissions and electrify corridors in these communities can reduce air pollution exposure inequalities and pave the way for a just energy transition.
Methods
This study compares the health and equity implications of truck electrification at a national scale. This work serves as a policy analysis, evaluating if heavy-duty truck electrification, when combined with the Inflation Reduction Act’s grid decarbonization investments, meets the Justice40 Initiative’s goal of directing 40% of the benefits to disadvantaged communities as defined in the government’s CEJST28. The Justice40 Initiative policy is unclear in how its outcomes are evaluated, whether it be through overall health benefits or reductions in air pollution disparities. We therefore quantify the effect of truck electrification on health effects, absolute disparities and relative disparities to evaluate its benefits for disadvantaged communities using these various metrics. Additionally, we quantify disparity by race–ethnicity. The framework used by this study models truck flows, diesel emissions, electric truck charging and behaviour, electricity transmission, grid emissions and air pollutant concentrations. The output of this framework is the expected air-pollution-related premature mortality and relative disparity in disadvantaged communities caused by tailpipe emissions from diesel trucks compared to the induced electricity grid emissions caused by battery-electric trucks.
Truck network and operation
We analyse heavy-duty (Class 8, GVWR > 33,000 pounds) truck flows at a national scale to model energy requirements along major freight corridors. The corridors used in this study are the 200 interstate (long-haul) and drayage (short-haul, intermodal) routes used by Tong et al.35 and McNeil et al.13 to represent road freight movement across the continental United States. We are only considering Class 8 heavy-duty trucks in this analysis as these are often the most difficult vehicles to electrify due to their large size. Class 7 trucks provide additional drayage services that are not considered in this analysis44. The data for vehicle miles travelled (VMT) and payload along these corridors come from the Freight Analysis Framework (FAF)34. We consider that different routes carry varying payload amounts and have different VMT depending on the number of trucks operating. We project increases to freight movement in the United States from now until 2050 based on data from FAF34, applying a factor for how much freight VMT will increase by a given year to meet demand. This approach takes into account changes in population and the economy to apply escalation factors through 2050 uniformly across all corridors. Thus, these projections do not capture the fact that payload and VMT increases will probably not be evenly distributed across the country.
Electric truck model
Electricity demand caused by full heavy-duty truck electrification was estimated for each of the 200 corridors considered in this study. Fleetwide demand was quantified using a vehicle power train model51,52, considering vehicle weight and speed along with road grade. This model considers the fact that battery weight affects achievable payload and compensates by sending additional trips along a route if the payload from electric trucks is lower than that from diesel trucks. Modelled electric trucks need to refuel along long-haul routes. Charging station locations are currently highly uncertain53. For the purposes of this study, trucks are assumed to charge at intersections of major highways and at evenly spaced stations as needed on interstate routes35. Future studies may want to examine how the location of charging station locations impacts air pollutant concentrations.
Electric trucks are assumed to operate with a 1 MWh battery, a slight improvement to electric trucks currently on the market54. On the basis of the Tesla Semi, this capacity should allow a range of 500+ miles (ref. 54). Charging power is assumed to improve over current rates, with 1 MW charging powering electric trucks in the model20,52. We assume a battery pack specific energy of 240 Wh kg−1 in this study20,52. The impacts of varying battery capacity, battery pack specific energy, charging power and truck design on human health have been previously explored in the literature13,20,52.
Electricity grid model
The electricity grid model used in this study estimates the induced grid emissions caused by increased demand from truck electrification. The hourly simulated charging demand from electric trucks in each year between now and 2050 is aggregated at a balancing area-level resolution (134 in total for the contiguous United States)55. We account for electricity transmission between balancing areas through modelling transmission-connected regions (T-regions), which can change on an hourly basis and are made up of one or more balancing areas56. Electricity flows between balancing areas as needed, creating T-regions defined by the National Renewable Energy Laboratory (NREL)56. The spatial extent of T-regions can encompass anywhere from a single balancing area to a majority of the country in a given hour. Therefore, a key difference between electric trucks and diesel trucks is that the emissions from electric trucks can be spread throughout many generators across the country whereas diesel tailpipe emissions are confined to the roadways where they are emitted and the surrounding area due to dispersion.
Following the methods of McNeil et al.13, we use data from the NREL Standard Scenarios38 to determine the marginal generator of each T-region at an hourly temporal resolution. The marginal generator is the energy source that satisfies changes in demand (for example, solar power, natural gas combined cycle plants). Whereas there has been debate on the role of coal in marginal electricity generation, this study follows several other studies in allowing coal to act as the marginal generator in our model20,57,58. The hourly marginal generator data come from NREL Standard Scenarios38,59. The electricity load caused by truck electrification within a T-region is allocated proportionally to all operating generators in that region based on each plant’s current generation. This method avoids the necessity to arbitrarily choose which individual plants might be dispatched to meet new truck charging loads, but it is a limitation as real-world utility agencies may not choose the least-cost solution due to political and technological factors or data deficiencies59. Using emissions factors for air pollutants at the power plant level39, we explicitly calculate hourly emissions for individual power plants, which we sum into annual averages as an input for the air quality model. Although projections are available for intermediate years, we provide runs for the first year of each new decade through 2050, considering the increasing share of renewables in the grid mix. Results are modelled before and after changes to the electricity grid under the Inflation Reduction Act to determine the impact of this policy on exposure inequalities and health effects in disadvantaged communities56,59. We recognize that the debate between using average and marginal emissions to characterize net impacts of electrification is ongoing in the research community13,20,58,60,61. In this study, we align with Ryan et al.62 and McNeil et al.13 in using marginal emissions to analyse the incremental change in demand caused by the introduction of electric truck models into the fleet.
Diesel emissions model
Diesel tailpipe emissions were estimated at a fine spatial resolution (<1 km) using emissions factors from the Greenhouse gases, Regulated Emissions, and Energy use in Technologies (GREET) model37 and on-road measurements36 as used in Tong et al20. These are fleet-averaged emissions factors for individual model years and air pollution control technologies. The measurements confirm the presence of superemitters in the fleet36, which can have a disproportionate impact on health and inequality, with drayage trucks often the highest emitters18,63. When a decision is made regarding buying an electric truck, it is often by individuals or companies who need to replace an older diesel truck. Therefore, the appropriate counterfactual for a new electric truck is a new diesel truck. It is uncommon for a purchasing decision to be between a new electric truck model and an older diesel truck model without air pollution control technology. Therefore, the modelled diesel emissions are from Model Year (MY) 2010–2018, which includes selective catalytic reduction (SCR) and diesel particulate filters for NOx and particulate control. If, for example, older trucks on drayage routes were targeted for early replacement, it is possible that a different counterfactual (for example, continued use of older trucks) might be appropriate, and this would substantially increase the net estimated human health benefits of electric trucks. By focusing on a single diesel truck model, we isolated the effects of the evolving electricity grid on health and equity in disadvantaged communities. However, relying on just one model does not capture the full diesel truck fleet64. Prior work has shown that beyond modern trucks with diesel particulate filters and SCR control, only incremental improvements can be expected, largely driven by vehicle efficiency20. Whereas the Environmental Protection Agency’s Motor Vehicle Emission Simulator (MOVES)65 model offers emissions factors for the full fleet of heavy-duty diesel trucks, our selection of the appropriate counterfactual for an electric truck required a breakdown of emissions factors by model year. Future studies attempting to quantify the full emissions from the diesel truck fleet, with the full spectrum of air pollution control technologies, or that include additional emissions sources such as idling, hotelling and brake and tyre wear, may benefit from MOVES as a data source.
Source–receptor matrix
We map PM2.5 concentrations caused by emissions from diesel trucks and electricity generation at a national scale using the InMAP source–receptor matrix (ISRM)1,12,40. This model considers how emissions from primary PM2.5 and emissions of relevant precursors for formation of secondary PM2.5 (NOx, NH3, SOx and VOCs) lead to changes in total PM2.5 concentrations12. These concentrations can then be used to quantify health effects and exposure inequalities. The ISRM is based on repeated runs of the Intervention Model for Air Pollution (InMAP), which is able to resolve intra-city air pollution gradients at fine spatial resolution66. The results of InMAP have been validated against full-form air quality models and observed data, with the primary use being estimates of marginal changes in PM2.5 concentrations based on changes in emissions. The ISRM considers atmospheric conditions based on annual averages. The spatial resolution of the ISRM varies depending on population density between 1 km by 1 km in dense urban areas to 48 km by 48 km in rural areas12. The varying spatial resolution enables the ISRM to improve accuracy without making the model computationally expensive to run. This also allows us to achieve fine spatial resolution in urban areas when determining the impacts of drayage trucking. We map the sum of primary and secondary PM2.5 concentrations from a nationwide diesel fleet and a nationwide electric truck fleet separately to compare the impacts of these two technologies. We also study the impacts of each individual freight corridor to compare long-haul and drayage routes and to determine the health and equity effects of regional grid mixes. CEJST data are at the census-tract level whereas the ISRM grid is variable between 1 by 1 km and 48 by 48 km. To quantify health effects and disparities present in disadvantaged communities, we overlay the CEJST map28 onto the ISRM grid. For each ISRM grid cell, we develop a percentage of the grid that falls within a disadvantaged community. We assume that the population from the ISRM is evenly distributed within a grid cell to estimate the number of people living in a disadvantaged community within that grid cell. Whereas the method described here is imperfect as populations are not evenly distributed, it allows us to overcome data limitations of the ISRM grid and CEJST data using different spatial scales. Future work may consider using population data at the census-block level, as opposed to the grid-cell level or census-tract level, before overlaying with the ISRM grid to take into account within-grid cell and within-tract spatial variability.
Health effects and air pollution exposure inequality calculation
From PM2.5 concentrations, we follow the methods of Krewski et al.67 to determine air-pollution-related premature mortality. This method relates changes in PM2.5 concentrations to changes in all-cause mortality rates, meaning that susceptible populations experience heightened effects from increases in air pollution12,67. We did this for each grid cell, calculating the expected mortality in disadvantaged communities from diesel versus electric trucks.
We calculate exposure inequalities as absolute differences (measured as differences in concentration) and relative differences (that is, percentage difference) for disadvantaged communities and racial–ethnic groups compared to the total population on a national scale30. First, we calculate the population-weighted mean PM2.5 concentration for disadvantaged communities and racial–ethnic groups and the general population. This metric is a product of concentration and population at the grid-cell level and then summed. Absolute disparity is simply the difference between the population-weighted mean of disadvantaged communities or racial–ethnic groups and the total population. Relative disparity is a method of normalizing exposure to compare between populations. We divide the difference in population-weighted mean concentrations between disadvantaged communities or racial–ethnic groups and the total population (that is, absolute disparity) by the total population-weighted mean to determine relative disparity as a percentage.
Differences exist in the definitions of inequality and inequity in the literature. Following Wang et al.68, we define inequality in this paper as racial–ethnic groups or disadvantaged communities being more exposed to air pollution and associated health effects than the general population and evaluate this on a national scale. This is in contrast to the definition of inequity from Tessum et al.12 because inequity considers which groups create the sources of air pollution that lead to health effects. In this paper, we use the terms inequality and disparity interchangeably.
Reporting summary
Further information on research design is available in the Nature Portfolio Reporting Summary linked to this article.


Responses