Implantation of engineered adipocytes suppresses tumor progression in cancer models
Main
Tumors are complex tissues composed of cancerous and non-cancerous cells in a hypoxic and nutrient-deprived microenvironment. The tumor microenvironment contains heterogeneous cell populations, including immune cells, mesenchymal support cells and matrix components that contribute to tumor growth and progression1. To survive this environment, tumors are capable of reprogramming metabolic pathways to better use available substrates in the surrounding tumor microenvironment, ultimately becoming dependent on these pathways for continued growth and survival2. In contrast to normal cells, the main pathway of glucose metabolism in cancer cells is aerobic glycolysis, termed the Warburg effect3. Glucose uptake and lactate production are increased in these cells, even in the presence of oxygen and functional mitochondria3. The increase in glycolytic flux allows glycolytic intermediates to supply subsidiary pathways to fulfil the metabolic demands of proliferating cells. During hypoxia, cancer cells also undergo metabolic reprogramming to increase lipid use, as fatty acids produce twice the energy of glucose4,5.
There have been many efforts to target cancer glucose and fatty acid metabolism for therapeutic purposes. For glycolysis, these include drugs that target hexokinase 2 (HK2), which is involved in the initial steps in glycolysis, using ATP from the mitochondria to phosphorylate glucose, or drugs that target glucose transporters (GLUT1 and GLUT4)2,6,7,8. Several drugs are also used to target lipid metabolism in cancer9,10,11,12. These include drugs that target lipid uptake (targeting proteins such as LXR, CD36 and FABP4/5), lipogenic enzymes (such as ACC, ACLY, FASN and SCD1) and proteins involved in intracellular lipid homeostasis (such as CPT1A, PPARG and others)13,14. In addition, recent work has shown that cold activation of brown adipose tissue (BAT), which dissipates energy by non-shivering thermogenesis, increases adipocyte glucose uptake and lipid metabolism and significantly inhibits tumor growth15. However, situating cancer patients in cold conditions for extended periods is challenging.
Here, we set out to develop a therapeutic approach, termed adipose manipulation transplantation (AMT), that uses two unique abilities of white adipose tissue (WAT). First, it can be readily extracted in the clinic by liposuction and implanted through reconstructive surgery; second, it can change into a BAT-like tissue, called browning or beiging16,17, by upregulating essential transcriptional regulators or enzymes, such as the uncoupling protein 1 (UCP1), PPARG coactivator 1 alpha (PPARGC1A) or PR/SET domain 16 (PRDM16) genes18,19,20,21,22,23,24,25,26,27,28,29,30,31,32,33. Similar to BAT, beige adipocytes have the capacity to convert energy to heat and contribute to whole-body energy expenditure34. We show that CRISPR activation (CRISPRa) of either UCP1, PRDM16 or PPARGC1A induces browning, subsequently increasing glucose and fat metabolism in human white adipocytes and adipose organoids. Co-culturing of these CRISPRa-modulated adipocytes with various cancer cell lines (breast, colon, pancreatic or prostate cancer) significantly suppresses cancer cell proliferation as well as decreases glucose uptake, glycolysis and fatty acid oxidation (FAO) capacity in the cancer cells. Subcutaneously co-transplanting CRISPRa-modulated human adipose organoids and cancer cell xenografts (two different breast cancer lines, pancreatic or prostate) into immune-compromised mice leads to significantly reduced tumor size with decreased hypoxia and angiogenesis. Implantation of engineered adipose organoids into pancreatic or breast cancer genetic mouse models significantly suppresses cancer progression. Furthermore, in the breast cancer model, we show that their implantation both near and distal to the tumor leads to similar results. To further demonstrate the therapeutic potential of this approach, we show that adipocytes isolated from resected human breast tissues can be similarly manipulated with CRISPRa and can inhibit the growth of patient-derived breast cancer organoids as well as the proliferation of high-risk non-cancerous breast tissues such as those from patients with BRCA1/2 mutations. In addition, we also show how induction of CRISPRa using tetracycline or the implantation of modulated adipose organoids in an integrated cell-scaffold delivery platform can control this therapeutic approach in a reversible manner. Finally, to show that this approach can be customizable for other tumor-associated metabolic programs, we show how CRISPRa upregulation of uridine phosphorylase 1 (UPP1) in adipose organoids can suppress xenograft growth of a uridine-dependent pancreatic ductal adenocarcinoma (PDA)35. Combined, our results introduce a cancer therapeutic approach that has the potential to treat numerous cancer types.
Results
CRISPRa browning of human white adipocytes
To induce browning in human adipocytes, we used CRISPRa to upregulate UCP1, PPARGC1A or PRDM16, all known genes involved in BAT development and function. Using CRISPick36, we designed five guide RNAs (gRNAs) targeting each gene’s promoter and cloned them into an adeno-associated virus (AAV)-based expression vector. Differentiated adipocytes derived from human white preadipocytes were co-transfected with the gRNAs along with a Staphylococcus aureus endonuclease-deficient Cas9 (dCas9) fused to the VP64 transcriptional activator. We used an S. aureus dCas9 due to its smaller size and the VP64 transcriptional activator (which carries four copies of VP16, a herpes simplex virus type 1 transcriptional activator37) because it provides moderate gene upregulation and is small enough to fit into AAV, which has a 4.7 kb optimal packaging capacity38. To generate mature human adipocytes, preadipocytes were subjected to adipocyte differentiation using a cocktail of 3-isobutyl-1-methylxanthine (IBMX), dexamethasone and insulin before being subjected to CRISPRa. After 4 days, we measured gene expression by quantitative PCR with reverse transcription (RT–qPCR), finding several gRNAs to significantly increase the expression levels of UCP1, PPARGC1A and PRDM16 in the transfected cells compared to the control cells (treated with dCas9–VP64 only) (Extended Data Fig. 1a). We selected the top two gRNAs for each gene for AAV serotype 9 (AAV9) packaging. We used AAV9 because it was shown to effectively infect various adipose depots39. We infected human differentiated adipocytes with these viruses along with AAV9 dCas9–VP64, finding for each gene at least one gRNA that significantly increased expression levels compared to the dCas9–VP64-only control (Extended Data Fig. 1b). We used the top-activating gRNA AAV for all subsequent experiments.
We next examined whether our CRISPRa treatment increases browning in these human white adipocytes. Human adipocytes transduced with the top gRNA for UCP1, PRDM16 or PPARGC1A showed significantly increased expression of their target genes compared to dCas9–VP64-only infected cells (Extended Data Fig. 1c). In addition, we also observed increased mRNA levels for brown fat marker genes, including TFAM, DIO2, CPT1b and NRF1 upon upregulation of either of the three genes (Extended Data Fig. 1d); PRDM16 CRISPRa did not show upregulation of CPT1b and NRF1. We next examined the oxygen consumption rate (OCR) in these cells using Seahorse (Methods), by initially blocking oxygen consumption and then adding 1 μM oligomycin, followed by the introduction of 1 μM carbonyl cyanide-p-trifluoromethoxy-phenylhydrazone (FCCP) to measure the maximal respiratory capacity. We found that CRISPRa-AAV treatment targeting all these genes increased overall OCR levels in human white adipocytes, with UCP1-gRNA-AAV-treated cells having the largest increase (Extended Data Fig. 1e). In addition, these cells showed increased uncoupled respiration (under oligomycin, an ATP synthase inhibitor), indicating a brown fat-like phenotype (Extended Data Fig. 1e). CRISPRa-treated cells also had elevated maximal respiration following FCCP treatment (Extended Data Fig. 1e). Furthermore, these CRISPRa-AAV-engineering adipocytes showed increased glucose uptake in both basal and insulin-stimulated conditions (Extended Data Fig. 1f). We also tested the FAO capacity of these cells by performing a similar Seahorse OCR assay. In both BSA and BSA-conjugated-palmitate (saturated fatty acid complex) media, we found that our CRISPRa-treated adipocytes had an overall OCR increase in BSA-conjugated-palmitate (Extended Data Fig. 1g). Under FCCP treatment, in which the increase of OCR in palmitate-containing media compared to BSA-containing media is thought to be caused by exogenous FAO, we found that upregulation of either gene increased exogenous FAO capacity in human adipocytes (Extended Data Fig. 1h). Similarly, UCP1-upregulated human adipocytes had the largest increase in FAO. We also found that UCP1-upregulated human adipocytes had higher fatty acid uptake than the dCas9–VP64 control cells (Extended Data Fig. 1i). Taken together, we show that AAV-based CRISPRa upregulation of UCP1, PPARGC1A or PRDM16 induces browning in human adipocytes, leading them to have increased glucose uptake and FAO.
CRISPRa-modulated adipocytes suppress tumor growth in vitro
We next evaluated whether our CRISPRa ‘browned’ adipocytes could inhibit cancer growth in vitro using a co-culturing system (Fig. 1a). We initially treated differentiated adipocytes with CRISPRa-AAV for either of the three genes (UCP1, PPARGC1A or PRDM16) and replated these adipocytes on the top chamber of a 12-well or 24-well Transwell plate, which has inserts of 0.4 µm membranes, so that the adipocytes did not contact the cells on the lower chamber (Fig. 1a). In the lower chamber, we grew five different cancer cell lines: breast cancer cells MCF-7 (estrogen receptor-positive (ER+), progesterone receptor-positive (PR+), glucocorticoid receptor-positive (GR+)) and MDA-MB-436 (triple negative), colon cancer (SW-1417), pancreatic cancer (Panc 10.05) and prostate cancer (DU-145). As a negative control, we used adipocytes infected with dCas9–VP64 only. After 3 days, we observed that all five cancer cell lines that were co-cultured with UCP1, PPARGC1A or PRDM16 CRISPRa-treated human adipocytes showed significantly lower cell numbers than cancer cells co-cultured with dCas9–VP64-treated adipocytes (Fig. 1b). We also found that the number of cancer cells co-cultured with CRISPRa-treated adipocytes was threefold to fivefold lower than cancer cells co-cultured with the control adipocytes (Fig. 1c). By RT–qPCR, we observed that all cancer cells co-cultured with CRISPRa-treated adipocytes had significantly reduced levels of the proliferation marker MKI67 (other than Panc 10.05 and DU-145 treated with PRDM16 CRISPRa) compared to control cells, with UCP1-CRISPRa having the greatest effect (Fig. 1d). We also performed a BrdU incorporation assay, finding that after 24 h, CRISPRa co-cultured cancer cells showed significantly reduced proliferation compared to cells co-cultured with control adipocytes (Extended Data Fig. 1j).

a, Schematic of the co-culturing model of cancer cells and CRISPRa-treated adipocytes using Transwell plates and their subsequent phenotyping (created with BioRender.com). b, Representative images of cancer cells, including breast (MCF-7, MDA-MB-436), colon (SW-1417), pancreatic (Panc 10.05) and prostate cancer (DU-145), that were co-cultured with CRISPRa-upregulating UCP1, PPARGC1a and PRDM16 or control (dCas9–VP64 only) adipocytes. Scale bars, 530.4 μm. c, Cancer cell number per view of image (four images or replicates per condition). d, RT–qPCR of the proliferation marker gene MKI67 for cancer cells co-cultured with CRISPRa-modulated adipocytes (n = 4 biological replicates). e, Basal glycolysis measured by calculating the area under the curve of ECAR upon glucose treatment (n = 4–5 biological replicates). f, Maximal glycolysis measured by calculating the area under the curve of ECAR upon oligomycin treatment (n = 4–5 biological replicates). g,h, Glucose uptake of cancer cells co-cultured with CRISPRa-modulated adipocytes without (g) or with (h) insulin (n = 3 biological replicates). i, RT–qPCR of glucose transporter GLUT4 and glycolytic enzyme GCK in cancer cells (n = 3–4 biological replicates). j, Exogenous FAO of cancer cells calculated by the difference of area under the curve of OCR of BSA-palmitate media upon FCCP treatment (n = 4 biological replicates). k, RT–qPCR of fatty acid transporter CD36 and fatty acid regulatory transporter CPT1b in cancer cells that were co-cultured with CRISPRa-treated adipocytes (n = 3–4 biological replicates). All statistical tests were carried out using a one-way ANOVA and data are represented as mean ± s.d. *P ≤ 0.05; **P ≤ 0.01; ***P ≤ 0.001; ****P ≤ 0.0001.
We next analyzed the glucose and fatty acid metabolism of the co-cultured cancer cells. To measure glycolysis, we used the extracellular acidification rate (ECAR) assay in which the basal glycolytic rate is measured by adding glucose and the maximal glycolytic rate is measured by oligomycin A addition. We found that most cancer cell lines co-cultured with CRISPRa-AAV-treated adipocytes showed a significant reduction in both basal and maximal glycolytic rate (Fig. 1e,f) and lower glucose uptake in both basal and insulin conditions (Fig. 1g,h). Using RT–qPCR, we also found that the expression of key glycolysis genes, such as GCK and GLUT4, a major glucose transporter, was significantly lower in most cancer cells co-cultured with CRISPRa-AAV adipocytes than in the negative control (Fig. 1i). We also examined FAO using Seahorse. In BSA-only media, we found that all cancer cell lines that were co-cultured with UCP1-CRISPRa-modulated adipocytes had lower OCR. For PPARGC1A and PRDM16 CRISPRa-modulated adipocytes, this was only observed in MDA-MB-436 and Panc 10.05 cells (Extended Data Fig. 1k). In palmitate-containing media, we found that all five cancer cell lines that were co-cultured with CRISPRa-AAV adipocytes had reduced FAO compared to the negative control (Fig. 1j). Moreover, using RT–qPCR, we found in several CRISPRa conditions that the cancer cells had lower expression of both CD36, a fatty acid transporter on the cell membrane, and CPT1b, a key regulator of FAO in the mitochondria, further confirming decreased FAO (Fig. 1k). To show that this approach works with other adipocyte lines, we also upregulated UCP1 in human adipocytes differentiated from primary preadipocytes (Extended Data Fig. 1l) and found that they inhibit tumor growth of all five cancer cells (Extended Data Fig. 1m). Combined, our data shows that our CRISPRa-modulated adipocytes reduce glycolysis and FAO in five different cancer cell lines and can significantly suppress cancer growth.
We next compared the tumor suppression capability of CRISPRa-AAV-modulated adipocytes to known metabolic cancer drugs. We grew MCF-7 cells and treated them with the following: (1) CRISPRa-UCP1-AAV adipocytes at the top layer of a Transwell model; (2) 6-aminonicotinamide, which is known to target glycolysis and reduce cell growth in a variety of tumors40,41,42, including MCF-7 breast cancer cells41, using similar or higher drug concentrations (50 µM, 100 µM and dimethylsulfoxide (DMSO) as a control)41; and (3) etomoxir, an inhibitor of FAO43 that suppresses tumor cell growth44,45, including breast cancer46,47, using concentrations previously used for MCF-7 cells (100 µM, 200 µM and DMSO as a control)47. Using a luminescent cell viability assay (Methods), we observed an increased reduction in the number of cancer cells cultured with CRISPRa-UCP1-AAV adipocytes compared to 6-aminonicotinamide and a slightly increased reduction compared to etomoxir (two-tailed t-test P = 0.0163 versus P = 0.0319 for CRISPRa-UCP1-AAV or etomoxir, respectively; Extended Data Fig. 1n).
Modulated human adipose organoids suppress xenograft growth
To examine whether CRISPRa-modulated adipocytes could inhibit cancer growth in tumor xenograft models, we co-transplanted four cancer cell lines (MCF-7 and MDA-MB-436 (breast), Panc 10.05 (pancreas) and DU-145 (prostate)) with CRISPRa-modulated human adipose organoids. Although adipocytes could be used for co-transplantation, adipose organoids offer added advantages, such as providing a three-dimensional (3D) culture that can better recapitulate the heterogeneity of adipose tissue, enhanced response to endogenous stimuli and the ability to form tissue microenvironments that could better integrate with cancer cells following transplantation. We initially established culturing conditions for human adipose organoids. We used immortalized human preadipocytes grown using methods that combine features from three different 3D culturing protocols48,49. In brief, we cultured human preadipocytes in basal DMEM media supplemented with 10% FBS in Nunc 96-well plates treated with Nunclon Delta. Organoids formed after 48 h and were then differentiated into adipose organoids using a differentiation cocktail containing IBMX, dexamethasone, insulin, T3 and rosiglitazone. Adipocytes formed 21 days post differentiation (Extended Data Fig. 2a). Using RT–qPCR, we analyzed these organoids for various adipogenic markers, including FABP4, PLIN1 and ADIPOQ, finding all to be expressed (Extended Data Fig. 2b). We further tested our ability to upregulate UCP1, PPARGC1A and PRDM16 in these organoids using similar methods and AAV gRNAs as in the adipocytes, finding all three genes to show significant upregulation of the target genes (Extended Data Fig. 2c). With the establishment of these adipose organoid-culturing and CRISPRa conditions, we next set out to test whether they can suppress xenograft cancer growth.
To generate xenografts, cancer cells were subcutaneously implanted into immuno-compromised SCID mice. After 6–8 weeks, UCP1-CRISPRa-treated human adipose organoids were mixed with Matrigel and co-transplanted adjacent to palpable tumors. For all subsequent assays, we only used UCP1-CRISPRa, as it showed the most optimal results in our cell culture experiments. Some reports have suggested that brown fat could be linked to cancer-associated cachexia (loss of skeletal muscle and fat)50; therefore, each week we measured the body weight of mice co-transplanted with cancer cells and UCP1-modulated adipose organoids. We found no significant differences in body weight between CRISPRa-treated and control mice (Extended Data Fig. 2d). Tumors and human adipose organoids were collected after 3 weeks (Fig. 2a). Adipose organoids were stained with LipidTox, showing adipocytes were still present in them 3 weeks after implantation (Extended Data Fig. 2e). These organoids also had increased gene expression levels of UCP1, some brown fat genes including PPARGC1A and CPT1b and the GLUT4 glucose transporter compared to control adipose organoids (Extended Data Fig. 2f). All tumor types co-transplanted with CRISPRa-modulated human adipose organoids were significantly smaller than dCas9–VP64-only transplanted human adipose organoids, having over 50% reduction in volume (Fig. 2b). Gene analysis showed that tumors co-transplanted with CRISPRa-treated adipose organoids had decreased expression of the proliferation marker gene MIK67 (Extended Data Fig. 2g) as well as reduced marker gene expression for glycolysis (GLUT4 (except for DU-145), GCK) and FAO (CD36 (except for DU-145), CPT1B) (Extended Data Fig. 2h). Using immunofluorescence, we examined additional tumor marker genes and found that all tumors co-transplanted with UCP1-CRISPRa-modulated human adipose organoids had markedly reduced Ki67+ cells (Fig. 2c). In addition, cancer cells showed decreased levels of hypoxia, identified by having a lower carbonic anhydrase (CA9+) area per image view (Fig. 2d). Furthermore, these tumors exhibited decreased levels of CD31+ area per image view, indicating reduced microvessel density and suggesting a corresponding lower metastatic potential (Fig. 2e). We also found higher levels of caspase-3+ in both MCF-7 and MDA-MB-436 xenografts co-implanted with UCP1-CRISPRa adipose organoids compared to controls, indicating higher apoptotic rates (Extended Data Fig. 2i). To show that this approach can work with another adipocyte cell line, we repeated these experiments for MCF-7 xenografts with UCP1-CRISPRa primary adipocytes and found that they also significantly suppressed tumor growth (Extended Data Fig. 2j). Taken together, these results show that UCP1-CRISPRa-modulated human adipose organoids significantly reduce glycolysis and FAO, reduce hypoxia and inhibit tumor growth for four different cancer types in vivo.
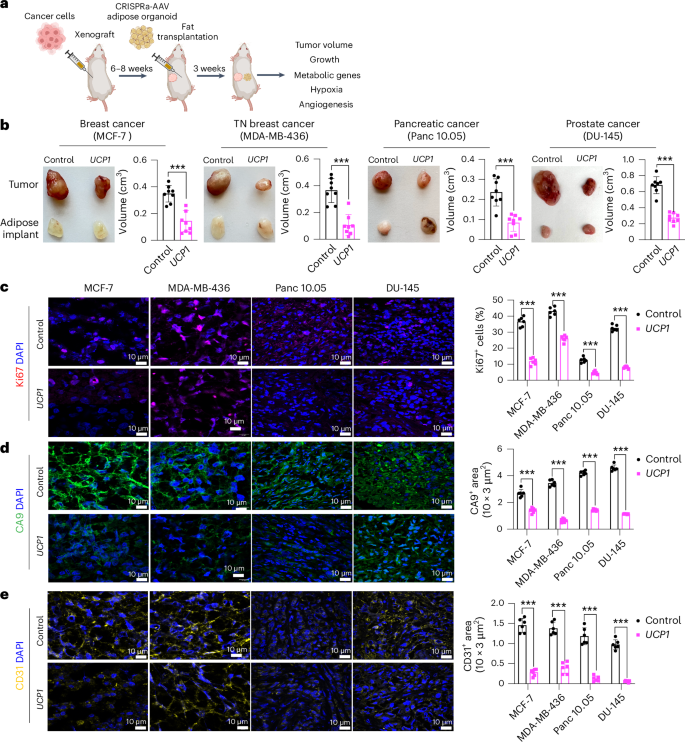
a, Schematic of the co-transplantation model for xenografts and UCP1-CRISPRa-treated human adipose organoids in immune-deficient SCID mice and their subsequent phenotyping (created with BioRender.com). b, Representative images of xenograft tumors from various cancer cell lines, including breast (MCF-7 and MDA-MB-436), pancreatic (Panc 10.05) and prostate cancer (DU-145), that were co-transplanted with UCP1-CRISPRa human adipose organoids or control (dCas9–VP64 only) adipose organoids (n = 8 mice per treatment). TN, triple negative. The bar chart to the right of the images shows the volume of xenograft tumors that were co-transplanted with UCP1-CRISPRa human adipose organoids compared to control (dCas9–VP64 only) (n = 6–8 mice). c–e, Immunofluorescence staining and quantification of Ki67 (c), CA9 (d) and CD31 (e) in cryosections of xenograft tumors (n = 4–5 sections per treatment). Scale bars, 10 μm. All statistical tests were carried out using a two-tailed t-test and data are represented as mean ± s.d. ***P ≤ 0.001.
Modulated adipose organoids outcompete tumors for nutrients
We next set out to characterize the effect of UCP1-CRISPRa adipose organoids on various metabolic parameters and test whether resource competition is involved in the observed cancer suppression. We implanted UCP1-CRISPRa or dCas9–VP64 only (negative control) adipose organoids in SCID mice and, after 6 weeks, used the comprehensive lab animal monitoring system (CLAMS) to measure their whole-body oxygen consumption. Mice implanted with UCP1-CRISPRa adipose organoids exhibited increased whole-body oxygen consumption at all temperatures (Extended Data Fig. 3a). We also carried out both a glucose and insulin tolerance test on these mice, which revealed that all UCP1-CRISPRa-treated mice had increased glucose tolerance and insulin sensitivity (Extended Data Fig. 3b). Following up on these results, we next examined the insulin plasma levels in all four of our xenograft lines, which showed that mice co-transplanted with UCP1-CRISPRa adipose organoids had significantly lower insulin levels than those co-transplanted with dCas9–VP64 control adipose organoids and were comparable to levels of wild-type SCID mice (Extended Data Fig. 3c). Combined, these data suggest that UCP1-CRISPRa-modulated adipose organoids lead to robust energy consumption, enhanced glucose tolerance and insulin sensitivity and reduced insulin levels.
To examine whether UCP1-modulated adipose organoids can prevent glucose uptake in the co-transplanted xenograft tumor, we measure glucose levels in both the adipose organoids and co-implanted MCF-7 tumor. We found that UCP1-modulated adipose organoids had higher glucose levels than controls and that xenograft tumors co-implanted with UCP1-modulated adipose organoids had lower levels of glucose than control tumors (Fig. 3a and Supplementary Table 1). Metabolomics analysis of these tumors found that glucose levels and glycolytic intermediates, including glucose-6-phosphate, fructose-6-phosphate, 3-phosphoglycerate and phosphoenolpyruvate, were lower in the tumors co-implanted with UCP1-modulated adipose organoids than in the control tumors (Fig. 3b and Supplementary Table 1). In addition, the tumors co-implanted with UCP1-modulated adipose organoids had lower fatty acid levels, including oleic acid and palmitoleic acid, than the control tumors (Fig. 3c and Supplementary Table 1).

a, Glucose levels measured from adipose organoids co-transplanted with MCF-7 xenograft tumors using a glucose uptake assay (n = 5–6 biological replicates). b,c, Metabolomics analysis of glucose and glycolysis intermediates, including glucose-6-phosphate (G6P), fructose-6-phosphate (F6P), 3-phosphoglycerate (3-PG) and phosphoenolpyruvate (PEP) (b), and fatty acids, including oleic acid and palmitoleic acid (n = 5 biological replicates) (c). Data are represented as mean ± s.d. d, Schematic of the co-transplantation model for MCF-7 tumor xenograft and UCP1-CRISPRa-treated human adipose organoids in immune-deficient SCID mice fed with standard chow, HFD or 15% glucose containing water and their subsequent phenotyping (created with BioRender.com). e, Representative images and tumor volume of MCF-7 xenografts that were co-transplanted with UCP1-CRISPRa human adipose organoids or control (dCas9–VP64 only) from mice on different diets (n = 4–5 mice per treatment). f, RT–qPCR of proliferation marker gene MKI67 and metabolic genes (GLUT4, GCK, CD36, CPT1b) from MCF-7 xenograft tumors co-transplanted with UCP1-CRISPRa or control (dCas9–VP64 only) human adipose organoids in mice fed with various diets (n = 4–5 biological replicates). g–i, Immunofluorescence quantification from cryosections of xenograft tumors (n = 5 sections per treatment) of Ki67 (g), CA9 (h) and CD31 (i). j, Volcano plot showing P value versus fold change of MCF-7 tumors co-implanted with UCP1-CRISPRa compared to negative-control-treated human adipose organoids in mice on standard chow diet. Differentially expressed genes are those exhibiting at least a ±fourfold change, with their expression being significantly different from basal level (false discovery rate (FDR)-adjusted P < 0.01). k, Gene ontology enrichment of significantly downregulated and upregulated genes in MCF-7 tumors from mice on standard chow, using Geneontology.org (https://geneontology.org)62,63 with an FDR-adjusted Fisher’s Exact test P value of <0.0001. Cell cycle is represented by the term ‘Cell cycle: positive regulation of G2/M transition of mitotic cell cycle’, and cell division by the term ‘Cell division: cytokinesis’. All statistical tests in a–i were carried out using a two-tailed t-test and data are represented as mean ± s.d. *P ≤ 0.05; **P ≤ 0.01; ***P ≤ 0.001.
To further test whether nutrient competition is contributory to the ability of UCP1-CRISPRa-treated adipose organoids to suppress tumor growth, we performed similar MCF-7 xenograft experiments with mice fed with either standard chow, a high-fat diet (HFD) or 15% glucose containing water (Fig. 3d). We found that tumors co-implanted with UCP1-CRISPRa adipose organoids from mice fed with standard chow had significantly lower volume than mice co-implanted with control (dCas9–VP64 only) (Fig. 3e and Extended Data Fig. 3c), which showed significant reduction in volume starting 2 weeks post implantation (Extended Data Fig. 3d). By contrast, HFD-treated or 15% glucose-treated mice showed no apparent difference in tumor growth compared to the negative control (Fig. 3e). Analysis of tumors from mice on a HFD or 15% glucose found that they had expression patterns of the MKI67 proliferation marker, glycolysis (GLUT4, GCK) and FAO (CD36, CPT1B) that are similar to the negative control, whereas mice on a regular chow diet had significantly lower expression for all these markers (Fig. 3f). Similarly, tumors from mice fed with standard chow displayed reduced levels of Ki67+ cells, CA9+ area, and CD31+ area compared to controls, whereas there was no apparent difference in tumors from HFD-treated or 15% glucose-treated mice (Fig. 3g–i and Extended Data Fig. 3e).
We next performed RNA-seq on tumors from all conditions (standard chow, HFD, 15% glucose and negative controls). Principal component analysis revealed that tumors co-implanted with UCP1-CRISPRa-modulated adipose organoids in mice fed with a standard chow diet were significantly different than controls, whereas there was no consistent difference in tumors co-implanted with UCP1-CRISPRa-modulated adipose organoids and control tumors in mice fed with HFD or 15% glucose water (Extended Data Fig. 3f). Tumors co-implanted with UCP1-CRISPRa-modulated adipose organoids in mice fed with a standard chow diet had significantly more global gene expression changes (7,102 differentially expressed genes with 6,623 downregulated and 479 upregulated genes) (Fig. 3j) compared to zero genes for mice treated with a HFD or 15% glucose water (Extended Data Fig. 3g). Among the downregulated genes in the standard chow tumors co-implanted with UCP1-CRISPRa-modulated adipose organoids, we found many metabolic genes, including CPT1b, SCD (stearoyl-CoA desaturase) and FASN (fatty acid synthase), and cancer growth and progression regulated genes, such as MKI67, ITGB4 (ref. 51), LLGL2 (ref. 52), GATA3 (ref. 53), EEF1A2 (refs. 54,55) and TBX2 (ref. 56) (Fig. 3j). Upregulated genes included tumor suppressor genes, such as HOXD10 (ref. 57), GAS7 (ref. 58) and MAP2K4 (ref. 59), and cancer progression genes, including WNT2 (ref. 60) and RAC2 (ref. 61) (Fig. 3j). We next performed gene ontology enrichment analysis using Geneontology.org (https://geneontology.org/)62,63 on differentially expressed genes in tumors of mice fed with standard chow and found downregulated differentially expressed genes to be enriched in pathways involved in metabolic regulation, including FAO, oxidative phosphorylation, cell growth, DNA replication and cell division (Fig. 3k, top). Upregulated enriched pathways included those involved in cellular response to stress response and cell apoptosis (Fig. 3k, bottom). We found no significant pathway changes in tumors in mice fed with HFD or 15% glucose water. In summary, these experiments suggest that UCP1-CRISPRa-modulated adipose organoids outcompete tumors for glucose and fatty acids, as increasing fatty acid or glucose levels abolished cancer suppression.
AMT suppresses cancer development in genetic mouse models
To examine whether our AMT approach can prevent cancer development, we used pancreatic and breast cancer genetic mouse models. For pancreatic cancer, we used the KPC mouse model that, upon tamoxifen treatment, develops PDA caused by conditional mutations in Kras and Trp53 (ref. 64). For breast cancer, we used MMTV-PyMT mice on an FVB background, containing a mouse mammary tumor virus (MMTV) long terminal repeat upstream of the polyomavirus middle T antigen (PyVmT); these mice develop mammary tumors with a mean latency of 53 days65. We first designed five gRNAs targeting the mouse Ucp1 gene and transfected them into mouse 3T3-L1 adipocytes, finding all five to upregulate Ucp1 (Extended Data Fig. 4a). We next selected two gRNA for AAV9 packaging and infected 3T3-L1 differentiated adipocytes with these viruses along with AAV9 dCas9–VP64, finding that all of them significantly increased Ucp1 gene expression levels compared to dCas9–VP64-only control (Extended Data Fig. 4b). We used the top-activating gRNA AAV9 for all subsequent experiments. As organoids have several of the aforementioned advantages, we generated adipose organoids using mouse preadipocytes, using techniques similar to those described for human adipose organoids (Methods). We then infected them with AAV9 dCas9–VP64 and Ucp1-gRNA and observed both mCherry expression from our gRNA virus and significant Ucp1 upregulation (Extended Data Fig. 4c).
We next set out to test whether we can suppress pancreatic cancer development using KPC mice. KPC mice were treated with tamoxifen on postnatal day 0–4. At 4 weeks of age, Ucp1-CRISPRa or dCas9–VP64-only (negative control) adipose organoids were orthotopically implanted next to the pancreas (Fig. 4a). After 6 weeks, the pancreases were removed and analyzed. Over those 6 weeks, we observed no significant difference in body weight between mice implanted with Ucp1-CRISPRa organoids or control organoids (dCas9–VP64 only) (Extended Data Fig. 4d). We found that KPC mice implanted with Ucp1-CRISPRa-upregulated adipose organoids had significantly smaller tumors than those in control dCas9–VP64-implanted mice (Fig. 4b), reduced pancreatic mass and Ck19+ staining (Fig. 4c and Extended Data Fig. 4e). They also showed reduced expression of the proliferation marker Mki67 as well as genes involved in FAO (Cd36, Cpt1b) (Fig. 4d). In addition, we found Ucp1-CRISPRa mice to have lower expression levels of the pancreas’ main glucose transporter, Glut2, but no significant change for the Gck glycolysis marker (Fig. 4d). Ucp1-CRISPRa mice also had a lower number of Ki67+ cells than control mice as determined by immunofluorescence (Fig. 4e and Extended Data Fig. 4e). In addition, we observed lower CA9+ and CD31+ area per image view in mouse tumors implanted with Ucp1-CRISPR adipose organoids, suggesting reduced hypoxia and angiogenesis (Fig. 4e and Extended Data Fig. 4e). These tumors also had slightly increased levels of caspase-3+ cells compared to controls (Extended Data Fig. 4f), suggesting increased apoptosis. Furthermore, we found Ucp1-CRISPRa adipose organoids of KPC mice to have significantly reduced insulin levels compared to control mice (Extended Data Fig. 4g).

a, Schematic of the transplantation model for Ucp1-CRISPRa-treated mouse adipose organoids in KPC pancreatic cancer mice and their subsequent phenotyping (created with BioRender.com). b, Representative images of the pancreas implanted with Ucp1-CRISPRa or control (dCas9–VP64 only) mouse adipose organoids (n = 5–6 mice per treatment). c, Mass and immunofluorescence staining of Ck19 (µm2 per section) of the pancreas transplanted with Ucp1-CRISPRa-modulated mouse adipose organoids compared to control (dCas9–VP64 only) (n = 5–6 mice). d, RT–qPCR of the proliferation marker gene Mki67 and metabolic genes Glut2, Gck, Cd36 and Cpt1b from pancreatic tumors co-transplanted with Ucp1-CRISPRa-modulated adipocytes (n = 5–6 biological replicates). e, Immunofluorescence quantification of Ki67, CA9 and CD31 in cryosections of tumors (n = 5–6 sections per treatment). f, Schematic of the transplantation model for Ucp1-CRISPRa-treated mouse adipose organoids in the mammary gland or on the back of MMTV-PyMT breast cancer mice and their subsequent phenotyping (created with BioRender.com). g, Representative images of the breast tumors that were implanted with Ucp1-CRISPRa or control (dCas9–VP64 only) adipose organoids in the mammary gland or on the back of the mice (dorsal) (n = 4 mice per treatment). h, Volume of the tumors transplanted with Ucp1-CRISPRa adipose organoids compared to control (dCas9–VP64 only) (n = 4 mice). i, RT–qPCR of the proliferation marker gene Mki67 and metabolic genes Glut4, Gck, Cd36 and Cpt1b from breast tumors co-transplanted with Ucp1-CRISPRa-modulated adipocytes (n = 3–4 biological replicates). j–m, Immunofluorescence staining and quantification of Ki67 (j), CA9 (k), CD31 (l) and caspase-3 (m) in tumor cryosections (n = 4–5 sections per treatment). White scale bars on the bottom right represent 10 μm (CA9, CD31, caspase 3) or 20 μm (Ki67 and CA9 DOR-Ucp1). All statistical tests were carried out using a two-tailed t-test and data are represented as mean ± s.d. *P ≤ 0.05; **P ≤ 0.01; ***P ≤ 0.001.
To examine whether our treatment might provide systematic therapeutic effect in suppressing breast cancer growth, we next used MMTV-PyMT female mice, implanting Ucp1-CRISPRa or dCas9–VP64 adipose organoids near the third nipples of 4-week-old mice (Fig. 4f). Given that our experiments suggest a nutrient competition model and cold treatment was previously shown to cause widespread BAT activation and subsequent cancer suppression15, we also examined whether distal implantation of adipose organoids could suppress cancer development by implanting organoids in the back of 4-week-old mice. At 6 weeks post implantation, tumors were dissected and analyzed. We found no difference in body weight of mice implanted with Ucp1-CRISPRa organoids compared to those implanted with control organoids (Extended Data Fig. 4h). Remarkably, we found that both strategies of organoid implantation resulted in significantly reduced tumor size (Fig. 4g) and volume (Fig. 4h) regardless of the site of implantation. Tumors also had decreased expression of the Mki67 proliferation marker and metabolic genes Glut4, Gck, Cd36 and Cpt1b (Fig. 4i). The tumors of mice implanted with Ucp1-CRISPRa adipose organoids had fewer Ki67+ cells than control mice (Fig. 4j). These tumors also had lower CA9+ and CD31+ area per image view and increased caspase-3+ (Fig. 4k–m), suggesting that they have reduced hypoxia and angiogenesis and increased apoptosis. Additionally, mice implanted with Ucp1-CRISPRa adipose organoids had significantly lower plasma insulin levels than control mice (Extended Data Fig. 4i). Taken together, our results indicate that our CRISPRa-modulated adipose organoids could have systematic therapeutic effects in suppressing cancer growth.
Breast dissected modulated adipocytes suppress tumor growth
To further demonstrate the therapeutic potential of AMT, we treated adipocytes obtained from dissected human breast tissues with UCP1-CRISPRa AAV9 and tested their ability to suppress tumor progression by co-culturing them with breast cancer organoids generated from dissected breast tumors or grown from metastatic pleural effusions (Fig. 5a). Samples were obtained from patients who underwent breast surgery or thoracentesis. For the co-culture experiments, we used five different breast cancer organoids generated from patients with early stage or metastatic triple-negative breast cancer (ER−, PR− and human epidermal growth factor receptor 2-negative (HER2−)) or hormone receptor-positive (ER+ and/or PR+), HER2− breast cancer (Supplementary Table 2). Organoids from breast tumor tissue were generated by digesting cells for 1 h in collagenase and organoids from metastatic pleural effusions were generated by isolating tumor spheroids by centrifugation before, in both cases, embedding cancer cells in organoid culture using established protocols that enable long-term propagation of tumor organoids66. In parallel, primary human adipocytes were isolated from human breast tissue using an established protocol67. For the triple-negative breast cancer organoids derived from primary tumors, we used two different cases, including one in which we generated organoids and isolated mammary gland adipose tissue from the same individual (TOR41). Adipocytes were infected with dCas9–VP64 only (negative control) or UCP1-CRISPRa AAV9. After 5 days, they showed strong mCherry expression, a fluorescent marker that is part of the gRNA AAV9 (Extended Data Fig. 5a), suggesting that they can be readily infected by our AAVs. In addition, gene analysis showed that both mCherry and UCP1 expression levels were significantly higher in the UCP1-CRISPRa-treated adipose organoids than in the control organoids (Extended Data Fig. 5b). Owing to the limited amount of obtainable dissected tissues, we measured glucose and fatty acid uptake of adipocytes isolated from one sample for which we had more abundant material (TOR40). Upon insulin treatment, we found that UCP1-CRISPRa-modulated mammary gland adipocytes exhibited increased glucose and fatty acid uptake compared to dCas9–VP64-treated adipocytes (Extended Data Fig. 5c).
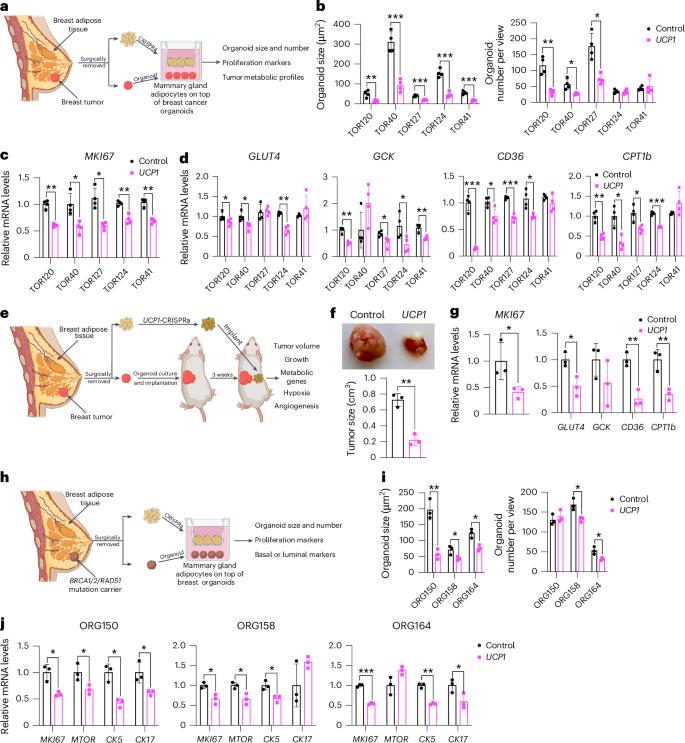
a, Schematic of the co-culturing model of UCP1-CRISPRa-modulated human mammary adipocytes and breast cancer organoids from dissected breast tumors (created with BioRender.com). b, Cancer organoid size and numbers of breast tumor organoids from five dissected breast tumors that were co-cultured with UCP1-CRISPRa adipocytes or control (dCas9–VP64 only) adipocytes (n = 4 biological replicates). c,d, RT–qPCR of the proliferation marker gene MKI67 (c) and metabolic genes GLUT4, GCK, CD36 and CPT1b (d) of breast cancer organoids that were co-cultured with CRISPRa-modulated adipocytes (n = 4 biological replicates). e, Schematic of the co-transplantation model for breast cancer organoids and UCP1-CRISPRa-treated breast adipocytes in immune-deficient SCID mice and their subsequent phenotyping (created with BioRender.com). f, Representative images and tumor size of breast cancer organoids co-implanted with UCP1-CRISPRa or control (dCas9–VP64 only) breast adipocytes (n = 3 biological replicates). g, RT–qPCR of the proliferation marker gene MKI67 and metabolic genes GLUT4, GCK, CD36 and CPT1b of breast cancer organoids that were co-cultured with UCP1-CRISPRa or dCas9–VP64-treated breast adipocytes (n = 3 biological replicates). h, Schematic of the co-culturing model of UCP1-CRISPRa-modulated human mammary adipocytes and breast organoids cultured from breast tissues of BRCA1/BRCA2/RAD51D mutation carrier donors (created with BioRender.com). i, Organoid size and numbers of breast organoids from three resected breast tissues that were co-cultured with UCP1-CRISPRa adipocytes or control (dCas9–VP64 only) adipocytes (n = 3 biological replicates). j, RT–qPCR of the proliferation marker genes MKI67 and MTOR and CK5 and CK17 of breast organoids that were co-cultured with CRISPRa-modulated adipocytes (n = 3 biological replicates). All statistical tests were carried out using a two-tailed t-test and data are represented as mean ± s.d. *P ≤ 0.05; **P ≤ 0.01; ***P ≤ 0.001.
To test whether UCP1-CRISPRa AAV9 adipocytes can suppress cancer growth, we added them to a hydrogel dome on top of the breast cancer organoids with a fully defined organoid medium66 and co-cultured for 5 days (Fig. 5a). In all five cases, we observed a significant reduction in cancer organoid size and, in most organoids, also a reduction in organoid number (TOR124 and TOR41 were not significant) upon incubation with adipocytes infected with UCP1-CRISPRa AAV9 compared to the dCas9–VP64-only treated cells (Fig. 5b and Extended Data Fig. 5d). All five cancer organoid cases co-cultured with UCP1-CRISPRa had significantly lower proliferation marker MKI67 expression compared to the negative control (Fig. 5c). We also observed significantly decreased levels of GLUT4, GCK, CD36 and CPT1b for most of the UCP1-CRISPRa co-cultured cancer organoids (Fig. 5d), suggesting that they have lower glycolysis and fatty acid metabolism.
We next tested whether UCP1-CRISPRa primary breast adipocytes can suppress breast cancer growth in vivo. We implanted triple-negative breast cancer organoids derived from resected breast tumor into SCID mice for 3 weeks. We used the floating fraction of mature adipocytes in breast tissue. The cells were cultured, treated with UCP1-CRISPRa and mixed with Matrigel before their co-implantation for 3 weeks into mice with tumors (Fig. 5e). After 3 weeks, the tumors were dissected and examined. We found that tumors co-implanted with UCP1-CRISPRa adipocytes were significantly smaller than those co-implanted with dCas9–VP64-treated adipocytes (Fig. 5f). In addition, tumors co-implanted with UCP1-CRISPRa adipocytes had lower expression of MKI67, glycolytic genes (GLUT4 and GCK) and FAO genes (CD36 and CPT1b) (Fig. 5g). Overall, our results demonstrate that human adipocytes from dissected breast tissue can upregulate UCP1 via AAV9-CRISPRa and are able to reduce glycolysis and fatty acid metabolism and suppress breast cancer organoid growth, both in cell culture and xenografts. Furthermore, this work demonstrates the potential clinical utility of an ex vivo autologous transplantation of CRISPRa-modulated adipocytes to treat cancer.
AMT suppresses high breast cancer risk cell proliferation
To examine whether UCP1-CRISPRa mammary adipocytes might prevent cancer development in individuals at high lifetime risk of cancer, we co-cultured them alongside breast organoids from dissected patient-matched breast tissue of BRCA1/BRCA2/RAD51D mutation carriers (Fig. 5h). We obtained three samples dissected from individual donors carrying a BRCA1 mutation (ORG158), a BRCA2 mutation (ORG150) and a RAD51D mutation (ORG164) (details of specific mutations and patient history in Supplementary Table 2). In all three cases, we observed that breast organoids co-cultured with donor-matched UCP1-CRISPRa adipocytes were significantly smaller and had lower organoid numbers (other than ORG150) than in the negative control (Fig. 5i). In addition, we found that BRCA1/BRCA2 breast organoids co-cultured with UCP1-CRISPRa adipose organoids had lower expression levels of known proliferation markers MKI67 and MTOR than that of controls (Fig. 5j). Furthermore, these breast organoids exhibited reduced expression levels of CK5 and CK17 (other than ORG158) suggesting reduced basal–luminal phenotypes in these BRCA1/BRCA2/RAD51D-heterozygous luminal progenitor-predominant breast cells68,69 (Fig. 5j). In summary, our results suggest that UCP1-CRISPRa breast adipocytes may inhibit premalignant phenotypes in breast organoids from donors with inherited cancer predisposition syndromes.
Inducible or cell-scaffold AMT suppresses cancer progression
To further enhance the translation capabilities of AMT, we developed inducible AAV vectors designed to turn on dCas9–VP64 upon tetracycline treatment, thereby enabling tight regulation of UCP1 gene expression in adipocytes or adipose organoids. We cloned the reverse tetracycline-control transactivator (rtTA) downstream of the CMV promoter into the gRNA-AAV vector and the tetracycline response element (TRE) and a minimal promoter upstream of dCas9–VP64 in the dCas9–VP64 AAV vector. Upon tetracycline treatment, rtTA binds to TRE and induces expression of dCas9–VP64 (Fig. 6a). To first test this system, we infected TRE-dCas9-VP64-AAV with or without the rtTA-UCP1-gRNA-AAV, followed by the addition of DMSO or doxycycline to human adipocytes. We found that only cells in which both TRE-dCas9-VP64-AAV and rtTA–UCP1-gRNA-AAV were transduced and treated with doxycycline had increased expression levels of Cas9 and UCP1 (Extended Data Fig. 6a). We next generated MCF-7 xenografts in SCID mice and, after 4 weeks, implanted inducible UCP1-CRISPRa human adipose organoids. Following adipose organoid implantation, mice were fed a doxycycline diet for 3 weeks and tumors were subsequently dissected and examined. We found that tumors co-implanted with the inducible UCP1-CRISPRa human adipose organoids were significantly smaller than ones co-implanted with dCas9–VP64-treated adipose organoids (Fig. 6b). These tumors also had lower expression of the proliferation marker MKI67, glycolytic genes (GLUT4 and GCK) and FAO genes (CD36 and CPT1b) (Fig. 6c).

a, Schematic of the inducible CRISPRa-AAV system (created with BioRender.com). Upon tetracycline treatment, rtTA binds to TRE and induces dCas9–VP64 expression. b, Representative image and tumor size of MCF-7 tumors that were co-implanted with UCP1-CRISPRa or control (dCas9–VP64 only) human adipose organoids (n = 4 biological replicates). c, RT–qPCR of proliferation marker gene MKI67 and metabolic genes (GLUT4, GCK, CD36 and CPT1b) of tumors co-implanted with CRISPRa-modulated adipocytes (n = 4–5 biological replicates). d, Schematic of co-transplantation of MCF-7 tumors and cell scaffolds containing UCP1-CRISPRa or control (dCas9–VP64 only) human adipose organoids and tumor phenotyping (lower panel created with BioRender.com). e, Representative images of cell scaffolds in plate (left), electron microscopy image (1.0 kV, ×500 and 7.895 mm lens) of scaffold containing an adipose organoid (middle) and the scaffold implanted in mice (right). f, Representative image and tumor size of MCF-7 tumors co-implanted with cell scaffold containing UCP1-CRISPRa or control (dCas9–VP64 only) human adipose organoids (n = 4–5 biological replicates). g, RT–qPCR of the proliferation marker gene MKI67 and metabolic genes (GLUT4, GCK, CD36, and CPT1b) of tumors co-implanted with CRISPRa-modulated adipocytes (n = 4–5 biological replicates). h, Cell number per view of PANC-1 pancreatic cancer cells that were co-cultured with UPP1-CRISPRa or control (dCas9–VP64 only) human adipocytes in media without (–) or with (+) 1 mM uridine (n = 5 biological replicates). i, ATP levels measured in PANC-1 pancreatic cancer cells co-cultured with UPP1-CRISPRa-modulated adipocytes without (–) or with (+) excess uridine (n = 5 biological replicates). j, NADH and lactate levels in PANC-1 pancreatic cancer cells that were co-cultured with UPP1-CRISPRa-modulated adipocytes without the addition of uridine (n = 5 biological replicates). k, Schematic of the co-transplantation of PANC-1 tumors with UPP1-CRISPRa-modulated adipose organoid in SCID mice. l, Representative image and size of PANC-1 xenograft tumor co-implanted with dCas9–VP64 or UPP1-CRISPRa-modulated adipose organoids (n = 5 biological replicates). m, RT–qPCR of MKI67. n, NADH and lactate levels in PANC-1 tumors that were co-implanted with dCas9–VP64 or UPP1-CRISPRa-modulated adipose organoids (n = 5 biological replicates). All statistical tests were carried out using a two-tailed t-test and data are represented as mean ± s.d. *P ≤ 0.05; **P ≤ 0.01; ***P ≤ 0.001.
To further showcase the clinical applicability of AMT, we inserted UCP1-CRISPRa human adipose organoids into a polymer microwell scaffold generated from polycaprolactone (PCL) and implanted it alongside tumors (Fig. 6d). The microwell scaffold organoid delivery platform is made from biodegradable polyester PCL and manufactured using a microfabrication process involving photolithography and micromolding70,71,72. We made PCL scaffolds patterned with arrays of cylindrical microwells73,74,75,76,77. The microwells present a controlled 3D microenvironment that provides a supportive niche for the survival, function and enhanced integration of transplanted organoids72,78,79. Here, we manufactured microwells of 500 μm diameter, specifically designed to accommodate and spatially organize adipose organoids for transplantation. Using scanning electron microscopy (SEM), we found that adipose organoids attached to the microwell scaffold with filopodia and lamellipodia, suggesting that the implant is stable and can be extracted after implantation without leaving residual organoids (Extended Data Fig. 6b). We next generated MCF-7 xenografts in SCID mice for 4 weeks, loaded UCP1-CRISPRa or dCas9–VP64-only (negative control) human adipose organoids onto the device and co-implanted them next to the xenograft (Fig. 6d,e). After 3 weeks, tumors were dissected and examined. We found that tumors co-implanted with the scaffold containing UCP1-CRISPRa human adipose organoids were significantly smaller than tumors co-implanted with the control scaffold adipose organoids containing dCas9–VP64 only (Fig. 6f). Furthermore, these tumors had lower expression levels of the proliferation marker MKI67, glycolytic genes (GLUT4 and GCK) and FAO genes (CD36 and CPT1b) (Fig. 6g). Combined, these data show that AMT can be used in an inducible manner or delivered by an integrated cell-scaffold delivery platform that can be readily removed or replaced to fit the changing tumor metabolic landscape.
Uridine-based AMT suppresses PDA
To examine whether AMT can be used to treat other cancer-associated metabolic pathways, we upregulated the uridine phosphorylase 1 (UPP1) gene in human adipocytes and adipose organoids and tested whether they can suppress PDA, which is known to use uridine-derived ribose in glucose-restricted conditions35. Using CRISPick36, we designed five gRNAs to upregulate UPP1 gene expression in human adipocytes and found that all gRNAs were able to induce UPP1 expression in these cells (Extended Data Fig. 6c). We next generated an AAV9 virus for two gRNAs and transduced human adipocytes with AAV9, finding that both gRNAs significantly induced UPP1 gene expression (Extended Data Fig. 6c). We used the top-activating gRNA AAV for all subsequent experiments. We next transduced human adipocytes with UPP1-CRISPRa AAV9 and incubated these cells with 3H-labelled uridine. We found these adipocytes to significantly uptake uridine during a 12-h incubation (Extended Data Fig. 6d) and have increased lactate levels, a byproduct of uridine catabolism (Extended Data Fig. 6e). We next co-cultured a PDA cell line, PANC-1, with UPP1-CRISPRa or dCas9–VP64 only (negative control) human adipocytes on top of Transwell plates. Cells were cultured in low-glucose-containing media with or without an excess amount of uridine. We found that PANC-1 cells that were co-cultured with the UPP1-CRISPRa adipocytes had a significantly lower number of cells than those co-cultured with dCas9–VP64 adipocytes (Fig. 6h). This growth suppression was abolished with the addition of uridine (Fig. 6h). PANC-1 cells that were co-cultured with UPP1-CRISPRa adipocytes had lower ATP levels than control PANC-1 cells. By contrast, with an excess amount of uridine, there was no apparent difference in ATP levels between PANC-1 cells with UPP1-CRISPRa adipocytes and control cells (Fig. 6i). Furthermore, PANC-1 cells that were co-cultured with UPP1-CRISPRa-modulated adipocytes had lower NADH and lactate levels than control cells (Fig. 6j). We next carried out a similar study but grew the cells in a high-glucose-containing media and found that the growth suppression of PANC-1 by UPP1-CRISPRa adipocytes was reduced (Extended Data Fig. 6f). Combined, these assays suggest that UPP1-CRISPRa adipocytes have increased uridine use and can outcompete PDA for uridine use in low-glucose conditions.
We next set out to test whether UPP1-CRISPRa can suppress PDA xenograft growth. We implanted PANC-1 cells in SCID mice for 4 weeks, followed by the implantation of UPP1-CRISPRa and dCas9–VP64 only (negative control) adipose organoids (Fig. 6k). After 3 weeks, tumors were dissected and examined. We found that tumors co-implanted with UPP1-CRISPRa human adipose organoids were significantly smaller than those co-implanted with dCas9–VP64 adipose organoids (Fig. 6l). In addition, these tumors had lower expression of the proliferation marker MKI67 (Fig. 6m). All the byproducts of uridine catabolism, including NADH and lactate, were found to be significantly reduced in tumors co-implanted with UPP1-CRISPRa human adipose organoids (Fig. 6n). In summary, these results suggest that CRISPRa upregulation of UPP1 in adipocytes and adipose organoids reduces uridine in the tumor microenvironment of PDA and leads to cancer growth suppression. These results also demonstrate the clinical versatility and capacity of AMT to target various cancer metabolic pathways.
Discussion
Cancer cells are fast-proliferating cells that require large amounts of nutrients, including glucose and fatty acids. They can reprogram metabolic pathways to use available substrates in the surrounding environment. Targeting their metabolism can be a potent cancer treatment. Here, we developed a cell-based cancer therapeutic approach that uses modified adipocytes to target various cancer metabolic pathways and has the potential to treat a wide variety of cancers. Adipocytes offer a unique ex vivo therapeutic system, with many of the needed procedures already established in the clinic. Liposuction and fat transplantation are commonly used in many surgical procedures, such as aesthetic and reconstructive surgery. Owing to successful engraftment, adipose tissue transplantation has progressively evolved, not only in plastic and reconstructive surgery but also for therapeutic treatments80. Several reports using rodent models have shown that BAT transplantation has beneficial metabolic outcomes81,82,83,84. These also include the use of UCP1-CRISPRa modulation in human white preadipocytes to induce browning, followed by their transplantation in mice on a HFD, leading to improved body weight, glucose tolerance and insulin sensitivity34. Our work showcases how these ‘brown’ adipocytes and adipose organoids can be used for cancer treatment. In addition, given that adipocytes are ‘metabolic engines’, they can also be engineered to outcompete tumors that use various metabolic pathways, as we show for PDA. Adipocytes are also extensive secretors85, and AMT could be used to secrete tumor-targeting factors. The use of cell scaffolds, as done here, could be leveraged by removing and replacing cell scaffolds that contain adipose organoids that target different cancer metabolic pathways, further ‘personalizing’ this therapeutic approach.
There is a growing interest in implementing human adipose tissue grafting by using adipose stem cells or progenitors because of their resistance to trauma and long-term survival following transplantation. One such example is the use of CRISPRa to upregulate the relaxin family peptide receptor 1 (RXFP1) gene in adipose-derived stem cells and their transplantation in a diabetes mellitus-induced erectile dysfunction rat model, showing amelioration of the erectile dysfunction phenotype86. Organoids could be advantageous for these cells, as they provide a 3D culture that can better recapitulate the heterogeneity of adipose tissue, respond better to endogenous stimuli and form tissue microenvironments that could more efficiently integrate with cancer cells following transplantation. Several groups have successfully grown adipose organoids from mouse adipose stem cells33,48,49,87. Here, we were able to culture human adipose organoids from preadipocytes using various conditions from previous studies33,48,49,87. These human adipose organoids exhibited mature adipocyte markers, including FABP4 and PLIN1. Finally, in our study, we show that the CRISPRa modulation can significantly reduce tumor size, glycolysis, fatty acid metabolism and uridine use and improve hypoxia and angiogenesis in cancer mouse models. Further development of these organoids and their modulation as well as determination of the number of cells needed to achieve a therapeutic benefit could improve these attributes and their therapeutic use for a wide range of diseases.
Our work builds on the recent observation that activating BAT through cold exposure increases adipocyte glucose uptake and lipid metabolism and significantly inhibits tumor progression15. Here, instead of placing tumor models in cold conditions, we took advantage of CRISPRa to increase the gene expression of key BAT regulators, including UCP1, PPARGC1A and PRDM16, to engineer adipocytes to have increased glucose and fatty acid uptake and metabolism and then used them to deplete resources from cancer cells. Similar to the BAT cold activation studies15, we observed that high glucose feeding mitigates cancer suppression. In addition, we show that MCF-7 xenograft mice on a HFD have reduced cancer suppression, suggesting that fatty acid competition is also involved in this mechanism. Implanting CRISPRa-modulated adipose organoids distal to the tumors also led to suppression of cancer growth, suggesting that resource competition, similar to BAT cold activation studies15, can be carried out distal to the tumor and that complex surgical implantation procedures for tumors with limited access might not be needed for AMT. The observed tumor suppression could also be a result of additional mechanisms. The CRISPRa-modulated adipose organoids could modulate whole-body metabolism. Previous studies have shown that hyperinsulinemia can lead to cancer growth due to insulin being a powerful mitogen and survival factor88,89,90. For example, the administration of dapagliflozin, an SGLT2 inhibitor that lowers blood glucose, and a controlled-release mitochondrial protonophore (CRMP) suppresses cancer growth in mice by reversing hyperinsulinemia91. Given that BAT is widely known to reduce whole-body blood glucose and insulin levels in humans15,83,92, we reason that the CRISPRa-modulated adipose organoids could also reduce cancer progression by lowering plasma insulin levels. Indeed, our data, using both xenograft and genetic mouse models, show that mice implanted with CRISPRa-modulated adipose organoids exhibit reduced plasma insulin levels compared to the dCas9–VP64 control mice (Extended Data Figs. 3c and 4g,i).
Among BAT-activating genes, UCP1 showed the most robust effect in terms of cancer suppression. It would be interesting to further develop this AMT approach to upregulate additional genes that could aid in cancer therapy. These could include, for example, upregulation of GLUT1 and GLUT4, which are the main glucose transporters in adipose cells, with GLUT4 being the most abundant and insulin-responsive93; glucose-metabolism-associated genes, such as the transcription factor FOXO1 (ref. 94) and the G-protein coupled receptors GPR40 and GPR120, which have been implicated in improved glucose uptake and insulin resistance95,96; AIFM2, which promotes glycolysis in BAT97; and FAO-associated genes, including, for example, the fatty acid transporter CD36, a key transporter for FAO, CPT1b and the fatty acid breakdown enzyme, ACC1. Finally, as shown in our study with UPP1-CRISPRa and PDA, AMT can be customized to fit different cancer metabolic programs. Additional modifications could also be engineered in these adipocytes and adipose organoids, including the use of their endocrine capabilities98 to secrete chemotherapeutic drugs or other cancer therapeutic-associated compounds or take advantage of their extracellular vesicles, which are known to have an important role in metabolic regulation99. AMT could also be readily implemented with various cancer treatments (surgery, drugs, chemotherapy, radiation and others) that, combined, will increase therapeutic impact.
In this study, we used AAV-based CRISPRa to upregulate genes. CRISPRa has several advantages, including tight regulation owing to the use of the endogenous regulatory machinery100 and the ability to simultaneously upregulate multiple genes. However, it is worth noting that both upregulation and delivery could also be carried out using other modalities. For example, gene upregulation could be carried out using zinc fingers, TALENs, generation of specific mutations using regular CRISPR editing or base or prime editing in promoters or enhancers, or standard overexpression using a cDNA mammalian expression construct of the gene of interest. Adipocytes could also be ‘browned’ using various differentiation cocktails101, cold activation15 or drugs, such as β3 agonists102,103, which could also be used to achieve higher competition for nutrients. In addition, various drugs could be used to induce different metabolic pathways. Delivery could be carried out with other viruses, such as lentiviruses that are widely used for chimeric antigen receptor (CAR)-T cell therapy but have a major caveat of genomic integration, or various non-viral nucleic acid delivery vehicles such as nanoparticles104 or virus-like particles105. Various drugs could also be used to upregulate specific genes in adipocytes in a global manner in cancer patients. In addition, the downregulation of certain genes in adipocytes or adipose organoids using CRISPR inactivation (CRISPRi), short interfering RNA, CRISPR editing or other techniques could also be used for AMT. For example, a recent study used CRISPR to deplete the nuclear receptor interacting protein 1 (NRIP1) gene to make ‘brown’ adipocytes that, upon implantation, decreased the adiposity of mice on a HFD106.
A link between obesity, excess amount of WAT and cancer development and progression has been established, with nearly 40% of all cancer deaths in the United States being attributed to obesity107. There have been numerous mechanisms proposed to explain how WAT is linked to cancer development and progression, including chronic inflammation, hyperinsulinemia, steroid hormones and adipokines108,109,110,111,112,113,114. In addition, in glucose-rich conditions, cancer cells synthesize de novo fatty acids from intermediates of the glycolysis–TCA cycle (lipogenesis)115,116. The synthesized fatty acids are then used to synthesize triglycerides and are stored as lipid droplets in cancer cells. When energy is needed, these lipid droplets undergo lipolysis to release fatty acids, which are subjected to β-oxidation116,117,118. Given that BAT is highly associated with improved glucose tolerance and insulin sensitivity119, one could envision a personalized treatment developed for patients with cancer and obesity, whereby AMT is used not only to target cancer and its unique metabolism but also to treat the patients’ metabolic disease. One major hurdle in our approach that needs to be taken into account is cancer-associated cachexia50. Although we did not observe weight loss in our mouse models, a longer treatment time could potentially lead to a reduction in body weight, as was shown for UCP1-CRISPRa mice on a HFD34. Having the ability to control transgene expression in the modified adipocytes and adipose organoids using drugs (such as tetracycline used in our assays) or the ability to remove these cells with the use of an integrated cell-scaffold delivery platform (as also done in our study) could allow the use of this therapeutic approach in a tightly regulated and reversible manner120,121,122,123,124,125. This potential to turn therapeutic intervention on and off holds the key to effectively addressing concerns regarding unforeseen clinical complications, adverse outcomes, changing patient conditions or emerging developments in treatment regimens or tumor metabolic pathways.
In summary, our results provide proof-of-principle results for a cancer therapeutic approach, termed AMT, that can be further developed and personalized for specific cancers and patients. Similar to CAR-T cell therapy, AMT can be readily used in the clinic because cells can be obtained from cancer patients through liposuction or other procedures, engineered and transplanted back into the same individual for therapeutic benefit. The use of adipocytes from dissected breast tissue, as performed in our study, further showcases the clinical utility of such an ex vivo approach. In particular, this could be particularly straightforward for breast cancer, as many mastectomies are followed up by reconstructive surgery with autologous tissue126, which could be manipulated before this procedure. Unlike T cells, adipocytes have a lower immune response34,127, which could allow more straightforward development of ‘off-the-shelf’ adipocytes or adipose organoids for cancer and other treatments. Their ease of growth in culture, longevity, robustness, lower multiplicity128 and endocrine capabilities, along with existing clinical procedures for removal and transplantation, make them a beneficial cell type for cancer and other cellular-based disease therapies.
Methods
Human and mouse adipocytes
For adipocyte differentiation, human preadipocytes or mouse 3T3-L1 preadipocytes were used (both kind gifts from H. Sook Sul, UC Berkeley). For human cells, the cell line was immortalized and a single-cell clone was established from primary preadipocytes (Cell Applications, 802S-05A). Cells were cultured to 100% confluency in DMEM, supplemented with 10% FBS, and fresh media was replaced. After 48 h, cells were subjected to adipocyte differentiation by adding a cocktail of IBMX (0.5 M) (Sigma-Aldrich, 410957), dexamethasone (1 µM) (Sigma-Aldrich, D1756) and insulin (10 µg ml−1) (Sigma-Aldrich, I9278). The media was replaced every 2 days with insulin-containing DMEM complete media (Fisher Scientific, 11-965-118) during differentiation.
Cancer cell lines
All cancer cells were acquired from American Type Culture Collection (ATCC). MCF-7 cells (ATCC, HTB-22) were cultured in Eagle’s minimum essential medium (ATCC, 30-2003), supplemented with 10% FBS and 10 µg ml−1 human recombinant insulin (Sigma-Aldrich, I9278). MDA-MB-436 cells (ATCC, HTB-130) were cultured in Leibovitz’s L-15 medium (ATCC, 30-2008) with 10 µg ml−1 insulin,16 µg ml−1 glutathione (Sigma-Aldrich, G6013) and 10% FBS. SW-1417 cells (ATCC, CCL-238) were grown in Leibovitz’s L-15 medium supplemented with 10% FBS. PANC 10.05 cells (ATCC, CRL-2547) were cultured in RPMI-1640 medium (ATCC, 30-2001) with 10 µg ml−1 human insulin and 15% FBS. DU-145 cells (ATCC, HTB-81) were cultured in Eagle’s minimum essential medium with 10% FBS. PANC-1 cells (ATCC, CRL-1469) were cultured in DMEM medium (ATCC, 30-2002) supplemented with 10% FBS.
CRISPRa-AAV in vitro optimization
Five gRNAs targeting the promoter of human UCP1, PPARGC1A, PRDM16 and UPP1 or mouse Ucp1 were designed using CRISPick129 (Supplementary Table 3). These guides were individually cloned into pAAV-U6-sasgRNA-CMV-mCherry-WPREpA100 (Addgene, 217015) at the BstXI and XhoI restriction enzyme sites using the In-Fusion (Takara Bio, 638910) cloning method100. A total of 5 × 10⁵ human preadipocytes or mouse 3T3-L1 cells were plated onto 12-well plates and then subjected to the adipocyte differentiation protocol after 2 days of confluency. At day 4 of differentiation, cells were transfected with 0.5 µg of dCas9–VP64 and 0.5 µg of gRNA plasmid using X-tremeGene (Sigma-Aldrich, 6366236001) and CombiMag reagent (OZ Biosciences, CM21000) following the manufacturer’s protocol. At day 8 of differentiation, cells were lysed with Trizol, RNA was collected and cDNA and RT–qPCR were performed as described in the ‘RNA isolation and RT–qPCR’ section below. The two gRNAs with the highest upregulation for each gene were packaged into rAAV9 serotype virions. rAAV9 serotype virions were produced by transfecting AAVpro 293T cells (Takara, 632273) with pCMV-sadCas9-VP64 (Addgene, 115790) or pAAV-U6-sasgRNA-CMV-mCherry-WPREpA100 along with packaging vectors, including PAAV2/9n (Addgene, 112865) and pHelper vectors using TransIT293 reagent (Mirus, 2700). After 72 h, AAV particles were collected and purified using the AAVpro Cell & Sup. Purification Kit Maxi (Takara, 6676) and quantified by the AAVpro Titration Kit (Takara, 6233). gRNA AAV (1 × 10⁶ multiplicity of infection (MOI)) and dCas9–VP64 AAV (1 × 10⁶ MOI) were used to infect human and mouse differentiated adipocytes. After 5 days, RNA was collected, cDNA was prepared and RT–qPCR was carried out as described below.
RNA isolation and RT–qPCR
Total RNA from sorted or cultured cells was extracted using Trizol reagent (Thermo Fisher, 15596026). Reverse transcription was performed with 1 μg of total RNA using the qScript cDNA Synthesis Kit (Quantabio, 95047) following the manufacturer’s protocol. RT–qPCR was performed on the QuantStudio 6 Real-Time PCR System (Thermo Fisher) using Sso Fast (Bio-Rad, 1725205). Statistical analysis was performed using ΔΔCt method with Gapdh primers as a control (see primer sequences in Supplementary Table 3).
Seahorse assay
Human preadipocytes (5 × 10⁵ cells per well) were plated in 12-well plates and subjected to the adipocyte differentiation protocol. Adipocytes and cancer cell lines were trypsinized and reseeded in XF96 plates (Agilent, 102905-100) at 2 × 10⁴ cells per well and assayed the next day. On the day of the experiments, the cells were washed two times and maintained in XF base medium (Agilent, 103334) supplemented with either 1 mM sodium pyruvate (Thermo Fisher, 11360070) and 17.5 mM glucose (Sigma-Aldrich, G7021) for the mitochondria stress test or 2 mM glutamine (StemCell technologies, 07100) for the glycolysis test. For FAO tests, cells were washed and incubated with substrate-limiting medium DMEM (Corning, 17-207-CV) supplemented with 0.5 mM glucose, 1 mM GlutaMAX (Thermo Fisher, 35050061), 0.5 mM carnitine (Sigma-Aldrich, C0283) and 1% FBS. Cells were incubated at 37 °C in a non-CO2 incubator for 1 h. The assay was performed using a Seahorse XFe96 analyzer (Agilent, XFe96). Oxygen consumption was measured under 1.5 μM oligomycin (Sigma-Aldrich, 75351), 2 μM FCCP (Sigma-Aldrich, C2920) and 0.5 μM Rotenone (Sigma-Aldrich, R8875) and antimycin (Sigma-Aldrich, A8674). The ECAR was measured under 10 mM glucose, 1 µM oligomycin and 50 mM 2-deoxyglucose (Sigma-Aldrich, D8375).
Glucose uptake assay
Human preadipocytes (3 × 10⁵ cells per well) were plated in 96-well tissue culture plates and subjected to the adipocyte differentiation protocol. The day before the assay, the media was replaced with low serum-free media. On the day of the assay, using glucose uptake-Glo assay (Promega, J1342), cells were incubated with 1 nM insulin (Sigma-Aldrich, I9278) for 1 h before the assay following the manufacturer’s protocol.
Fatty acid uptake assay
Human preadipocytes (3 × 10⁵ cells per well) were plated in 96-well tissue culture plates and subjected to the adipocyte differentiation protocol or 1 × 10⁵ human mammary gland adipocytes were plated in 96-well plates. On the day of the assay, the media was replaced with serum-free media. Using the fatty acid uptake kit (Sigma-Aldrich, MAK156), cells were incubated with 1 nM insulin (Sigma-Aldrich, I9278) for 30 min before the assay following the manufacturer’s protocol.
Western blot
To generate a UCP1-positive control, 2 µg of a FLAG-tagged human UCP1 plasmid (Origene, RC218901) was mixed with 200 µl of Opti-MEM (Fisher Scientific, 31985062) and 4 µl of X-tremeGENE HP DNA Transfection Reagent (Roche, XTGHP-RO) and incubated for 15 min. The mixture was added onto AAVpro 293T cells (Takara, 632273) at 6 × 10⁵ per well in a six-well plate and cells were collected 48 h after the transfection. Cells for all conditions were washed twice with DPBS (Sigma-Aldrich, D8537) and dissolved with RIPA buffer (Fisher Scientific, PI89900) containing proteinase inhibitor cocktails and EDTA (Fisher Scientific, PI78440). After shaking for 5 min at 4 °C, cell lysates were centrifuged at 12,000g at 4 °C for 10 min to collect the supernatant, and protein concentrations were determined with a BCA protein assay kit (Fisher Scientific, 23227). The cell lysate was mixed with Laemmli SDS sample buffer, reducing (6X) (Fisher Scientific, J61337.AD) to prepare a 1 µg µl−1 concentration and placed at 95 °C for 5 min in a programmed heat block. SDS–PAGE was performed on the denatured lysate (10 µg per lane for GAPDH and 40 µg ml−1 for other conditions) using Bolt Bis-Tris Mini Protein Gels, 4–12%, 1.0 mm (Fisher Scientific, NW04120BOX) and Bolt MES SDS Running Buffer (Fisher Scientific, B0002). PageRuler Plus Prestained Protein Ladder (Fisher Scientific, 26619) was used as a molecular weight marker. The gels were transferred onto membranes using iBlot2 (Fisher Scientific, IB23002). The membranes were blocked with PVDF Blocking Reagent for Can Get Signal (Toyobo, NYPBR01) for 1 h and treated with primary antibody solutions for hGAPDH and hUCP1(antibody information in Supplementary Table 4) diluted 1,000-fold with Can Get Signal solution 1 (Toyobo, NKB-101) overnight at 4 °C. The membranes were washed twice with DPBS containing 0.02% Tween 20 (Bio-Rad, 1706531) and a secondary antibody solution diluted with Can Get Signal solution 2 was added (Toyobo, NKB-101). After incubation for 1 h at 20 °C room temperature, the membranes were washed twice with DPBS containing 0.02% Tween 20. Antigens were detected with the ECL 2 Western Blotting Substrate detection reagent (Fisher Scientific, PI80196) and imaged on an ImageQuant 800 (Cytiva).
Co-culturing CRISPRa-modulated adipocytes with cancer cells
A total of 5 × 10⁵ human preadipocytes were plated in 12-well tissue culture plates and subjected to the adipocyte differentiation protocol. On day 2 of differentiation, cells were transduced with gRNA AAV (1 × 10⁶ MOI) and dCas9–VP64 AAV (1 × 10⁶ MOI). After 6 days, cells were collected and replated into the upper well of a 12-well Transwell plate (Corning, 07-200-150) in which 3 × 10⁵ cancer cells had been plated in the lower well 1 day earlier. The cells were cultured in the adipocyte differentiation media (as described previously) and designated media for each cancer cell line (1:1 ratio). For PANC-1, cells were incubated with or without the addition of 1 mM uridine. After 3 days, cancer cells were collected for imaging, cell viability assay or seahorse assay. RNA was collected, cDNA was prepared and RT–qPCR was carried out as previously described. Differential expression was determined using the ΔΔCt method with GAPDH primers as control (primer sequences in Supplementary Table 3).
Luminescent cell viability
MCF-7 cells were grown as mentioned above and treated for 3 days with either CRISPRa-UCP1-AAV adipocytes or dCas9–VP64 as a negative control; 6-aminonicotinamide (Sigma-Aldrich, A68203) at 50 µM or 100 µM with DMSO as negative control; and etomoxir (Sigma-Aldrich, E1905) at 100 µM or 200 μM with DMSO as a negative control. The luminescent cell viability assay was performed using the CellTiter-Glo Luminescent Cell Viability Assay (Promega, G7570) following the manufacturer’s protocol on four biological replicates per condition.
Human and mouse adipose organoid culture
Human or mouse 3T3-L1 preadipocytes (0.5 × 10⁶ cells) were plated in 96-well Nunclon Sphera ULA U-bottom plates (Thermo Fisher, 174929). Organoids formed after 48 h and were then differentiated into adipose organoids using a differentiation cocktail containing IBMX (0.5 M), dexamethasone (1 µM) and insulin (10 µg ml−1). Adipocytes formed 21 days post differentiation. Human adipose organoids were then transduced with gRNA AAV (1 × 10⁶ MOI) and dCas9–VP64 AAV (1 × 10⁶ MOI). After 5 days, organoids were collected and mixed with Matrigel (Corning, 354234) and subcutaneously injected into mice (ten organoids per mouse).
Co-transplantation of CRISPRa-modulated human adipose organoids and cancer cells
All animal studies were carried out in accordance with the University of California San Francisco (UCSF) Institutional Animal Care and Use Committee, protocol number AN197608. Mice were housed in a 12 h:12 h light-to-dark cycle; chow diet (Envigo, 2018S) and water were provided ad libitum. Immune-deficient SCID mice (5 weeks old; JAX, 001303) were anesthetized using isoflurane and subcutaneously injected with 2 × 10⁶–6 × 10⁶ cancer cells, or ~2 × 10⁶ cells after trypsinization of tumor organoids and mixed 1:1 with Matrigel, in PBS. After 6–12 weeks, depending on the cancer cell lines, the mice were subcutaneously injected with CRISPRa-AAV human adipocytes or adipose organoids to a site adjacent to the tumor. After 3–6 weeks, mice were killed and tumors and adipose implants were collected. Tumor size was measured with calipers and tumor volume was determined according to the standard formula (length × width2 × 0.52).
Immunofluorescence
A portion of the isolated tumors was fixed with 1% paraformaldehyde for 2 h and prepared for cryostat sectioning. Each sample was cut into 5 µm-thick sections and blocked with 3% BSA (Miltenyi Biotec, 130-091-376) blocking solution for 30 min. For Ki67 staining, slides were permeabilized with 1% Triton X-100 PBS solution for 15 min and washed with 0.1% Tween 20 PBS solution before blocking. Slides were then incubated with primary antibodies (information and concentrations are listed in Supplementary Table 4) overnight at 4 °C and washed three times with 0.1% Tween20 PBS. The slides were then incubated with secondary antibodies (information and concentrations are listed in Supplementary Table 4) for 60 min at room temperature and then washed three times with 0.1% Tween 20 PBS. Images were obtained using a confocal microscope (Zeiss, LSM880) and analyzed with Fiji130.
Whole-mount staining
Adipose organoids collected after implantation were fixed with 2% paraformaldehyde overnight and then stained with LipidTox Red (Thermo Fisher, H34476) (1:1,000) for 2 h. Images were acquired using a confocal microscope (Zeiss, LSM880).
Metabolic and thermogenic measurements
Oxymax–CLAMS (Columbus Instruments) was used to measure oxygen consumption and carbon dioxide production of individual mice. Mice were housed individually at 30 °C, 16 °C and 4 °C under a 12 h:12 h light-to-dark cycle. Food and water were available ad libitum. We calculated the respiratory exchange ratio by dividing the volume of CO2 produced by the volume of O2 consumed.
RNA-seq analysis
Total RNA was isolated from tumors using the RNeasy Plus kit (Qiagen, 74136). Sequencing libraries were prepared using TruSeq Stranded Total RNA Library Prep Kit (Illumina) and sequenced by Novogene using Illumina NovaSeq 6000. Using Partek Flow (Illumina), reads were trimmed and aligned to the human genome (hg38) using STAR131. Differentially expressed genes were annotated using Limma-voom132 and were defined as those that were induced at least ±fourfold, and their expression was significantly different from the basal (5% false discovery rate-adjusted P < 0.01). We used Geneontology.org (https://geneontology.org/)62,63 to determine gene ontology enrichment using biological processes annotations with Fisher’s Exact test and a 5% false discovery rate-adjusted P value of <0.0001. RNA-seq data are available under GEO accession number GSE246231 (ref. 133).
CRISPRa-modulated mouse adipose organoid implantation in genetic mouse models
KPC, a tamoxifen-inducible KrasLSL-G12D; p53LoxP; Pdx1-creER triple-mutant model of tamoxifen-inducible PDA on a C57/BL6 background, was acquired from the Jackson Laboratory (strain no. 032429). To induce Cre recombination, tamoxifen was administered to pups through lactation following oral gavage of the mother with 6 mg tamoxifen (suspended in corn oil) on postnatal days 0, 1, 2 and 4. We orthotopically implanted mouse adipose organoids (ten organoids per mouse) mixed with Matrigel (Corning, 354234) near the pancreas in 4-week-old mice, using a method similar to a previously published protocol134, and dissected the pancreas 6 weeks after the implantation. The MMTV-PyMT breast cancer mice were acquired from the Jackson Laboratory (strain no. 002374). Female mice were implanted with mouse adipose organoids at 4 weeks of age (ten organoids per mouse) mixed with Matrigel (Corning, 354234) and subcutaneously injected into mice either at the third nipple or on the back. The tumors were collected 6 weeks post implantation.
Cancer organoids
Organoids were generated from breast tumor tissue or tumors from malignant effusions. Patients provided their consent for specimen collection using IRB-approved tissue collection protocols at the UCSF and the Brigham and Women’s Hospital. Surgical specimens were obtained from the UCSF Medical Center or Brigham and Women’s Hospital on the day of their procedure, viably frozen as tissue pieces or used to generate formalin-fixed, paraffin-embedded sections or organoid cultures. Each tissue was minced using razor blades and digested in a solution containing DMEM/F12 (Gibco, 11330), 2 mM GlutaMAX (Gibco, 35050), 10 mM HEPES (Gibco, 15630), 50 U ml−1 penicillin–streptomycin (Gibco, 15070) and 1 mg ml−1 collagenase XI (Sigma-Aldrich, C9407). Tissue digestion was performed at 37 °C with constant shaking at 150 rpm for 1–2 h. Cells were then pelleted by centrifugation, further dissociated by sequentially pipetting with 10 ml, 5 ml and 1 ml pipette tips and then recentrifuged. The resulting cell pellet was used directly to establish organoid cultures by embedding in basement membrane extract, allowing this to harden at 37 °C for 20 min to form a hydrogel dome and then overlaying this dome with Type 1 Organoid Medium as previously described69,135. All metastatic cancer organoids were derived from malignant pleural effusions that were collected from patients with metastatic breast cancer who were undergoing thoracentesis at the UCSF Medical Center. The fluid samples were placed on ice within 4 h after collection. Organoids were generated by washing malignant effusions with PBS, collecting tumor spheroids by centrifugation and incubating with 3–5 ml RBC lysis buffer (BioLegend, 420301) for 10–15 min when there were visible RBCs, followed by embedding the cell pellet in organoid culture as described above.
Metabolomics
The tumors were collected and subjected to metabolomics analysis to measure primary metabolites by the University of California Davis West Coast Metabolomics Center. The data were normalized to tumor mass (Supplementary Table 1).
Mammary gland adipocyte isolation
For adipocyte extraction, mammary gland adipose tissues from excess tissue removed during breast surgeries were washed with PBS three times and mechanically minced into smaller pieces. The tissue mixture was incubated with PBS with 3% BSA and collagenase I (1 mg ml−1) for 45 min at 37 °C and then centrifuged; the top lipid layer was then discarded. The remaining mixture was filtered twice through a 200 µm strainer and centrifuged. Mature adipocytes were isolated and washed twice with PBS and then plated in suspension in six-well plates in high-glucose DMEM media supplemented with 10% FBS. For transduction of CRISPRa, UCP1 AAV9 (1 × 10⁶ MOI) and dCas9–VP64 AAV9 (1 × 10⁶ MOI) were mixed with 20 µl of AdeoMag (OZ Biosciences, AM71000) and adipocytes and incubated for 15 min. The virus and cell mixture was distributed onto a six-well plate placed upon the magnetic plate and incubated for 15 more minutes.
Co-culturing of cancer organoids and adipocytes
At 5 days post infection of CRISPRa AAV9, adipocytes were placed in a tissue Transwell culture plate (Corning, 07-200-150) of tumor organoids at a 1:1 ratio of adipocyte media and breast cancer organoid media. Cells were incubated for up to 7 days and then examined for adipocyte and tumor phenotypes.
Co-implantation of cancer organoids and adipocytes
Immune-deficient SCID mice (5 weeks old; JAX, 001303) were anesthetized using isoflurane and subcutaneously injected with 3 × 10⁵ cancer organoids mixed 1:1 with Matrigel in PBS. After 3 weeks, we subcutaneously injected CRISPRa-AAV mammary adipocytes mixed with Matrigel to a site adjacent to the tumor. After another 3 weeks, tumors and adipose implants were dissected. We measured tumor size with calipers and determined tumor volume according to the standard formula (length × width2 × 0.52).
Tet-On CRISPRa
The rtTA was amplified from pSBtet-GP (Addgene, 60495) along with a sequence encoding for T2A and cloned downstream of the CMV promoter in the gRNA-AAV vector digested with NheI and AgeI. The TRE and a minimal promoter were amplified and cloned upstream of dCas9–VP64 in the dCas9–VP64 AAV vector digested with XhoI and AgeI. After adipose organoids were infected with Tet-On UCP1-CRISPRa and implanted, mice were fed with a doxycycline diet (Bio-Serv, S3888).
PCL microwell scaffold fabrication
Microwell scaffolds were fabricated using a combination of microfabrication techniques, including photolithography and micromolding. We used PCL (Sigma-Aldrich, 440744), a biocompatible polymer to fabricate microwell scaffolds. We used a polymer blend of 150 mg ml−1 PCL (molecular weight, 80K; Sigma-Aldrich, 9016-00-6) and polyethylene glycol (molecular weight, 2.5K; Sigma-Aldrich, 438197) in trifluoroethanol (Sigma-Aldrich, 8.08259). The polymer solution was stirred on the roller bank overnight at room temperature. We then used photolithography to fabricate the SU8 (Microchem/Kayaku, Y111075) microwell array master mold. The microwell mold was then silanized and polydimethylsiloxane (PDMS) (Thermo Fisher, 178442500) and was used to prepare the microwell template. The PDMS template had a micropatterned spatially organized array of dome-like structures called microwells, each 700 μm in height and 500 μm diameter. Micromolding was used to prepare the PCL microwell scaffold using a PDMS microwell template. Two-step spin casting was used to cast the PCL solution on the PDMS microwell template at 100 rpm and 1,000 rpm for 10 s to regulate the height of the microwell; the microwell diameter was defined by the microwells on the template. The PCL-coated template was allowed to dry at room temperature overnight to evaporate the organic solvent, followed by immersion in deionized water. The polyethylene glycol in the PCL polymer blend was allowed to leach out in a deionized water bath for 5 days to introduce the porosity in the microwell PCL scaffold. Subsequently, the microwell scaffolds were washed and stored in deionized water till further use. The size of the microwells on the PCL microwell scaffold was designed to be suitable to host adipose organoids.
Adipose organoids microwell scaffold transplantation
The microwell scaffold organoid delivery platform was primed for the transplantation of adipose organoids. The microwell scaffolds were thoroughly washed and dried followed by treatment with air plasma for 3 min in aseptic conditions. We then soaked the scaffolds in a solution of adipocyte differentiation media and Matrigel (Corning, 354234) at 4 °C for 24 h. The adipose organoids were then spin-loaded individually in each microwell at 1,000 rpm and 4 °C. The microwell scaffolds loaded with adipose organoids were then layered with a 1:1 ratio of adipocyte differentiation media and Matrigel. The scaffold-organoids system was then cultured at 37 °C at 5% CO2 for 24 h. The immunodeficient SCID mice (JAX, 001303) were antecedently prepped with orthotopic MCF-7 tumor. The adipose organoids-loaded microwell organoid delivery scaffolds were then transplanted into the mice adjacent to the orthotopic tumor. After 3 weeks, tumors and microwell scaffold adipose organoid implants were collected. The tumor size was measured with calipers and tumor volume was determined according to the standard formula (length × width2 × 0.52).
Scanning electron microscopy
Adipose organoids on the microwell scaffolds were meticulously prepared for analysis and visualization of their ultrastructural characteristics using SEM. The organoids on the scaffolds were fixed by immersing them in a 2.5% glutaraldehyde (Electron Microscopic Sciences, 16210) solution in a 0.1 M sodium cacodylate (Sigma-Aldrich, C0250) buffer with a pH of 7.2 at 4 °C over 24 h. Subsequently, samples were thoroughly rinsed for 30 min with 0.1 M sodium cacodylate buffer with a pH of 7.4 to remove residual fixative. To enhance structural contrast, post-fixation was performed using a 2% phosphotungstic acid (Sigma-Aldrich, P4006) in 0.1 M sodium cacodylate buffer at 4 °C for 1 h followed by thoroughly rinsing for 30 min with 0.1 M sodium cacodylate buffer with a pH of 7.4. The samples were then dehydrated by immersing for 20 min each in a graded series of ethanol (35%, 50%, 70%, 95%, 100%) solutions, enabling the gradual removal of water content. Critical-point drying over 24 h using hexamethyldisilazane (Sigma-Aldrich, 440191) ensured the complete removal of moisture from the specimens without causing any damage. Finally, a thin iridium coating of ~2 nm thickness was sputter-coated on the samples to enhance conductivity during SEM imaging. This systematic sample preparation method facilitated high-resolution SEM imaging at 1 kV on Phenom Pharos G2 Desktop FEG-SEM (Thermo Fisher Scientific), enabling a comprehensive exploration of the ultrastructural morphology.
Uridine and uridine triphosphate (UTP) uptake studies
Adipocytes differentiated and treated with or without UPP1-CRISPRa were maintained in a 24-well plate using cell culture medium (see ‘Cell culture media’ section). Before the uptake experiments, the culture medium was discarded and the cells were incubated in 1.0 ml of Hanks’ balanced salt solution (HBSS; Gibco, 14025092) for 10–20 min at 37 °C. After this pre-incubation, trace amounts of either 3H-uridine (128 nM) or 3H-UTP (240 nM) were introduced to the cells and incubation continued for 1 h or 12 h. Subsequently, the cells were washed twice with ice-cold HBSS. After washing, the cells were lysed using a lysis buffer composed of 0.1 N NaOH and 0.1% SDS. The radioactivity in the lysate was then quantified through liquid scintillation counting.
Statistical analysis
Statistical analyses were performed using one-way ANOVA or two-tailed t-tests and are described in each figure legend. A P value of <0.05 was considered statistically significant. The number of mice or replicates used in each experiment are indicated in the figure legends.
Reporting summary
Further information on research design is available in the Nature Portfolio Reporting Summary linked to this article.
Responses