Improved radicchio seedling growth under CsPbI3 perovskite rooftop in a laboratory-scale greenhouse for Agrivoltaics application
Introduction
Agrivoltaics, by merging agriculture and renewable energy production, aims at efficient and sustainable farming activities in a self-consumption electrical scheme1,2. Traditional opaque photovoltaic (PV) silicon solar cells (SSC), with a record laboratory-scale efficiency of 26.88%3 are currently used in open-field farms and greenhouses, providing plants with reduced temperature and protection from harsh weather. However, opaque SSC can hinder plant growth due to shading effects4,5,6. To address the problem of soil shadowing, semitransparent (ST) PV modules are required7. ST PV technologies, such as organic (OSC), dye-sensitized (DSSC), and perovskite solar cells (PSC), offer semi-transparency and additional flexibility for coverages on bent surfaces. Among those possible choices, PSC offers versatility to regulate solar light transmittance. PSC are also competitive in terms of efficiency and fabrication costs8,9. As a matter of fact, PSC reached a current record efficiency of 26.7%, comparable to SSC while surpassing OSC (18.2%) and DSSC (13%)10. The estimated cost for a PSC is in the range of 0.22–0.25$Wp−1 11, whilst OSC and DSSC cost is 0.23–0.34$Wp−1 and 0.5–0.94$Wp−1, respectively12.
However, PSC technology still faces significant challenges, particularly concerning long-term stability, scalability, and environmental impact. PSCs are prone to degradation over time due to the sensitivity of perovskite materials to moisture13, heat, light exposure, and due to weakness points at the interfaces with the charge transporting layers14. Additionally, the presence of lead in perovskite composition raises environmental concerns15. Efforts to address these issues have been developed including encapsulating materials to protect PSCs from environmental agents and to capture leaked lead eventually; while enhancing performance and materials stability is done through compositional and interface engineering16,17.
In the literature, OSC and DSSC have been successfully applied in greenhouses for tomato18,19,20,21 and lettuce growth22, enabling photo-conversion efficiency of 3–5%. Recent experiments have also highlighted the feasibility and the high potential of some kind of stable and efficient ST-PSC architectures for Agrivoltaics8,23. However, these studies lack information regarding how the integration of PSC impacts plant growth and its transcriptomics. Plants have different photoreceptors, and it is well known that light absorption by them typically triggers signal transduction pathways that alter gene expression and photomorphogenesis24,25. A core set of genes that responds to high light levels has been identified in plants, and these genes affect hormones, photosynthesis, and the phenylpropanoid pathway26. In the model plant ARABIDOPSIS, a genome-wide gene expression analysis identified 77 light-responsive genes dependent on photoreceptor cryptochrome 1 (CRY1) and 25 on a basic leucine zipper (bZIP) transcription factor (HY5). Moreover, in cry1 and hy5 deletion mutants, the regulation of early light-inducible proteins Elip1 and Elip2 was disrupted, with their induction being mediated by CRY1 depending on blue light intensity27. The effects of other PV technologies on plant physiology and growth have been recently reported. It has been reported that smart glass films block approximately 9% of PAR in plants and more than half of the entire short-wave radiation28. This effect leads to impaired plant growth characterized by disrupted ion fluxes, increased leaf water loss, heightened sensitivity to the abscisic acid (ABA) stress hormone, and reduced stomatal pore sizes, impairing photosynthesis rates and overall plant growth28. On the other hand, it has been reported that shading, which might occurr under opaque PV panels, may induce the Shade Avoidance Syndrome (SAS) in plants, leading to morphological adaptations such as increased leaf area and altered chlorophyll content29. Metabolite profiles in plants can also change under shading, with polyphenol and carotenoid content variations. Shaded chicory plants (Cichorium intybus seedlings of cultivar “Otrantina”) showed higher chicoric acid levels and lower chlorogenic acid levels compared to those grown under full sunlight30. On the other hand, reduced UV radiation has been shown to lower polyphenol content, while increased red light can enhance sucrose and hexose accumulation in Lactuca sativa and C. intybus31.
In this paper, we investigate through a multidisciplinary approach the viability and the agronomic implications of growing radicchio seedlings, starting from their germinated seeds, in a laboratory-scale greenhouse under ST-perovskite-coated rooftop. Radicchio is a member of the chicory family renowned for its distinct bitter flavor and nutritional richness32,33,34. It is rich in molecules with high nutritional values such as anthocyanins, it is appreciated in international markets, and, thanks to its limited size, it is easy to grow in pots35,36. Radicchio can be cultivated both in open-field or greenhouses37 depending on the specific preferences of the growers and the season. The germinated radicchio seeds are typically sowed in little buckets within greenhouses and exposed to the sun until the seedlings have enough grown38. In the usual agronomic procedures, the seedlings are subsequently transplanted into the soil of the greenhouse or in open field for the complete maturation of the plants39. Our investigation focuses on the initial stage of this process in laboratory-scale greenhouses, examining various replicates of seed germination and seedling growth under perovskite-filtered light for 15 days under a 12 LEDs tower acting as a solar simulator, compared to bare glass filtered light. The perovskite material used for the experiment is a fully inorganic perovskite, with composition CsPbI3, which has demonstrated superior thermal stability compared to hybrid perovskites due to the lack of volatile components40 and relatively high photo-conversion efficiency (record of 21.15%41 achieved with bandgap values in the range 704–716 nm). These values allow a suitable tradeoff between light absorption (i.e., PSC photovoltaic efficiency) and transmittance for assuring semi-transparency to PSC devices. In comparison, narrower bandgap perovskites like FAPbI3 (861 nm) and MAPbI3 (775 nm), while achieving high-efficiency record10,42,43, exhibit lower transparency in the visible range. Conversely, wider bandgap perovskites like CsPbIBr2 (610 nm) offer higher transparency in the visible range but with a lower record efficiency44. In particular, we used Eu-enriched CsPbI3 formulations45,46 for the coverage of the laboratory rooftop, since it has been shown that the Eu improves quality and stability of the material by mitigating the formation of intrinsic defects and by increasing the surface-to-volume ratio of perovskite grains9,47. The effect of the perovskite-filtered light on radicchio seedlings was complementary assessed by RNA-sequencing analyses, shedding light on how metabolic and transcriptomics parameters of the seedlings are modified, entailing adaptive responses to environmental variations. Furthermore, simulations of PSC power production over time corroborated a positive balance between annual energy production and consumption in a large class of greenhouses by applying rooftops PSC integrating Eu-enriched CsPbI3 for future technological scale-up.
Results
Structural and optical characterization of the perovskite film used as greenhouse rooftop
Light filtering by ST-PSC is expected to play a role in crop growth48,49. This is because the portion of the light spectrum called Photosynthetically Active Radiation (PAR)50 laying in the range 400–700 nm49 is used for photosynthesis. One approach to tailor PSC semi-transparency is reducing the thickness of the photoactive layer17,51. Hence, we have fabricated semitransparent CsPbI3:EuI2 perovskite layers by scaling down the thickness to 130 nm as measured by spectroscopic ellipsometry, through optimization of the spin-coating deposition parameters and perovskite precursor solution concentration. This thickness allows for a positive balance between transmittance (Average Transmittance 20–34%)52 in the visible range and device power conversion efficiency (8–12%)52. In Supplementary Fig. 1, the best trade-off between efficiency and PAR average transmittance is shown. The perovskite-covered glasses were applied as schematically depicted in Fig. 1a to realize the greenhouse rooftops, that filter the incident light from the simulated sun before reaching the seedlings. We preliminary investigated the structural and optical characteristics of the perovskite layer to frame its behavior in the interaction with the incoming light.

a Conceptual scheme of the experiment. b XRD pattern of CsPbI3:EuI2 perovskite layer. c Absorption coefficient (red) and transmittance (blue) spectra of the CsPbI3:EuI2 perovskite layer (see photograph in the inset) within the range 300–1100 nm. d Representative photoluminescence measurements of CsPbI3:EuI2 perovskite layer over 360 h (15 days). Source data are provided as a Source Data file.
The X-Ray diffraction (XRD) pattern in Fig. 1b shows prominent peaks at 2θ = 14.4°; 2θ = 20.6°; 2θ = 28.9°; 2θ = 36°, well featuring the orthorhombic γ -phase structure ascribed to the CsPbI3 perovskite53. The narrow and well-defined perovskite peaks and the lack of contributions from the non-photoactive orthorhombic δ-phase (diagnostic peak expected at 2θ = 9.8°) prove the purity and the high crystalline quality of the fabricated perovskite layer54,55,56. The lattice parameters, obtained through a standard Rietveld refinement procedure, are presented in Supplementary Table 1. Eu-addition is used as a strategy to assure long-term stability to the perovskite layer47. Figure 1c shows the absorption coefficient (α) and the transmittance of the 130-nm-thick CsPbI3:EuI2 layer measured by spectroscopic ellipsometry from which a bandgap of 705 nm (1.76 eV) has been measured57. The slight shift in the bandgap value compared to pure CsPbI3 (1.71–1.73 eV) is attributed to the incorporation of the EuI2 additive, which reduces the crystallite size from 89 nm to 58 nm9,56,58. Small perovskite crystallites are expected with a wider bandgap compared to large ones due to quantum confinement and size-dependent structural effects, as reported in ref. 59. It is worth noting that the average transmittance of the layer is still 70–80% in the region below the bandgap (far-red/infrared) while it is 32% in the visible range (AVT), which allows light to pass through for the benefit of the seedlings placed underneath. The absorption and transmittance profile would thus enable the CsPbI3:EuI2 to achieve high efficiency, together with a further prospected benefit for the growth of the seedlings60. We then investigated the stability of the perovskite layer in N2 environment at room temperature by monitoring the characteristic photoluminescence (PL) peak of CsPbI3:EuI2 at 699 nm over the timeline of the experiment (15 days). Figure 1d shows that the average PL intensity remains constant, thus assuring stable filtering conditions towards the seedlings58,61,62,63. In addition, Supplementary Fig. 2 compares scanning electron microscopy images and X-ray diffraction patterns (extracted lattice parameters in Supplementary Table 1) at t0 and after 15 days, further highlighting the stability of the perovskite layer over the experiment period. Finally, to prove the thermal stability of the CsPbI3:EuI2 layers, we performed accelerated thermal stress tests. The optical behavior was also monitored over time via in-situ isothermal spectroscopic ellipsometry measurements, tracking the evolution of α in a dry N2 atmosphere. Supplementary Fig. 3 shows α with negligible changes after 225 min at 90 °C or 150 min at 100 °C.
Growth of radicchio under perovskite greenhouse rooftop
The 130-nm thick CsPbI3:EuI2 perovskite layers were thus applied on the rooftop of the laboratory-scale greenhouse. This rooftop consists of four perovskite-covered glass panels arranged side by side, 2.5 × 2.5 cm2 each. In a twin system to be used as a reference, a pure glass rooftop made of four bare glass panels is applied. Glass substrates were used as reference since they represent the support of the perovskite films. Furthermore, bare glass covers closely simulate the greenhouse rooftop. On the other hand, leaving the seedling in an open field would change the local ambient conditions and risk altering the comparison. The experiment aims to evaluate the growth of radicchio seedlings, starting from germinated seeds, within the laboratory-scale greenhouse under the perovskite rooftop (P sample), in comparison with the growth of similar seedlings under the bare glass rooftop (G sample). Both groups undergo light/dark cycles with 16/8 h for 15 days to mimic real-life sunlight conditions, and 3 replicates were repeated for each Magenta™ box (Fig. 2a, b).

Schematic view (a) and photos (b) of the experimental setup consisting of a laboratory-scale greenhouse with the ST-PSC-coated and glass bare rooftop where radicchio seedlings are cultivated under illumination (16h/8h light/dark cycle) from a 12-LEDs source. c Irradiance spectra of 12-LEDs source light passing through the glass (black) and perovskite (red) greenhouse rooftop. Source data are provided as a Source Data file.
To preserve the photoactive phase, the CsPbI3:EuI2 rooftop is locally kept under a dynamic N2 flow to prevent any degradation due to humidity exposure58. The entire experiment is performed indoors at a constant ambient temperature of 24 °C and 40% RH. Radicchio seeds were preliminarily subjected to a pre-germination process for three days under dark conditions. Following this period, the best-germinated seeds were gently buried in organic soil made of 70% peat and 30% sterile sand, which was placed inside Magenta boxes with internal white walls simulating the greenhouse environment with multiple light reflections. Air circulation was assured through small lateral hollows. The organic soil was seeded at a density of 2 seeds/cm2 to a depth of 1 cm, resulting in a total of 4 seeds sown within each box. We replicated the experiment 5 times. We used 10 Magenta boxes (5 G-sample, 5 P-sample) each containing 4 seedlings. This seeding density was chosen to ensure adequate spacing for subsequent growth while maximizing the box space. Throughout the 15 days, a total volume of 100 ml of water was provided to the seedlings. Detailed chemical and physical properties of the water utilized are provided in Supplementary Table 2. The germinated seeds are thus separately illuminated over the perovskite and reference glass-covered boxes, by 12-LEDs tower, which acts as solar simulator. The white walls of the box facilitate the mixing and uniform distribution of the light components. For the G sample, the LED tower directly illuminates the seedlings under the glass rooftop, while for the P samples the light is partially filtered by the photoactive perovskite layer before reaching the seedlings. This difference is evident through the varied color of the filtered light: reddish for the perovskite rooftop and white for the glass rooftop (Fig. 2b). The overall LEDs power is preliminary calibrated through a spectrometer placed under the glass rooftop to replicate the Air Mass (AM) 1.5G spectral output of the sun according to the International Standard IEC 60904-9 Class A (Supplementary Fig. 4 for detailed calibration values). The total irradiance of the LED tower is adjusted to mimic real-world solar conditions at the soil level following NREL data specific for Treviso (Italy), a city renowned for radicchio cultivation64,65. Specifically, the day/night cycle is simulated by providing 16 hours of irradiation at 190 Wm−2, followed by 8 hours of darkness66,67, resulting in a cumulative daily irradiance of 3040 Whm−2, which effectively mirrors the average natural light conditions in Treviso (mean annual solar radiation at a tilt angle of 0° being 3000 Whm−2day−1)65. Figure 2c depicts irradiance spectra of light passing through the glass and perovskite layer, which thus reaches the radicchio seedlings in the two cases. In the wavelength range below the bandgap 700–1100 nm, the perovskite rooftop largely allows incident light to pass through due to its low absorption capability (far-red to infrared). In particular, the integrated irradiance value in the range 700–1100 nm is 59 Wm−2 under the perovskite compared to 87.4 Wm−2 under the glass, with the perovskite layer enabling 67.5% irradiance passing through it. On the contrary, as expected, the perovskite rooftop shows a reduction of the irradiance in the PAR range (400–700 nm) with an integrated irradiance value of 31.5 Wm−2 under the perovskite and 96.7 Wm−2 under the glass (32.6% of transmitted light). In the UV range between 360 and 400 nm, perovskite exhibits high absorption, allowing only 15.8% of the incident light to pass through, in contrast to the glass rooftop (0.6 Wm−2 vs. 3.8 Wm−2). Partial absorption by perovskite layer thus alters the overall spectral composition of the transmitted light (Fig. 2c) and, accordingly, the total irradiance decreases to a value of 92 Wm−2 68, with a reduction of 52% with respect to the reference glass rooftop (190 Wm−2). This irradiance decrease frames the CsPbI3:EuI2 layer69 behavior in interacting with the solar light. Both spectra exhibit identical irradiance intensities at the beginning and the end of the experiment (after 15 days) (Supplementary Fig. 5.). The internal greenhouse temperature under irradiation is stable at 26 °C in both kinds of setups. This illumination protocol ensures that the seedlings are exposed to light conditions that mimic real-world scenarios.
Figure 3a depicts the growth evolution of radicchio seedlings under perovskite and glass rooftops at t0 (i.e., at the beginning of measurements) in the form of germinated seeds and after 7 (Fig. 3b) and 15 (Fig. 3c) days under 16h/8h light/dark cycles. After 7 days, all germinated seeds under both glass and perovskite rooftop have grown to seedlings with two small leaves each. At day 15, all radicchio seedlings under the glass rooftop display two leaves per stem, whereas those under the perovskite rooftop show flourishing growth with 3–4 larger leaves. The measured average increase for each leaf area is 25% (Supplementary Fig. 6) per stem. The stem lengths are comparable between the two samples (2 ± 0.2 cm). All three replicates of the experiment consistently provided similar results, thus further corroborating our findings. Figure 3d shows a schematic of the experiment. The biomass of the seedlings was measured and Fig. 3e shows greater biomass production both fresh and dry for the seedlings grown under perovskite (Supplementary Movie 1) in all replicates. In the literature70,71, it was reported that plant productivity generally increases with higher daily light integral of PAR. This is not our case, because the daily light integral received by radicchio seedlings under the perovskite rooftop is even notably lower than that under the glass rooftop (Fig. 2b). This finding shifts the focus to the influence of the light spectral composition on plant morphology and adaptive responses, better known as photomorphogenesis72. The main differences between the light filtered by the perovskite rooftop compared to the glass rooftop are 1) the small amount of UV component and 2) the different spectrum in the PAR range. For the first, it was reported in the literature that plant UV-B responses generally aim at protecting sensitive tissues from UV-B penetration and repairing UV-B induced damage. UV-B protection is mainly achieved by epidermal accumulation of UV-absorbing flavonoids and hydroxycinnamic acids73. In particular, UV-B radiation can also reduce plant height and leaf area in different plant species due to its influence on growth regulators and signaling pathways74. On the other hand, the study by Laurenvcikova et al.31 demonstrated that UV radiation, particularly UV-B, might influence the accumulation of secondary metabolites in lettuce and radicchio plants. We investigated the UV influence on early-stage radicchio seedling growth with a focused experiment, in which the UV LEDs are turned off compared with the reference case with the UV LEDs left on. The results show no difference between the two conditions in terms of leaf surface area and seedling weight, indicating that the absorption of the UV by perovskite rooftop has a minimal effect on the observed increased leaf surface area and on the higher number of leaves (Supplementary Fig. 7). This finding moves the focus to the PAR range of light. Blue and red/far-red light, in particular, affect plant development, influencing properties such as leaf area, stem length, and flowering according to Ref. 49. Mixtures of red (R) and blue (B) light generally result in higher biomass and photosynthetic rates compared to monochromatic light64,75. In particular, a spectrum deficient in blue light and abundant in red light may stimulate the growth of larger leaves by promoting cellular expansion66. The optimal R/B ratio is different among species: for example, it has been reported in literature that in lettuce the shoot dry weight increases with increasing R/B ratio, reaching a maximum at R/B= 12, with the increase primarily ascribed to larger leaf area and a greater number of leaves76. In addition, the red/far-red ratio is reported to regulate plant development through shade-avoidance responses, impacting extension growth77. On this basis, we disclose that the enhanced growth of radicchio seedling leaves benefits from the filtering action by the CsPbI3:EuI2 perovskite rooftop in the PAR range compared to the full light passing through the glass rooftop, with the promotion of favorable photomorphogenic responses. Despite the lower daily light integral, we thus conclude that the deficiency in blue light, the relative abundance in red light, and the lower red/far-red intensity ratio in the filtered spectrum (Fig. 2c) positively contribute to the observed flourishing growth in the greenhouse environment. These findings entail that integrating Cs-based perovskite rooftops can increase radicchio plant productivity, through enhanced photosynthesis and biomass production, which are essential for crop yield and overall agricultural output.

a Photo of radicchio seedlings at t0 (germinated seeds). b After 7 days of 16h/8h light/dark cycles under perovskite and glass rooftops. c After 15 days of 16h/8h light/dark cycles under perovskite and glass rooftops. d Schematics of experimental setups. e Weight of the seedlings grown under glass (black) and perovskite (red) rooftop at time t0 (seeds germinated) and after 15 days freshly measured and after drying. We utilized 12 seedlings samples for each experiment phase, resulting in a total of n = 72 seedlings. Data are presented as box plots (center line at the median, upper bound at 75th percentile, lower bound at 25th percentile) with whiskers at minimum and maximum values. Mean value is represented as a square. Source data are provided as a Source Data file.
RNA-sequencing of the seedlings grown under perovskite rooftop
To investigate the transcriptomic differences between the radicchio plant’s growth under glass and perovskite rooftop, we performed RNA-sequencing on the two kinds of samples. Sequencing of radicchio RNA samples produced an average of 31,057,247 reads per sample (ranging from 23,321,414 to 36,829,272) (Supplementary Data 1). Reads aligned to the reference genome resulted in an average mapping rate of 71.20% (ranging from 65% to 81% Supplementary Data 1). Normalized read counts are reported in Supplementary Data 2. Multidimensional analysis (Principal component analysis, PCA) on read count data showed no distinct clusters and a large variability across all samples (Supplementary Fig. 8), as also highlighted by the heatmap depicting the transcript abundance in the different samples, which showed a similar transcriptomic response of both samples, grown under glass and perovskites (Fig. 4).
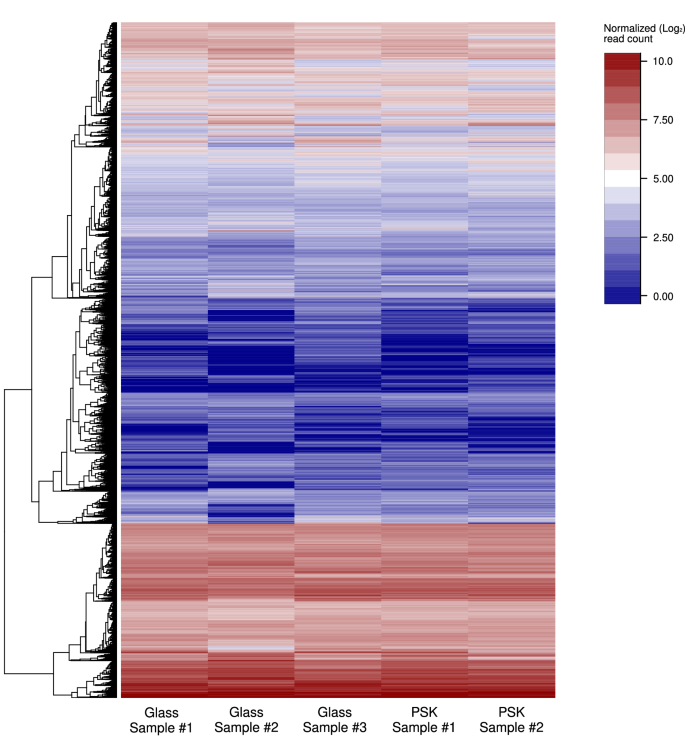
Heatmap depicting read count (Log2 transformed) in the five RNA samples. Hierarchical clustering of transcripts was performed using the McQuitty algorithm. The heatmap shows the transcript abundance across the five samples, with red levels indicating a high number of reads assigned to the specific genes and blue representing a low number. Source data are provided as a Source Data file. In the x-axis label PSK=perovskite.
Using G samples as a reference and a cut-off of the p-adjusted value ≤ 0.05 to classify a gene as differentially expressed (DEG) in comparison with the control, 22 genes were found to be differentially regulated. Among them, 9 were identified as up-regulated and 11 as down-regulated in P samples compared to G samples (Supplementary Data 3).
Among the 9 up-regulated DEGs, a RAS-related protein78 RAB-B1c related gene (Log2FC= 5.30) was found to be the most up-regulated in P samples. In ARABIDOPSIS, a model organism for understanding gene expression in plants, the gene RAB-B1c79 is known to be influenced by light conditions, having been reported to be downregulated in the dark when compared to light conditions80. Other up-regulated genes include a gene putatively coding for a tropinone reductase homolog At5g06060-like (Log2FC = 4.23), involved in alkaloid metabolism, a gene coding for a senescence-specific cysteine protease SAG39-like (Log2FC= 3.58), a gene coding for a NAC domain-containing protein (Log2FC = 1.65), and a gene coding for a universal stress protein A-like protein (Log2FC=1.05), all putatively involved in different metabolic pathways, including plant response to environmental stress. It is worth noting that SAG39 has been reported to negatively regulate leaf senescence, delaying this process, mainly by regulating the stability of Chl-protein complexes81. The up-regulation of the gene coding for a BRI1 kinase inhibitor 1-like (Log2FC = 1.43) suggested a regulatory constraint on the brassinosteroid pathway, which is essential to plant growth. In plants, BRI1 is a protein localized to the plasma membrane and its kinase activity has an essential role in brassinosteroids-regulated plant growth and development82. On the other hand, BRI1 kinase inhibitor 1 (BKI1), a membrane-associated protein, is known to be a negative regulator of BRI183. In addition, a gene coding for a plastocyanin B’/B” (Log2FC =1.24) showed up-regulation, suggesting a remodeling of the photosynthetic electron transport chain. Lastly, a gene coding for an aquaporin PIP2-1-like was found to be up-regulated in P samples (Log2FC = 1.11), suggesting an improved transport of water across cell membrane84.
On the other hand, among the 11 down-regulated genes, a gene encoding an early light-induced protein 2, (Log2FC = −2.11), was identified. The regulation of this gene is generally associated with the early stages of light response85. It has been reported that the accumulation of Early Light-Induced Protein 2 (Elip2) is triggered when PSII reaction centers are photodamaged, suggesting that Elip2 plays a role in the plant defense response to light-induced stress86. A down-regulation of this gene may suggest that the plants have adapted to the perovskite-filtered light conditions. Other genes identified as down-regulated were genes coding for a NAC domain-containing protein 17-like (Log2FC: −2.92), an AT-hook motif nuclear-localized protein (Log2FC: −3.06), a berberine bridge enzyme-like (Log2FC: −3.20), a scopoletin glucosyltransferase-like (Log2FC: −3.50), an asparagine synthetase (Log2FC: −3.52), a protein PHOSPHATE-INDUCED (Log2FC: −3.66) a cysteine-rich receptor-like protein kinase 2 (Log2FC: −4.60), a callose synthase (Log2FC: −4.64). Down-regulation of these genes might imply a reduction in these processes, suggesting a role in the adaptation to the growth condition under perovskite. A down-regulation was also observed for a gene encoding an alpha-copaene synthase (Log2FC: −8.78), a key enzyme in the synthesis of terpenoids87, which might suggest that the synthesis of these compounds is affected by the perovskite-filtered light.
Overall, the gene expression differences observed in radicchio seedlings grown under glass and perovskite rooftops indicate adaptive responses of the plants to environmental variations, particularly in response to light conditions and stress factors associated with rooftops.
Photovoltaic production of perovskite greenhouse rooftop
As a first step to evaluate the photovoltaic production of the perovskite rooftop, the 130-nm thick CsPbI3:EuI2 perovskite layer is integrated into a simulated ST-PSC architecture. While the simulations are meant to model a best-case scenario of device, where effects of charge trapping or ionic migration are negligible, the integrated properties of the materials are taken from a realistic case of PSC architecture (e.g. Fig. 1). The structure of the simulated device is depicted in Fig. 5a. It consists of a planar n-i-p architecture on a glass substrate in which the perovskite layer is sandwiched between a 50 nm-thick titanium dioxide (TiO2) film acting as electron transporting layer and a 25-nm-thick Poly[bis(4-phenyl)(2,4,6-trimethylphenyl)amine (PTAA) film acting as hole transporting layer. A 300 nm F-doped tin oxide (FTO) and a 100 nm Indium tin oxide (ITO)88 are chosen as the transparent bottom and top electrodes, respectively. A glass layer is added on the ITO top electrode to consider the cover glass required for PSC encapsulation89. The thickness of the transporting layers and electrodes was set based on values reported in the literature for similar ST-PSCs90. The perovskite optical properties (real and imaginary parts of the refractive index, i.e., n and k) used in the simulations were determined by spectroscopic ellipsometry while those of the other layers are extracted from the literature (Supplementary Fig. 9 and Supplementary Table 3). Figure 5b shows the comparison of the absorbance and transmittance spectrum for the full FTO/TiO2/CsPbI3:EuI2/PTAA/ITO device and only the CsPbI3:EuI2 layer. The full device shows enhanced absorption in the range 350–450 nm due to PTAA absorption and in the range 710–1100 nm due to FTO and ITO absorption, as shown in Supplementary Fig. 10. It is worth highlighting that the transmittance of the entire device is almost identical to that of the isolated perovskite layer within the 300–900 nm range, and this enables us to extend the findings on the seedlings’ growth also to the complete device architecture. This comes from the specific threshold of each material absorption, being the bandgap of the transporting layers and the electrodes in the UV range ( < 400 nm), whereas the perovskite layer is the main one interacting with the incident light in the visible range. The current density-voltage (J-V) curve simulated under 1 sun and AM 1.5G spectrum conditions for the CsPbI3:EuI2 ST-PSC is presented in Fig. 5c, along with the photovoltaic parameters. The device exhibits an open-circuit voltage (VOC) of 1.16 V, a short-circuit current (JSC) of 14.03 mAcm−2, and a Fill Factor (FF) of 77.93%, yielding a power conversion efficiency of 12.67%. This efficiency value aligns well with that of ST-PSCs reported in the literature fabricated using similar perovskite thicknesses but varying perovskite compositions or device architectures90,91 (Supplementary Note 1, Supplementary Fig. 11 and Supplementary Table 4).

a Schematics of the simulated ITO-PTAA-CsPbI3:EuI2-TiO2-FTO device structure. b Transmittance (blue) and absorbance (red) spectra perovskite and device. c JV characteristic of the device. Photovoltaic parameters are also indicated.
After characterizing the CsPbI3:EuI2 ST-PSC, we simulated its real-world application as a perovskite PV greenhouse rooftop located in Treviso (Italy), monitoring the photovoltaic performance for one year. A rendering of the photovoltaic greenhouse with its main source of energy consumption (heating/cooling, illumination, irrigation) is represented in Fig. 6a. Figure 6b illustrates the monthly solar radiation integrated over 280–1150 nm wavelength range incident on the CsPbI3:EuI2 perovskite PV rooftop and transmitted through it. Figure 6c provides an in-depth analysis, displaying the transmitted solar irradiance spectrum under the CsPbI3:EuI2 perovskite PV rooftop over a year with a 2-hour resolution, while Fig. 6d depicts the wavelength-resolved solar radiation obtained by integrating this spectrum over the same period. On the one hand, the spectral and integrated data of the light transmitted through the CsPbI3:EuI2 perovskite PV rooftop are crucial, as they represent the solar radiation that illuminates the radicchio plants, thereby influencing their growth and development. On the other hand, the absorbed light is directly related to the generation of electric energy by the CsPbI3:EuI2 perovskite PV rooftop. Photovoltaic energy generation for each month is depicted in Fig. 6e, with related values listed in Table 1.

a Rendering of the real-world application of perovskite PV rooftop on a greenhouse for the maturation of plants. b Incident (black) and transmitted (gray) monthly solar radiation. c Transmitted solar irradiance spectrum as a function of time, over one year, with 2h resolution. d Wavelength-resolved solar radiation is obtained by integrating transmitted solar irradiance spectrum over one year. e Monthly photogenerated electric energy.
The lowest photovoltaic output of the CsPbI3:EuI2 perovskite PV rooftop is recorded in December (5.9 kWhm−2), while the highest is observed in June (34 kWhm−2), with intermediate values throughout the year. The photoconversion efficiency (calculated as the ratio between the monthly integrated generated electric power and incident solar radiation) varies over the year as shown in Table 1. The average value of 12.75%, as expected, is very close to the value of 12.67% obtained for 1 sun illumination (see Fig. 5c). The estimated total annual energy production of the CsPbI3:EuI2 perovskite PV rooftop amounts to 220–243 kWhm−2, which takes into account the possible inaccuracies in the simulated performance (Supplementary Note 1). Typically, greenhouse cultivation involves substantial energy usage for tasks such as heating, cooling, irrigation, and lighting92. According to literature93, annual energy consumption in European Union (EU) greenhouses for cultivating leafy greens like radicchio or lettuce ranges from 1 kWhm−2 to 5 kWhm−2 for low-energy intensity structures and from 83 kWhm−2 to 222 kWhm−2 for high-energy intensity greenhouses, with variations based on geographical location. Thus, the projected total annual production of the CsPbI3:EuI2 perovskite PV rooftop (243 kWhm−2) would fulfill the energy needs of high-energy intensity greenhouses, exceeding by nearly two orders of magnitude those of low-energy intensity. In 15 days, the duration of our experiment, the greenhouse rooftop would produce 16 kWhm−2. In indoor applications at different illuminance conditions (white LED of 1000-500-200 lux), the PCE of CsPbI3:EuI2 ST-PSC would be 21–22%. The generated electricity through indoor greenhouse illumination could thus power sensors for overnight ambient monitoring (Supplementary Fig. 12).
Discussion
We have thoroughly examined the application of semitransparent CsPbI3:EuI2 perovskite layers as photoactive materials for Agrivoltaics, and we have provided their proof-of-concept application on the growth of radicchio seedlings into laboratory-scale greenhouses. We transversely focused on the structural/optical, agricultural, and photovoltaic aspects of this application. Through advanced structural and optical characterization, we have shown the high crystalline quality of the perovskite material and the positive tradeoff between absorption (bandgap at 705 nm) and transmittance achieved by using a Cs-based perovskite formulation, within the photosynthetically active radiation range for crop growth. The observation of radicchio seedling growth, from pre-germinated seeds under simulated sunlight, indicates enhanced development of leaves area and an increase in weight under the perovskite rooftop compared to the reference (bare glass rooftop). This result demonstrates the beneficial influence of the light spectrum filtered by the perovskite layer on seedling’s photomorphogenesis, to be mainly ascribed to the recorded deficiency in blue light, the abundance in red light, and the lower red/far-red intensity ratio. Although the overall transcriptomic profile is almost similar between the two tested conditions, specific responses are suggested by the expression patterns of 9 genes detected as DEGs comparing P samples vs the G ones. These genes likely associated to different environmental stress responses, metabolic pathways, growth regulation, and light perception exhibited different regulation patterns under perovskite conditions, indicating a physiological adjustment in the seedlings. Beyond the demonstrated impact in the first stage of the plant life cycle, results are promising and pave the way for further multidisciplinary studies dedicated to the use of perovskite for crop production in indoor environments. In the multidisciplinary approach, through real-world simulations of CsPbI3:EuI2 integrated into ST-PSC, we additionally estimated a projected annual clean energy production from perovskite PV greenhouse rooftop of 243 kWhm−2 pairing the requirements of high-energy intensity greenhouses (83–222 kWhm−2) for heating/cooling, illumination and irrigation needs. In summary, our study frames the advantages of integrating semitransparent CsPbI3:EuI2 perovskite into greenhouse rooftops for enhancing seedling growth and physiological responses, and for simultaneous self-production of clean energy at the cost of affordable technology. This study sets the stage for an extension to large-scale systems under real conditions.
Methods
Fabrication of perovskite films
A solution containing 1 M PbI2 (Tokyo Chemical Industry) and 1 M CsI (Tokyo Chemical Industry) was prepared by blending them in a composite solvent made of DMF and DMSO (3:1 v/v). Additionally, a solution of 0.1 M EuI2 (Sigma-Aldrich) was prepared using the same mixed solvent of DMF and DMSO (3:1 v/v). These solutions were stirred at room temperature for 1 hour. Then, 1 ml of the PbI2/CsI solution was combined with 0.5 ml of the EuI2 solution to achieve the desired stoichiometry, followed by stirring for another 1 hour94. The entire preparative was performed in ambient air (35% RH). The deposition of the perovskite film was carried out by spin-coating the precursor solution onto bare glass substrates (Corning 2947, transmittance > 90%) in two stages: initially at 1000 rpm for 10 seconds, followed by 5000 rpm for 25 seconds in an N2-filled glove-box95. The film was subjected to two-step annealing (90 °C for 15 min and 350 °C for 1 min) and rapidly cooled to room temperature to form the photo-active phase of CsPbI3:EuI2.
X-ray diffraction
X-ray diffraction (XRD) patterns were acquired using a SmartLab (Rigaku) diffractometer equipped with a 9 kW rotating anode Cu X-ray source operating at 45 kV and 100 mA, along with a HyPix-3000 detector. The recording step size for the patterns was configured at 0.01°, with an acquisition speed of 0. 1° per minute96.
Photoluminescence spectroscopy
Photoluminescence Spectroscopy measurements were performed using a commercially available instrument (Arkeo, Cicci Research s.r.l.). The samples were excited with a green laser (532 nm) at an incident angle of 45 degrees, generating a circular spot with a diameter of 1 mm. After a waiting period of 1000 ms, the PL signal was recorded using a spectrometer.
Spectroscopic ellipsometry
We used a V-VASE, J A Woollam spectroscopic ellipsometer equipped with an autoretarder for optical characterization. To prevent degradation from exposure to humid air, the sample was enclosed in a sealed chamber with an overpressure of N2. Optical constants were assessed across the 190–2500 nm spectral range to construct a comprehensive model. Considering that the sample was deposited on glass, appropriate adjustments were made to account for potential light interaction with the back surface of the glass slide. The thickness of the perovskite was determined by ensuring adherence to the Cauchy equation for the refractive index in the transparent region, maintaining consistency for subsequent evaluation of an optical model consistent with Kramers-Kronig relations97,98,99, based on a multiple critical point parabolic band. We calculate the absorption coefficient from the ellipsometer dielectric function (ϵ1 and ϵ2)100,101. The average visible transmittance was calculated from the simple arithmetic mean of the transmittance in the 400-800 nm range91.
Laboratory scale greenhouse and Illumination setup
Magenta™ GA-7 boxes are used to build up laboratory-scale greenhouses. The internal walls are white-painted to enable multiple light reflections as in real greenhouses. Air circulation is assured through small hollows, a few millimeters in diameter. An organic soil made of 70% peat and 30% sterile sand is placed at the basis of the boxes and is seeded at a density of 2 seeds/cm2, resulting in a total of 4 seeds sown within each box. A glass rooftop, with or without perovskite coverage, is located in the uppermost part of the greenhouse, connected to a pipeline of pure nitrogen that assures a dynamic flux of gas to preserve the perovskite layer from degradation. In an outdoor case, encapsulated perovskite would be used. Immediately over the rooftop, simulated sunlight for plant illumination is provided by a LEDs tower placed over the rooftop (Cicci Research srl) made of 12 LEDs, specifically made of Warm White ( > 4750K), Cool White ( < 3750K), Far UV (360-370nm), UV (380-390nm), Deep Blue (445-465nm), Green (490-535nm), Amber (580- 600nm), Red (620-630nm), Hyper Red (650-670nm), Far-Red (720-740nm), IR (840-870nm), Far IR (925-955nm).
Spectrophotometer
A spectrophotometer, provided by Cicci Research s.r.l., was used to acquire the light spectrum reaching the plants in the G (under glass) and P (under perovskite) samples. The spectrometer is placed at the same height of radicchio seedlings to measure the spectral irradiance of the light coming from 12 LEDs Tower. The measurements were carried out in a spectral range from 330 nm to 1100 nm with a spectral resolution of 1 nm and an integration time of 10 ms.
Photovoltaic production simulation
Photovoltaic devices were simulated using the 1D electro-optical simulator Setfos (v5.4.12) by Fluxim102, which self-consistently combines the drift-diffusion formalism for charge transport with the transfer-matrix formalism for optical absorption/transmission. The wavelength-dependent complex refractive indices of the perovskite are measured by ellipsometry as described in Section 2.4. Those for the other materials are taken from the literature (Supplementary Table 3). All the layers except glass are modeled as optically coherent. The drift-diffusion parameters for all materials are reported in Supplementary Table 3. The drift-diffusion model in steady-state mode is solved by letting SETFOS automatically select the appropriate solver (Newton or Gummel) and the corresponding settings for the residuum and damping factors during the computation. The Air Mass 1.5 ASTM G-173-03 (included in the SETFOS database) with 0° incident angle is adopted as the reference spectrum for 1 sun illumination. The solar irradiation on a specific date/time and location is calculated using the SMARTS model implemented in Setfos103. Both direct and diffuse solar radiation are considered, assuming illumination of a solar cell parallel to the ground, located in Treviso, Italy (45.65 °N, 12.18 °E, 18 m above sea level) at a user-defined date and time. The total solar radiation is described in terms of global horizontal irradiance, which is the sum of direct and diffuse radiation. Direct radiation is given by the direct normal radiation multiplied by the cosine of the solar zenith angle. Diffuse light is modeled by activating the scattering mode in SETFOS with 30 incident angles from 0 to 90°. A clear-sky scenario is always considered.
RNA extraction, library preparation, sequencing and bioinformatic analyses
For RNA extraction and sequencing, multiple replicates were employed, each consisting of four seedlings within a Magenta™ box. Specifically, three biological replicates were used for plants cultivated under glass (G) conditions, and two for those grown under a perovskite layer (P) to provide comparable biological mass104. Shoots (approximately 100 mg of plant material per sample) were ground in liquid N2 in 2-ml tubes filled with two steel beads (diameter 0.4 mm) and homogenized through a TissueLyser II (Qiagen, Valencia, CA, USA) at 28Hz for 60 seconds. Total RNA was isolated by using a CTAB-based method105. A list of used reagents for RNA extraction is reported in Supplementary Data 4. The RNA was resuspended in RNase-free water and its quantity was determined by using a Nanodrop 2000 spectrophotometer (Thermo Fisher Scientific, Waltham, MA, USA). Library preparation and RNA sequencing were performed by IGATech located in Udine (Italy). The Universal Plus mRNA-Seq kit (Tecan Genomics, Redwood City, CA) was used for library preparation following the manufacturer’s instructions (library type: fr-secondstrand). Libraries were then prepared for sequencing and sequenced on paired-end 150 bp mode on NovaSeq 6000 (Illumina, San Diego, CA). In total, 5 Illumina RNA-seq libraries were generated and sequenced.
The RNA sequencing data were processed through Illumina BCL Convert v3.9.31 to perform the base calling, demultiplexing, and adapter masking processes. Subsequently, ERNE software106 was employed to trim low-quality bases and adapters. The filtered reads were then aligned on the radicchio reference genome107 using STAR software48, which is specifically designed for splice junction mapping in RNA-Seq reads. Transcript assembly and quantification, including the identification of various spliced variants at each gene locus, were performed using Stringtie108. For differential expression analysis, the reads overlapping with genes were quantified using htseq-count109. The software DESeq2 was then applied to read counts obtained from htseq-count of each gene to model differential expression using a Generalized Linear Model (GLM), enabling the comparison of expression levels across genes and transcripts110. The identification of differentially expressed genes (DEGs) was conducted post-normalization of count data and correction for multiple testing by DESeq2110, using a Wald test. For this analysis, condition G was set as the reference one. Differentially expressed genes were identified using a threshold of an adjusted p-value ≤0.05. Both the identified DEGs and the entire transcriptome of the radicchio genome were annotated via Blast2GO111 to achieve an updated functional annotation. The dataset (raw data) that supports the findings of this study is available in the NCBI Sequence Read Archive (SRA-NCBI) under BioProject accession number PRJNA1106249.
Reporting summary
Further information on research design is available in the Nature Portfolio Reporting Summary linked to this article.

Responses