Inconsistent influence of temperature, precipitation, and CO2 variations on the plateau alpine vegetation carbon flux

Introduction
The intricate relationship between vegetation and climate is a fundamental aspect of the Earth’s natural evolution1. Vegetation, acting as the vital “link” between soil, atmosphere, and water, serves as a clear indicator of global climate change2. Consequently, climate shifts exert profound effects on the growth dynamics of vegetation, making the study of these interactions a critical area of interest for scholars in botany, climatology, ecology, and geography3. It is also an essential component of global change research4.
The Qinghai-Tibet Plateau, with its unique natural environment and strategic geographical position, showcases a distinctive interplay and adaptation mechanisms between climate change and vegetation5. This region stands out as a pivotal experimental site for climate-vegetation research6,7,8, offering a challenging yet rewarding area of study. The Qinghai Tibet Plateau is known as the “water tower of Asia” and is the source of many major rivers such as the Yangtze River, Yellow River, and Lancang River. It has a significant impact on regional and global climate. The ecosystem of the plateau plays a mitigating role in global climate change by regulating the water cycle and climate system. The climate change rate on the Qinghai Tibet Plateau exceeds the global average, with surface temperatures rising by 0.3 °C every decade, while the global land surface temperature is rising by 0.12 °C every decade. This makes the Qinghai Tibet Plateau an important region for studying the impacts of climate change. Characterized by an average altitude exceeding 4000 m, the plateau’s dynamic and thermal effects significantly influence atmospheric and climatic conditions in East Asia and beyond9,10. The physical state of the plateau’s surface, especially the alpine steppe vegetation, plays a crucial role in influencing the water and heat balance, as well as carbon cycling, with direct implications for the middle atmosphere. Studies have documented a significant warming trend over the past six decades, with the plateau exhibiting higher sensitivity to global climate change compared to lower altitude regions. Thus, examining the regional-scale impact of climate change on the alpine vegetation system of the Qinghai-Tibet Plateau holds significant scientific value. Variations in temperature, precipitation, and CO2 concentration lead to changes in the ecological functions of vegetation, such as photosynthesis, respiration, and phenology11,12,13. These changes, in turn, impact the global carbon balance. Investigating the influence of climate change and CO2 concentration on vegetation Leaf Area Index (LAI), as well as the dynamics of plant carbon balance, is imperative. The ecosystem of the Qinghai Tibet Plateau absorbs ~120–140 million tons of carbon dioxide annually, accounting for 10–16% of China’s total ecosystem carbon sink. The permafrost regions of the plateau store ~37 billion tons of organic carbon, accounting for over 60% of the total soil carbon storage on the plateau. Against the backdrop of warm and humid climate, the carbon sequestration capacity of alpine grasslands on the Qinghai Tibet Plateau continues to increase. The increase in precipitation and temperature jointly promotes vegetation growth and carbon absorption. Future climate warming may lead to the melting of deep permafrost, posing a threat to the carbon sequestration capacity of the Qinghai Tibet Plateau. This research objective not only deepens our understanding of alpine plant dynamics in the face of climate change but also contributes to the development of time-series dynamic parameters for plateau mechanism models.
Extensive research has been conducted both domestically and internationally on the impact of climate change on vegetation dynamics. Scholars such as Zhang and Zhou have conducted significant research on global climate and vegetation classification6,14,15. Gao has utilized spatial simulation methods to model the response of vegetation productivity and biomass to CO2 concentration and climate change16. Yang et al. have explored the effects of climate change on vegetation growth in the northern Tibetan Plateau17, while Ding et al. have utilized 8 km × 8 km resolution NDVI data to analyze intra-annual variations in vegetation cover and hydrothermal conditions18. Luo et al. have demonstrated through remote sensing studies that alpine vegetation growth on the Qinghai-Tibet Plateau responds non-linearly to global warming19. Song et al. reconstructed MODIS EVI time series data for the northern Tibetan Plateau from 2001 to 201020. The analysis focused on examining the influence of temperature and precipitation on vegetation phenology changes. However, these studies often lack a comprehensive evaluation using dynamic vegetation models and are less common in their utilization of time-series remote sensing data.
To capture the instantaneous impact of climate change on terrestrial ecosystems, there is a need for more comprehensive models that integrate vegetation dynamics and biogeochemical processes. Dynamic Global Vegetation Models (DGVMs) have been developed for this purpose21,22,23,24. Prominent models include LPJ (Lund-Potsdam-Jena Model), VECODE (Vegetation Continuous Description model), and ETEMA (European Terrestrial Ecosystem Modelling Activity). These models have been instrumental in simulating the effects of CO2 concentration and climate change on ecosystem functions and vegetation structure25,26. The Qinghai-Tibet Plateau, with its significant global warming trends and intricate land-atmosphere interactions, requires sophisticated land surface process models. The LPJ DGVM, which is part of the GCTE (Global Change Terrestrial Ecosystems) dynamic vegetation modeling initiative, has been extensively used in regional carbon cycling, paleoclimate, and atmospheric-land feedback research. This study aims to enhance the internationally recognized LPJ DGVM for the Qinghai-Tibet Plateau, with a focus on the impacts of climate change and CO2 concentration on alpine vegetation carbon fluxes. It will greatly enhance the understanding of the superimposed fluctuations of temperature, precipitation, and CO2 concentration are crucial for the Alpine Vegetation Carbon Flux on the Qinghai-Tibet Plateau.
Results
Validation
Gross Primary Productivity (GPP) result validation
At the A’rou Meadow Eddy Covariance Station, the GPP estimates derived from the LPJ model for the year 2013 demonstrated a strong alignment with the GPP measurements obtained through eddy covariance techniques. This correlation is evidenced by an R-squared (R2) value of 0.8332, indicating a high degree of explanatory power, and a root mean square error (RMSE) of 1.96, which signifies a relatively small deviation between the model’s predictions and the actual observations (the left panel of Fig. 1).

The left panel is the validation results in 2013, the right panel is that of in 2014.
Continuing this analysis into 2014, the GPP simulated by the LPJ model maintained a general concurrence with the eddy covariance-observed GPP, further affirming the model’s reliability. The R2 value for 2014 was even more robust at 0.8608, and the RMSE was reduced to 1.485, suggesting an even closer match between the model simulations and empirical data (the right panel of Fig. 1).
Despite this overall agreement, some discrepancies were noted, particularly during the peak growth periods of spring and autumn. Notably, the model simulations tended to overestimate the GPP in comparison to the eddy covariance measurements.
These discrepancies could be attributed to various factors, such as inter-annual variability in environmental conditions or the specific physiological responses of plants to these conditions, which may not be fully captured by the model.
Net Ecosystem Productivity (NEP) result validation
The NEP as simulated by the LPJ model for the year 2013 was found to be in general agreement with the NEP data captured by eddy covariance measurements. This concurrence is underscored by the R2 value of 0.6188, indicative of a moderate to strong correlation, and an RMSE of 1.15, which reflects a reasonable level of accuracy in the model’s predictions (the left panel of Fig. 2).

The left panel is the validation results in 2013, the right panel is that of in 2014.
Continuing this assessment into 2014, the NEP simulated by the LPJ model maintained a similar level of consistency with the eddy covariance observations. The R2 value for 2014 was 0.6877, suggesting a slight improvement in the model’s performance, and the RMSE was 1.19, indicating a slight increase in the deviation from the observed values (the right panel of Fig. 2).
Despite this overall pattern of agreement, there were notable discrepancies, particularly in July and August, where the observed NEP exhibited anomalies. These anomalies could be attributed to a variety of factors, such as extreme weather events, inter-annual variability in environmental conditions, or specific biological responses of the ecosystem that may not be fully accounted for in the model. These discrepancies highlight the need for further analysis and refinement of the model to better capture the ecosystem’s response to seasonal and inter-annual variability.
In the period of grass growth, the CO2 uptake through photosynthesis constitutes a significant component of the net ecosystem exchange. This process of photosynthesis is predominantly driven by PAR, temperature, and the phenological state of the vegetation. The first two factors are climatic variables that exhibit significant diurnal variations, which in turn induce substantial variations in the rate of photosynthesis throughout the day. As a result, the diurnal pattern of NEP during the grass growth season exhibits quite significant changes. Despite the influence of environmental factors such as temperature and PAR on NEP, the relationship between NEP and these individual factors is not particularly strong.
In addition, NPP is one of important variables for understanding the carbon balance, hence, the validation of NPP is also important. However, from the eddy covariance data collected in this paper, only the GPP and NEP were calculated to validation. NPP can’t calculated from the eddy covariance data. If actual measurement of NPP is to be carried out on the Qinghai Tibet Plateau, it is necessary to measure both aboveground and underground biomass simultaneously in order to accurately calculate NPP. However, it is very difficult to measure the NPP of perennial vegetation types on the Qinghai Tibet Plateau, so this article does not provide the validation results of NPP. This is also one of the issues that need to be addressed in the follow-up work.
Spatiotemporal changes in carbon flux of alpine vegetation
Changes in carbon flux parameters of alpine vegetation
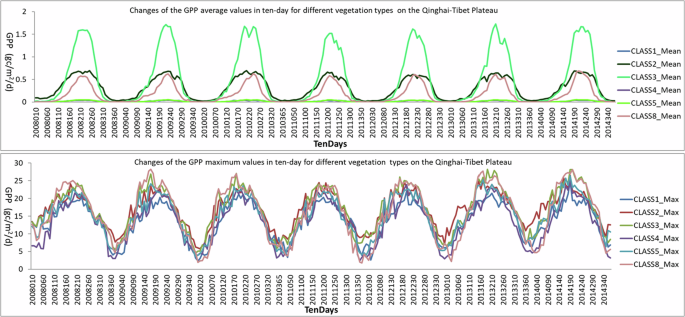
This study presents a comprehensive statistical analysis of the carbon flux dynamics within alpine vegetation across the entire region, focusing on key metrics such as the average and maximum values of GPP, NPP, and NEP, as depicted in Fig. 3.

The above panel shows the GPP/NPP/NEP Average value in 10-day, and the below panel is GPP/NPP/NEP Maximum value in 10-day throughout study area.
The analysis reveals pronounced interannual variations in these carbon flux parameters of alpine vegetation, with notable peaks in both the average and maximum values occurring during the summer months. This pattern is primarily attributed to the increased sunlight intensity in the summer, which stimulates rapid grass growth and consequently enhances the absorption of CO2 and the generation of vegetation carbon flux through the process of photosynthesis. Photosynthesis is predominantly influenced by climatic factors including photosynthetically active radiation, temperature, and precipitation. These factors exhibit significant daily and 10-day variations, leading to substantial temporal variations in photosynthesis. Therefore, photosynthesis fluctuates greatly in time, resulting in more intense seasonal changes in the carbon flux parameters GPP, NPP, and NEP during the grass growth stage. Conversely, during the non-growing season, the model accounts for only heterotrophic respiration, which leads to relatively minor simulated oscillations in the carbon flux parameters GPP, NPP, and NEP.
Changes in spatiotemporal patterns of 10-day and monthly GPP of different types
(1) GPP changes on a 10-day scale
Based on the statistics from Table 1, this paper focuses on a statistical analysis of the land use types CLASS 1–5, as well as 9 (encompassing farmland, forest, grassland, shrub, wetland, and bare land) according to their respective areas. The type CLASS7, representing tundra, is excluded from the statistics as it occupies zero percentage on the Tibetan Plateau.
As illustrated in Fig. 4, the inter-annual variation in GPP across these land use types on the Tibetan Plateau is also very significant, with the peaks of both the average and maximum values occurring during the summer. However, a closer examination reveals distinct differences among the various land use types in terms of their GPP patterns.
The above panel shows the GPP average value of each type in 10-day, the below panel is GPP maximum value of each type in 10-day.
Notably, the grassland type demonstrates the most significant peak in decadal average GPP, underscoring its critical role in the region’s carbon cycle. The forest type follows closely behind, also exhibiting a relatively high GPP peak. Interestingly, despite its sparse vegetation, bare land contributes a relatively substantial GPP, highlighting the resilience and carbon sequestration potential of such environments. Conversely, the farmland type, which occupies a smaller proportion of the area, exhibits a comparatively lower peak in GPP. This observation underscores the varying capacities of different land use types to contribute to the overall carbon sequestration efforts on the Tibetan Plateau. Understanding these differences is essential for the development of targeted strategies aimed at enhancing the region’s carbon uptake and mitigating the impacts of climate change.
From the performance of the maximum decadal values, it is still apparent that there are significant inter-annual variations in GPP among different types. The dynamics of these peak changes are intricate, yet it remains evident that grassland and forest are the predominant categories with higher GPP levels. This trend underscores the vital role these ecosystems play in the carbon cycle and their contribution to the overall carbon sequestration on the Tibetan Plateau.
However, because the designated bare land in the western regions is not entirely devoid of vegetation, The sparse plant life that manages to thrive in these arid regions is surprisingly efficient in generating significant GPP peaks. the sparse vegetation present also produces relatively strong GPP peaks. This phenomenon highlights the resilience of plant life in harsh environments and its potential to contribute to carbon uptake, even in areas typically considered barren.
The presence of vegetation on what is ostensibly bare land in the west is a noteworthy factor in the overall analysis of GPP. It emphasizes the importance of considering the variability and adaptability of ecosystems when assessing carbon flux and productivity.
(2) GPP Spatial Distribution
Figure 5 illustrates the spatial distribution of monthly GPP values across the Tibetan Plateau and its surrounding areas spanning from 2008 to 2014. It can be observed that the monthly GPP values range from 0 to 30 gc/m2/month, with a discernible spatial gradient that diminishes from the southeast to the northwest. and the spatial distribution shows a gradual decrease from “southeastern to northwestern” trends.
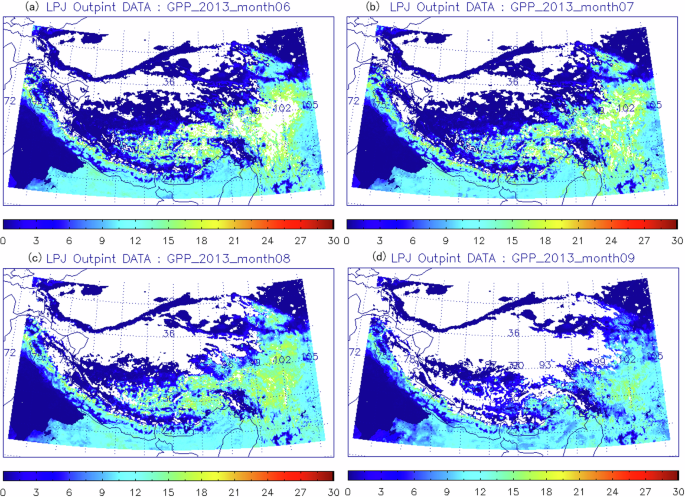
a June 2013; (b) July 2013; (c) August 2013; (d) September 2013.
The seasonal trends in GPP are particularly noteworthy. Commencing in May each year, there is a marked increase in monthly GPP values, which culminate in a peak during August and September. Subsequently, these values begin to decline gradually. This pattern correlates well with the spatial distribution of local temperature and precipitation, underscoring the significant influence of climatic factors on the distribution and productivity of vegetation GPP. The synchronization between GPP values and climatic conditions highlights the intricate relationship between vegetation growth and the environment.
Changes in spatiotemporal patterns of 10-day and monthly NPP of different types
(1) NPP changes on a 10-day scale
Figure 6 offers an insightful examination of the interannual variations in NPP across different land cover types on the Qinghai-Tibet Plateau. The data highlights the considerable fluctuations in NPP, with a distinct pattern of increased productivity during the summer months, where both the decadal average and maximum NPP values peak. However, discernible differences among the land cover types become apparent. Grasslands emerge as the most productive, with the highest peak in the decadal average NPP, underscoring their vital role in the region’s ecological system. Forests, with their dense canopy and extensive root systems, also contribute significantly to the NPP, exhibiting the second-highest peak. Interestingly, even areas categorized as bare land, which are typically characterized by sparse vegetation, demonstrate a notable NPP. This suggests that the vegetation present in these regions, despite being limited, is relatively highly efficient in its carbon assimilation capabilities. Conversely, the agricultural land type, which occupies a smaller proportion of the land area, shows a lower peak in NPP.

The above panel shows the NPP average value of each type in 10-day, the below panel is NPP maximum value of each type in 10-day.
These findings underscore the complexity of the NPP dynamics on the Qinghai-Tibet Plateau and the need for a nuanced understanding of the factors influencing productivity across different land cover types.
However, an analysis of the maximum NPP values across various land types reveals the presence of notable inter-annual variations in NPP dynamics. The complexity of these peak values is particularly noteworthy, as they reflect the intricate interplay between environmental factors and biological processes. Grasslands and forests maintain their status as the principal sources of NPP, with their extensive cover and diverse plant communities driving a substantial portion of the region’s carbon fixation. These ecosystems are characterized by their ability to convert sunlight into biomass efficiently, thereby playing a pivotal role in the carbon cycle and contributing to the overall productivity of the landscape. In addition to these dominant ecosystems, the analysis indicates that the so-called bare lands in the western regions also contribute relatively significantly to the NPP. They manage to produce strong NPP peak values.
(2) NPP Spatial Distribution
Figure 7 depicts a comprehensive overview of the spatial distribution of monthly NPP values for the Qinghai-Tibet Plateau and its surrounding areas spanning from 2008 to 2014. It is observed that the monthly NPP values fall within the range of 0 to 18 gc/m²/month, providing a detailed picture of the region’s carbon assimilation capacity. The spatial distribution of these NPP values shows a discernible southeast-to-northwest gradient, with a progressive reduction in productivity. This gradient is reflective of the varying environmental conditions and the differential responses of vegetation to these conditions across the diverse landscape of the plateau. Seasonally, the NPP values demonstrate a distinct pattern of increase, commencing in May each year. The NPP values reach their zenith in August and September, aligning with the optimal climatic conditions for photosynthesis and growth. Following this peak, the NPP values begin a gradual descent.

a June 2011; (b) July 2011; (c) August 2011; (d) September 2011.
The correlation between the seasonal patterns of NPP and the spatial distribution of local temperature and precipitation is particularly striking, indicating that climate change plays a crucial role in the distribution of vegetation NPP. The interplay between temperature and precipitation is critical in determining the availability of water and the intensity of photosynthetic activity, which in turn dictates the NPP values.
Changes in spatiotemporal patterns of 10-day and monthly NEP of different types
(1) NEP temporal variation on a 10-day scale
Figure 8 reveals that the interannual variations in NEP across various land cover types are also quite pronounced, with peak values for both the decadal average and the maximum occurring during the summer months. This pattern underscores the critical role that seasonal changes play in shaping the carbon balance within these ecosystems.
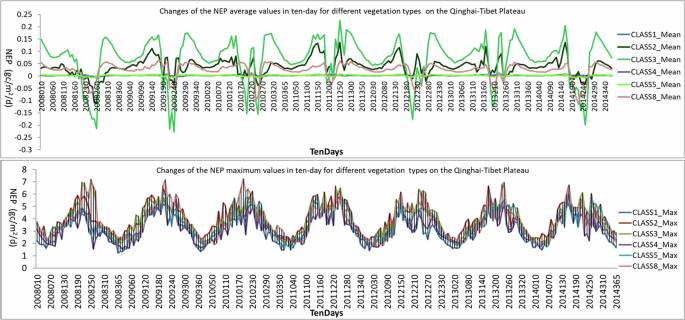
The above panel shows the NEP average value of each type in 10-day, the below panel is NEP maximum value of each type in 10-day.
However, there are differences among these types. Among the different land cover types, grasslands stand out as the most influential in terms of NEP, with the highest peak in the decadal average. This is attributed to their extensive coverage and the significant carbon sequestration potential of these ecosystems during the growing season. Forests, with their dense vegetation and complex canopy structure, also contribute substantially to the NEP, exhibiting the second-highest peak values. Even the bare land type, due to the presence of sparse vegetation, exhibits relatively high NEP. The presence of hardy plant species that can withstand the harsh conditions of the plateau allows these areas to contribute to the carbon cycle, albeit at a lower rate compared to more vegetated land cover types. Since the agricultural type covers a smaller proportion of the land area, its peak is relatively low.
Nevertheless, from the observations of the maximum values of NEP across various land cover types, it is apparent that there are still significant interannual variations, with peak changes that display a high degree of complexity. This observation underscores the dynamic nature of the carbon cycle within these ecosystems and the influence of multiple factors on their carbon sequestration capabilities. Grasslands and forests continue to be the predominant categories when it comes to NEP, with their expansive areas and diverse plant communities contributing significantly to the region’s carbon uptake. These ecosystems are instrumental in regulating the balance between carbon dioxide absorption and release, playing a critical role in mitigating the effects of climate change. In the western regions, yet the sparsely vegetated bare lands in the western regions, the sparse vegetation present also generates relatively strong NEP peak values.
(2) NEP Spatial Distribution
Figure 9 illustrates the spatial distribution of monthly NEP values across the Qinghai-Tibet Plateau and its surrounding areas over a period from 2008 to 2014. It is observed that the monthly NEP values range from 0 to 9 gc/m²/month. The spatial distribution of these NEP values exhibits a trend of gradual decrease from “southeast to northwest.” This gradient reflects the diverse environmental conditions and the varying responses of vegetation across the landscape of the plateau. Seasonally, starting from May each year, the monthly NEP values increase significantly and reach their peak in August to September, after which they gradually decline. This pattern aligns relatively well with the spatial distribution of local temperature and precipitation, indicating that climate change is crucial to the distribution of vegetation NEP.

a April 2014; (b) May 2014; (c) June 2014; (d) July 2014.
Inconsistent impact of climate change on alpine vegetation carbon flux parameters
Interannual changes in vegetation carbon flux parameters
A wealth of observational data has indicated that the global climate is experiencing unprecedented changes, driven primarily by the rise in greenhouse gases, including temperature, precipitation, and CO2. In recent decades, along with a notable warming trend and an escalation in the intensity of human activities, these changes have been particularly evident. Within this context, the Qinghai-Tibet Plateau, one of the world’s most significant high-altitude ecosystems, has witnessed considerable shifts in the productivity of its grassland vegetation. Data analysis reveals that since the 1980s, there has been a significant improvement in the NPP of alpine vegetation on the plateau. This enhancement in NPP was particularly pronounced during the two-decade span from the 1980s to the 1990s, a period characterized by a warmer and more humid climate on the plateau.
Although the NPP of grasslands on the Qinghai-Tibet Plateau has increased over the past decade, there is a regional imbalance. In the western parts of the plateau, the warming trend has been coupled with reduced precipitation, leading to drier conditions that, in turn, have negatively impacted grassland productivity. Conversely, in the eastern regions, the warming has been accompanied by increased humidity, creating more favorable conditions for plant growth, and thus contributing to a rise in grassland productivity.
Figure 10 illustrates the analysis of annual trends in NPP and GPP values on the Qinghai-Tibet Plateau from 2008 to 2014. From 2008 to 2014, the annual average NPP of alpine vegetation on the Qinghai-Tibet Plateau exhibited a pattern of fluctuating increase. This trend underscores the dynamic nature of the plateau’s ecosystems and the delicate balance between various climatic factors and their impact on vegetation productivity. The data reveals that the vegetation NPP and GPP on the plateau have followed a pattern of initial decline followed by an increase over the 7 years. This trend reflects the complex interplay between various environmental factors and the resilience of the ecosystem in adapting to these changes.

The left panel shows the change trends of the annual total and the annual average of GPP, the right panel is that of the annual total and the annual average of NPP.
Overall, the influence of climate change on the grasslands of the Qinghai-Tibet Plateau over the past 7 years has been generally positive, with climatic change playing a predominant role in the alterations of grassland productivity across most regions of the plateau.
From the diurnal variation trends of GPP/NPP within the year at the A’rou station on the Qinghai-Tibet Plateau during the years 2013-2014 (Fig.3), there are numerous fluctuations in GPP/NPP throughout the year, underscoring the close relationship between these variations and local climatic changes. In the subsequent sections, a detailed assessment is conducted to separately evaluate the impacts of temperature, precipitation, and CO2 on the observed variations in GPP/NPP.
Assessment of air temperature and precipitation impact
Figure 11 illustrates the annual trends in temperature and precipitation, along with their NPP and GPP fluctuations, at the A’rou station on the Qinghai-Tibet Plateau. An analysis of the annual precipitation and NPP/GPP trends indicates the overall trend of annual precipitation and NPP/GPP is increasing, except for the year 2011. This increase in precipitation is a significant factor affecting the hydrological cycle and the productivity of the ecosystem, as water is a critical resource for both plant growth and the overall health of the environment. Despite some fluctuations, the underlying trend is consistent with the patterns of precipitation, suggesting that while temperature exerts a profound influence on the immediate metabolic activities of vegetation, shaping the rates of photosynthesis and respiration, the broader trajectory of carbon assimilation and ecosystem productivity is intricately tied to water availability.

The left panel shows the variation trends between the annual total precipitation and the annual total NPP, the right panel is between the annual average temperature and the annual total GPP.
In contrast to the precipitation trends, the interannual fluctuations in the average annual temperature are relatively pronounced. An analysis that integrates the data on NPP and GPP fluctuations, reveals poor synchronicity between NPP/GPP with temperature variations (Fig. 11 right). The data suggest that drastic changes in temperature lead to corresponding abrupt shifts in NPP/GPP, although the overall trend aligns with the persistent changes in precipitation. Despite these fluctuations, a slight overall decline in temperature is noted, which could be attributed to various climatic factors and their complex interactions. This indicates that the carbon flux parameters of alpine vegetation are not consistent with temperature changes. This correlation underscores the sensitivity of the carbon flux parameters of alpine vegetation on the Qinghai-Tibet Plateau to temperature changes. Air temperature regulates carbon flux by affecting the photosynthesis and respiration of plants. NEP is the difference between the carbon absorbed by photosynthesis and the carbon released by respiration. The impact of temperature on NEP depends on the relative changes in photosynthesis and respiration.
The daily variations in temperature and precipitation from 2008 to 2014 are quite complex, reflecting the dynamic nature of the Plateau’s climate. The peak values for both temperature and precipitation occur during the summer months of July and August. Combining this with the GPP change graph for the same year, it is observed that the temperature fluctuations are generally in phase with GPP changes but inverse to the changes in NEP. This pattern is significant as it aligns with the growing season when the demand for water and optimal temperature conditions are highest for the region’s vegetation.
The peaks in the annual GPP variation matched the corresponding precipitation peaks. This further emphasizes the pronounced influence of precipitation on the carbon flux parameters of alpine vegetation on the Qinghai-Tibet Plateau. The findings underscore the importance of considering the interplay between temperature and precipitation when assessing the health and productivity of alpine ecosystems.
Precipitation is a key factor for vegetation growth on the Qinghai Tibet Plateau. Increased precipitation can significantly improve NPP and GPP of vegetation, as water is a necessary condition for plant photosynthesis and growth. In the Qinghai Tibet Plateau, an increase in precipitation can promote the growth and expansion of vegetation, thereby enhancing the carbon absorption capacity of ecosystems. An increase in precipitation can also improve soil moisture, facilitate the activity of soil microorganisms, promote the decomposition and mineralization of soil organic carbon, and thus affect the dynamics of soil carbon pools. In addition, an increase in soil moisture can reduce the loss of soil respiration and improve the efficiency of soil carbon fixation.
In recent years, the Qinghai Tibet Plateau has shown a trend of warm and humid climate, with rising temperatures and increased precipitation. The changes in vegetation carbon flux under this climate background are complex, but overall, a warm and humid climate is conducive to vegetation growth and carbon absorption, which continuously enhances the carbon sequestration capacity of alpine grasslands on the Qinghai Tibet Plateau. The coordinated changes in precipitation and temperature have a significant impact on the stability of the ecosystem on the Qinghai Tibet Plateau.
Assessment of CO2 concentration impact on alpine vegetation
A pronounced correlation exists between these carbon flux parameters and temperature and precipitation, where significant temperature deviations can precipitate sudden alterations in NPP and GPP. Lastly, CO2 concentration, as a key substrate for photosynthesis, can influence the rate at which plants assimilate carbon and produce biomass.
Figure 12 illustrates the trends in CO2 concentration trends at the Waliguan station, located on the Qinghai-Tibet Plateau. The data indicates a clear and consistent increasing trend in CO2 concentration over time, which is a critical factor to consider when evaluating the carbon cycle dynamics within this high-altitude ecosystem. However, the observed changes in CO2 concentration do not exhibit a strong correlation with the variations in the LAI. This decoupling of CO2 concentration and LAI suggests that other factors, such as changes in photosynthetic efficiency or plant community composition, may also be influencing the carbon flux parameters.

The left panel shows the change between CO2 and LAI, the right panel is between CO2 and NPP from 2008 to 2014.
When the trend in CO2 concentration is examined in conjunction with the NPP/GPP change graph, the annual trend of CO2 concentration changes appears to be not in sync with the variations in NPP/GPP. Combined with the left figure in Fig. 11, it can be seen that the NPP/GPP only shows an upward trend when both CO2 concentration and precipitation increases. This relationship suggests that the carbon flux parameters of alpine vegetation on the Qinghai-Tibet Plateau are not only responsive to CO2 concentration but also to broader climatic trends, including precipitation patterns.
The increase in carbon dioxide concentration directly affects plant growth and water use efficiency. High concentrations of carbon dioxide contribute to photosynthesis in plants, thereby increasing productivity and carbohydrate storage. The increase of carbon dioxide in the air will improve the absorption and acquisition of carbon dioxide by plants, reduce the stomatal degree of plant leaves, decrease plant transpiration, and shorten the opening time accordingly. An increase in carbon dioxide concentration can enhance water use efficiency, improve plant water use efficiency, and produce more biomass by consuming a unit of water. The increase in carbon dioxide concentration can promote photosynthesis and growth of vegetation, but this promoting effect is limited by other factors such as water and nutrients. In addition, the synergistic changes in temperature and precipitation also have a significant impact on vegetation carbon flux.
As previously discussed, the overall trend of the carbon flux parameters of alpine vegetation aligns with precipitation and the drastic shifts in temperature can lead to considerable changes in NPP/GPP, highlighting the multifaceted nature of the factors that drive the carbon cycle in alpine ecosystems. The interplay between temperature, precipitation, and CO2 concentration creates a complex matrix of influences that together determine the carbon sequestration capacity and overall productivity of the vegetation on the Qinghai-Tibet Plateau.
Discussion
The LPJ model, widely recognized for its comprehensive representation of terrestrial ecosystem processes, has shown limitations in accurately capturing the unique environmental dynamics of the Qinghai-Tibet Plateau. Specifically, the model’s current configuration does not adequately account for the critical process of freeze-thaw cycles, a factor of significant importance in the region’s hydrological dynamics. The absence of a robust frozen-thaw process simulation within the hydrological cycle module of the LPJ model leads to a deficiency in the precise estimation of soil moisture levels and the prediction of its trends. Therefore, in this study, soil moisture is considered as an input and incorporated into the model. By incorporating observed soil moisture data directly into the model, this approach aims to improve the simulation of hydrological processes and, consequently, provide a more accurate reflection of the actual conditions on the Qinghai-Tibet Plateau.
The model simulation outcomes occasionally exhibit trends that are not in alignment with the change captured by eddy covariance measurements. Further analysis is required to understand the reasons for these discrepancies. Such an analysis will contribute to the refinement of the model, ensuring that it more closely reflects the actual ecological and environmental processes being studied.
During the simulation, the allocation of photosynthetic products within vegetation, as well as the vital processes of vegetation mortality and the emergence of new individuals, were not considered. As a result, the model is unable to simulate the structural parameters of the vegetation.
There are two main limitations of the model: Firstly, as mentioned earlier, it does not consider the freeze-thaw process of plateau soil. Another reason is that the CO2 data used is only annual scale data from a single station. Therefore, future researchers may consider making improvements.
Methods
Study area and data
Study area and validation site
The Qinghai-Tibet Plateau, located between 26°00’ to 39°47’ N and 73°19’ to 104°47’ E, is a vast and geographically diverse region. Spanning ~2800 km from east to west and ranging in width from 300 to 1500 km from north to south, it encompasses a total area of around 2.5 million square kilometers. With an average altitude exceeding 4000 m and varying between 3000 and 5000 m, the plateau is the cradle of numerous significant rivers that flow into East Asia, Southeast Asia, and South Asia. This high-altitude terrain is blessed with plentiful solar and geothermal energy resources, as well as extensive permafrost areas. The landscape is predominantly characterized by natural grasslands, which are diverse and can be classified into eight distinct types: alpine vegetation, alpine shrub meadows, subalpine sparse forest shrub meadows, alpine steppes, alpine mountain deserts, alpine swamps, mountain shrubs, and sparse and mat-like grasslands. Among these, the alpine vegetation stands out as the most extensive and significant grassland type27.
The climate across the plateau is characterized by a sharp gradient in temperature, with the annual average temperature dropping from 20 °C in the southeast to below −6 °C in the northwest. This temperature variation is influenced by the obstruction of warm and humid oceanic air currents by a series of mountain ranges. Similarly, the annual precipitation shows a significant decrease from 2000 mm to less than 50 mm, a pattern also shaped by the region’s topography. On the northern slope of the Himalayas, the annual precipitation is less than 600 mm, while the southern slope experiences a subtropical and tropical north edge mountain forest climate, characterized by an average temperature of 18–25 °C during the hottest month and an annual precipitation ranging from 1000 to 4000 mm. In the southern and western parts of the Kunlun Mountains, the climate shifts to a cold semi-desert and desert climate, with the warmest month’s average temperature hovering between 4–6 °C and an annual precipitation of 20–100 mm. Despite these varied climatic conditions, the plateau benefits from abundant sunshine, receiving an annual solar radiation total of 140–180 kcal/cm² and an annual sunshine duration of 2500–3200 h (China Digital Science and Technology Museum, https://www.cdstm.cn/) .
Overall, the Qinghai-Tibet Plateau is a region of remarkable environmental diversity and ecological significance, shaped by its unique geographical position and complex topography. Understanding its climate and the distribution of its vegetation types is crucial for ecological conservation, sustainable resource management, and the assessment of its role in the global carbon cycle.
Validation data for this study is derived from the eddy covariance measurements at the A’rou Grassland Station, as illustrated in Fig. 14. Nestled on the southern banks of the Bajiao River—a tributary of the Hei River—the A’rou Grassland Station occupies a relatively level and expansive riverplain highland. The station is precisely located at coordinates 100°27’ E and 38°02’ N, with an elevation of 3032 me, where the predominant landscape is that of alpine vegetation.
The comprehensive atmospheric observation program at the station comprises a suite of measurements, including wind temperature and humidity gradients at 2 m and 10 m above the ground, barometric pressure monitoring, and precipitation assessment. The atmospheric, radiation, and soil observations are meticulously recorded at a frequency of 0.2 Hz, with data points averaged over 10-min intervals to ensure the reliability and accuracy of the collected information. To capture more dynamic and transient atmospheric processes, eddy correlation measurements are taken at a higher frequency of 10 Hz. The eddy covariance data utilized in the current research spans the period from 2013 to 2014, providing a rich dataset that enables a thorough analysis of the carbon and energy exchanges within the alpine vegetation ecosystem of the Qinghai-Tibet Plateau.
Data
(1) Meteorological data and processing
The meteorological data that serves as input for the model encompasses a range of daily parameters, including average temperature, precipitation, net radiation, and CO2 concentration. These daily averages for temperature, net radiation, and rainfall are derived from hourly observations, providing a detailed temporal resolution for the model’s analysis. The dataset for daily average temperature spans from January 1, 2008, to December 31, 2014, offering a comprehensive overview of the temperature trends across the Qinghai-Tibet Plateau. The plateau is characterized by generally low daily average temperatures, with the maximum temperatures ranging from 25.0 to 26.0 °C and the extreme minimum temperatures falling below −36.0 °C. In the northern parts of Tibet, the average temperature is notably cooler, with a mean of 8.0 °C. The temperature patterns reveal that the lowest daily average temperatures occur in late January and early February, while the peak temperatures are typically observed in July, August, and September. The daily rainfall data, also covering the period from January 1, 2008, to December 31, 2014, highlights the spatial and temporal variability of precipitation across the Qinghai-Tibet Plateau. Rainfall distribution is notably uneven, with a significant concentration of precipitation in the southeastern region, particularly during the summer months of July, August, and September. The model also incorporates daily radiation data for the same period, from January 1, 2008, to December 31, 2014. This inclusion of radiation data is essential for understanding the energy balance within the ecosystem and for accurately modeling the interactions between the atmospheric and terrestrial components of the carbon cycle. Overall, the integration of these detailed meteorological datasets into the model provides a robust framework for analyzing and predicting the complex dynamics of carbon fluxes on the Qinghai-Tibet Plateau.
To improve the simulation accuracy of the model, it is not only necessary to enhance the functionality of the model itself but also to make full use of existing observational data. The transition of the LPJ model from point-scale to regional-scale applications demands a substantial dataset for input. Generally, the regional input data are derived and upscaled from point observations through various techniques, such as Kriging interpolation, to ensure spatial representativeness. In addressing gaps in the dataset, a suite of strategies is employed. For instance, data points with occasional missing values are often filled by substituting with the mean of adjacent measurements. For instances where more extensive data gaps are present, linear interpolation is applied to estimate the missing values. In cases where there are more than 10 consecutive missing values, the approach involves borrowing values from corresponding time frames of adjacent dates. To generate gridded data at a finer resolution, daily average temperature, net radiation, and rainfall data are subjected to geographic interpolation to fit a 5 km × 5 km grid pattern, using latitude and longitude as the projection basis. This process facilitates a more nuanced and localized representation of the input variables, which is critical for the model’s performance and accuracy.
As for the CO2 concentration data, the LPJ model requires annual totals of CO2 concentration for the period spanning from 2008 to 2014. This essential data is sourced from the Waliguan station located in Qinghai province. The monthly CO2 concentration data collected at the Waliguan station are meticulously processed and aggregated into annual totals, which are then formatted and input into the LPJ model according to the required specifications (https://gaw.kishou.go.jp/).
By meticulously integrating and processing these diverse datasets, the LPJ model is poised to deliver simulations that are both robust and reflective of the complex dynamics at play within the regional ecosystem.
Vegetation remote sensing data
The LAI stands as a pivotal structural parameter that facilitates the quantitative analysis of energy exchange dynamics within vegetative ecosystems. It is precisely defined as half the total one-sided leaf area per unit of ground surface area. In this study, the LAI dataset is sourced from a remote sensing product crafted by Beijing Normal University, which utilizes MODIS (Moderate Resolution Imaging Spectroradiometer) data. The original data boasts a resolution of 1 km, providing a detailed depiction of the LAI across the landscape (https://muses.bnu.edu.cn/). To align with the requirements of this study, the spatial resolution of the LAI data is adeptly adjusted to a 5 km × 5 km grid (Fig. 13). This resizing enhances the compatibility of the data with the model’s input specifications while maintaining a balance between the level of detail and computational efficiency. Subsequently, the data corresponding to the Qinghai-Tibet Plateau is meticulously extracted and transformed into a text format. This conversion is instrumental in streamlining the data integration process into the model, ensuring a seamless and accurate representation of the region’s LAI for the study’s analytical purposes.

The left panel shows the LAI data in 2008, the right panel is that of in 2014.
Land cover and soil data
The land use/cover dataset utilized in this study is derived from high-resolution 30 m LANDSAT satellite imagery (https://data-starcloud.pcl.ac.cn/iearthdata/), refined by the expertise of Tsinghua University (Fig. 14). To harmonize with the study’s requirements, the original data is resampled to a 5 km × 5 km resolution, which optimizes it for the analytical scale of the research. The land use/cover data is meticulously classified into distinct categories to facilitate comprehensive analysis. These categories include bare land, water bodies, forests, grasslands, croplands, and snow/ice. Each of these categories is allocated a proportion (Table 1), with the data indicating that in the Qinghai-Tibet Plateau region, bare land and grasslands constitute the predominant land cover types. Together, they account for 48.7% of the region’s total land area, reflecting the plateau’s characteristic landscape. Furthermore, the aggregated vegetation cover, encompassing forests, grasslands, and croplands, represents 23.81% of the area. This statistic underscores the significant role of vegetation in the ecological functions and environmental health of the Qinghai-Tibet Plateau.

The red pentagram represents the position of A’rou Flux site.
The LPJ model necessitates detailed datasets that capture the intricacies of soil properties, including texture and organic matter content. Soil texture is pivotal as it influences numerous soil characteristics and is categorized into various types, each with its own set of parameters for the model. The LPJ-DGVM takes a comprehensive approach by classifying soil textures into 13 distinct types. This classification is grounded in the global soil texture map at a 1° resolution28. The recognized soil texture types include Heavy-clay, silty-clay, clay, silty-clay loam, clay loam, silt, silt loam, sandy clay, loam, sandy clay loam, sandy loam, loamy sand, and sand. These classifications enable the LPJ-DGVM to accurately simulate soil behavior and its interaction with vegetation across diverse landscapes.
In the context of the Qinghai-Tibet Plateau, the distribution map of soil organic matter content reveals a predominantly narrow range, with most areas exhibiting soil organic matter content between 1% and 2%. This insight is vital for calibrating the LPJ model parameters specific to soil characteristics within the study area. The accurate representation of soil properties is crucial for the model’s ability to simulate key ecological processes such as plant growth, carbon sequestration, nutrient cycling, and overall ecosystem dynamics.
Validation data
The eddy covariance data collected at the A’rou Station spans the years 2013 and 2014, providing valuable insights into the atmospheric fluxes during this period. A 2-h gap in the data on July 14th was encountered, and this interval has been deftly filled using linear interpolation to maintain the integrity of the dataset. It is important to note that certain correction algorithms for eddy covariance data may not be executed during the digitization phase, underscoring the necessity for subsequent data post-processing. The standard workflow for processing eddy covariance data is outlined in the following section. This process is designed to address and rectify various data anomalies that may arise from environmental interference. Outliers, which can significantly skew variance and covariance values, often result from environmental factors such as rain, snow, dust particles, or sudden power interruptions affecting the sensor’s acoustic path.
The protocol for outlier removal involves several steps. Initially, it includes filtering out observations recorded during abnormal data acquisition conditions, as indicated by diagnostic values from the data logger. This is followed by the elimination of observations that fall outside the theoretical maximum ranges for parameters like wind speed, CO2 density, and water vapor density. Subsequently, outliers are identified using the Δx ≥ n σΔ formula, where x denotes parameters such as wind speed, CO2, and water vapor density. In this formula, Δx represents the difference between consecutive observations of the same parameter over time, σΔx is the root mean square of these differences calculated over a specific period, and n is a natural number, commonly set at n = 4. Outliers are then replaced with values derived from linear interpolation to ensure the continuity and reliability of the dataset.
This meticulous processing workflow is crucial for ensuring the accuracy and quality of the eddy covariance data, which is essential for understanding the complex interactions between the atmosphere and the biosphere. The process of coordinate rotation is a critical step in aligning the ultrasonic anemometer’s coordinate system with the natural coordinate system, which is based on the average wind speed components over a specified period. This alignment is essential for fulfilling the assumptions inherent in turbulence correlation analysis. The rotation procedure is as follows: Initially, the w-axis (vertical axis) is kept constant, while the u and v axes (horizontal axes) are adjusted. The u-axis is realigned to coincide with the average wind direction, effectively nullifying the v-axis’s average wind speed to zero. Subsequently, with the v-axis held steady, the u and w axes undergo a rotation that results in the w-axis recording an average wind speed of zero. Momentum flux measurements are particularly sensitive to these coordinate rotations, as they directly influence the accuracy of the flux estimates.
Due to a time lag in the measurement of gas density by the LI-7500 anemometer compared to the ultrasonic temperature readings, this discrepancy is addressed through a lag correction process. This correction ensures that the gas density measurements are synchronized with the temperature data, which is vital for accurate flux calculations.
The Web Processing Library (WPL) algorithm is employed to mitigate the effects of air density variations on the observed trace gas fluxes29. After implementing the WPL algorithm, 30-min data on latent heat and CO2 fluxes are derived. Negative values from the 30-min latent heat data are excluded, and the daily latent heat flux is computed through accumulation. This latent heat flux is subsequently transformed into estimates of evapotranspiration. For the 30-min CO2 flux data, a U* correction is initially applied, with a threshold value set at 0.1 m/s30. Following this, the daily CO2 flux data is aggregated. The entire turbulence data processing workflow is executed within the Edire software environment, ensuring methodological consistency and data integrity.
The processed turbulence data for the year 2013–2014 is presented in Fig. 15, showcasing the comprehensive analysis and the meticulous attention to detail that characterizes this study’s approach to understanding the atmospheric exchanges within the Qinghai-Tibet Plateau region.

The above panel shows the field observation data in 2013, the below panel is that of in 2014.
Overall technical process
By analyzing the distributional traits of the plateau’s vegetation and the original 10 plant functional types of the LPJ model, parameterization of the new functional types tailored to the unique ecological conditions of the Qinghai-Tibet Plateau is carried out to develop an LPJ-DGVM model suited for this high-altitude region. Driven by the latest time-series remote sensing data set, the model is further used to simulate and analyze the impact of climate change on the carbon and water fluxes (GPP, NEP) of the Plateau vegetation. The detailed technical workflow is shown in Fig. 16.

Including four parts: Input Data, Data assimilation and model improvement, Validaton analysis and Impact assessment.
The LPJ-DGVM model, an evolution of the BOIME model series, incorporates dynamic vegetation processes to capture the immediate responses of ecosystems to climate change29. The model’s primary inputs consist of atmospheric temperature, cloud radiation data, precipitation, and other meteorological variables, as well as soil texture and atmospheric CO2 content.
The output includes GPP, NPP, NEP, evaporation, transpiration, and the distribution of carbon and nitrogen in vegetation, litter, and soil organic matter. The LPJ-DGVM simulates 10 types of vegetation, including eight woody species and two herbaceous species. The time scales of the various modules in the LPJ-DGVM model are not consistent, with processes such as photosynthesis, water balance, leaf photosynthetically active radiation (PAR) ratio, sunshine duration, potential evapotranspiration, and soil temperature being on a daily or monthly scale. In contrast, soil texture, CO2 content, maintenance respiration, and photosynthate allocation are modeled on an annual scale. Therefore, the model’s temporal scale can be further improved through data-driven approaches.
LPJ-DGVM model and localization
The simulation of vegetation dynamics is a multifaceted endeavor that encompasses a range of physiological and ecological processes, which can be broadly categorized into four interconnected parts: the carbon cycle, water cycle, energy flow, and vegetation dynamics themselves. To enhance the precision of the model’s simulations, it is imperative to integrate these four dimensions holistically. The LPJ model considers the cycling of materials and the dynamics of vegetation in its framework. It achieves the simulation of populations on each simulation unit by meticulously modeling the physiological processes of average individuals on each unit. These physiological processes can be succinctly distilled into three principal modules: The Plant Photosynthetic Productivity Module, the Vegetation Hydrological Balance Processes Module, and Other Physiological and Ecological Processes Modules. The following sections provide a detailed introduction to the modules that have been refined and improved for the LPJ model, ensuring that the simulations are more accurate and reflective of the complex interactions within the ecosystem.
Vegetation photosynthetic productivity calculation and improvement of spatiotemporal resolution
The environmental factors that primarily affect photosynthesis and vegetation respiration include light, temperature, CO2 concentration, and water. The main purpose of the photosynthetic productivity module is to estimate the NPP of vegetation, which centrally involves simulating plant photosynthesis and plant respiration.
Photosynthesis models include empirical models that are based on the statistical relationship between vegetation productivity and climatic factors, process-based models that are derived from biological and physiological processes, and remote-sensing-driven models that estimate vegetation productivity through light energy utilization by using remote sensing data serving as the primary input. A typical process-based photosynthesis model is the Farquhar model31. The model posits that photosynthesis is mainly limited by PAR, the Rubisco enzyme, and CO2 concentration. It calculates the rate of photosynthesis under each of these constraints and adopts the minimum value as the actual rate of photosynthesis.
Given the capacity of remote sensing to capture surface information, and considering the high temporal resolution of numerous remote sensing satellites, many methods have been developed for estimating vegetation productivity through remote-sensing-driven models. The general form of such models is expressed as NPP = ξ * PAR * FPAR, where ξ represents the light energy conversion rate, which is a function of temperature, moisture, and CO2 concentration. PAR refers to photosynthetically active radiation, and FPAR denotes the absorption fraction of photosynthetically active radiation.
The photosynthesis model in LPJ-DGVM uses a model that seamlessly integrates light energy utilization with Farquhar, allowing the introduction of original daily high-temporal resolution data on environmental factors such as temperature, moisture, and CO2 concentration directly into the photosynthesis model through the Farquhar model. The model’s expression is as follows:
Where, ({A}_{nd})(g·cm−2·d−1) represents the daily photosynthesis rate, ({I}_{d}) represents the total photosynthetically active radiation absorbed per day, and (theta) is a constant. h represents the daylight duration, a is a constant, (alpha) represents the inherent quantum yield of CO2, ({f}_{{temp}}) represents the temperature inhibition function, Г* represents the CO2 compensation point: ({varGamma }_{ast }=frac{p{o}_{2}}{2tau }), (p{o}_{2}) represents the oxygen partial pressure, ({p}_{i}) represents the intercellular CO2 partial pressure: ({p}_{i}=lambda {p}_{a}), ({p}_{a}) represents the atmospheric CO2 partial pressure, (lambda) is a constant, τ、kc and ({k}_{o}) are dynamic parameters related to temperature32.
These parameters and functions are intricately linked and collectively determine the photosynthetic rate, which is fundamental to the calculation of the ecosystem’s carbon balance and productivity. In models for calculating vegetation NPP, respiration is generally simulated. NPP is calculated as the net difference between Gross Primary Production (GPP) and the total respiration (R), where NPP = GPP − R. Various models simulate respiration differently, with some establishing intricate relationships between total respiration and a suite of environmental factors.
The LPJ-DGVM model adopts a nuanced approach to simulate respiration by distinguishing between maintenance respiration and growth respiration. The LPJ-DGVM adopts a nuanced approach to simulate respiration by differentiating between two primary types: maintenance respiration and growth respiration. The basic idea is that the maintenance respiration of various plant tissues is influenced by phenological status, tissue temperature, and nitrogen content, as expressed in Eq. (2).
Conversely, the growth respiration of vegetation is derived directly through empirical relationships. The model allocates 25% of the remaining organic matter for growth respiration after the subtraction of maintenance respiration from GPP. Therefore, the NPP is computed using Eq. (3), which integrates the calculated values of GPP, maintenance respiration, and growth respiration. This comprehensive approach ensures that the NPP estimations are reflective of the dynamic interplay between photosynthesis, respiration, and other metabolic processes within the ecosystem.
Where, Rm represent the carbon consumption from maintenance respiration, while ({R}_{{leaf}})、({R}_{{root}}) and ({R}_{{sapwood}}) represent the carbon consumption from leaf, root, and sapwood respiration, respectively.
The original Fortran version of the LPJ-DGVM code is mainly divided into two parts: the core program encapsulated in LPJMAIN.F and the input-output interface program named LPJIO.F. The main program contains 22 specialized subroutines, while the input-output interface program contains 6 subroutines to manage data flow. The input data of the original code is monthly-resolved meteorological data, which is then interpolated to daily data using the daily function. To utilize daily-resolved meteorological data to drive the model, the LPJ-DGVM code has been refactored. The revised LPJ model can now produce parameters such as GPP, NPP, and NEP at daily resolution, thereby eliminating the need for interpolation and enhancing the temporal precision of the model’s inputs. At the same time, the spatial resolution of the model’s input data has been refined to a 5-km grid, and the control over soil and land use/cover data has been enhanced, improving the accuracy of the model’s simulation of surface cover. These enhancements are deliberate steps toward augmenting the model’s proficiency in conducting high-resolution simulations at the regional scale.
Vegetation Hydrological Balance Process Module and vegetation remote sensing data fusion
This specialized module within the LPJ-DGVM focuses on the water cycle processes specific to vegetation, including evaporation, transpiration, and interception of precipitation. It simulates how plants influence the local water balance by considering factors such as soil moisture content, plant water potential, and stomatal conductance. In the LPJ-DGVM model, the water cycle process simulation can be divided into a four-step process: (1) the computation of potential evapotranspiration, (2) the determination of actual evapotranspiration, (3) the estimation of soil moisture content, and (4) the quantification of runoff. From the standpoint of energy balance, the rate of evapotranspiration is intrinsically linked to temperature and net radiation. Leveraging this principle, the LPJ-DGVM employs Eq. (4) to estimate potential evapotranspiration.
In the equation, the numerator represents the rate of change of saturated vapor pressure with temperature, (gamma) represents the psychrometric constant, ({R}_{n}) represents the net radiation, ({rm{lambda }}) represents the latent heat of vaporization, and T is the temperature (°C).
Actual evapotranspiration is defined as the sum of vegetation transpiration and soil evaporation. The LPJ-DGVM considers various influential factors such as vegetation interception, soil moisture, and vegetation structure when calculating actual evapotranspiration. The calculation of vegetation interception uses the maximum water capacity of the vegetation canopy, ({S}_{I}), which is a function of LAI and precipitation.
Where, ({S}_{I}) represents the maximum water capacity of the vegetation canopy and is defined as a function of LAI and precipitation. i is the interception coefficient, which is related to the type and structure of the biome. ({{rm{f}}}_{v}) represents the vegetation coverage. LAI is the LAI.
In this study, the LAI used is replaced by the remote-sensed LAI to replace the fixed value in the original model to better match the actual changes. This substitution from a fixed value to a dynamic, satellite-based LAI dataset allows for a more accurate reflection of the actual variations in vegetation density and structure across different landscapes and temporal scales.
The vegetation transpiration is taken to be the smaller of the environmental water demand and the vegetation soil water supply, as expressed in Eq. (6):
Where, ({{rm{W}}}_{r}) is a coefficient calculated based on the soil moisture content in each layer and the distribution of vegetation roots. ({{rm{E}}}_{rm{max }}) is a coefficient given based on specific vegetation. ({{rm{alpha }}}_{m}) and ({{rm{g}}}_{m}) are two empirical coefficients that are given. ({{rm{g}}}_{{pot}}) is the optimal canopy conductance, which is calculated from the photosynthesis module. It is assumed that only the top 20 cm of soil has evaporation processes, and the calculation of soil evaporation is using Eq. (7), where ({{rm{W}}}_{r20}) is the relative soil moisture content of the top 20 cm layer. The total evapotranspiration is calculated.
In the LPJ-DGVM model, the soil is divided into two layers, and the changes in soil moisture content at different depths are calculated separately for the first and second layers through variables such as ({{rm{E}}}_{T}), ({{rm{E}}}_{s}), snowmelt, surface runoff, and groundwater runoff, as well as intercepted precipitation and soil infiltration.
The calculation of soil moisture content in the first and second layers is shown in Eq. (8), respectively.
Where, (p{r}_{t}) is the rainfall value after subtracting vegetation interception, M is the amount of snowmelt, ({beta }_{1}) is the proportion of water absorbed from the first layer of soil during vegetation transpiration, ({beta }_{2}) is the proportion of water absorbed from the second layer of soil during vegetation transpiration, ({beta }_{1}+{beta }_{2}=1). P1 and P2 is the infiltration amount of the first layer and the second layer, respectively. d1 and d2 are surface runoff and underground runoff.
If the calculated soil moisture content in the first layer exceeds the maximum soil moisture content of the first layer, the excess is considered as surface runoff. If the soil moisture content in the second layer exceeds the maximum soil moisture content of the second layer, the excess plus the soil water infiltration from the second layer is added as groundwater runoff.
The LPJ model has many intermediate variables, such as LAI, soil moisture, and soil temperature, which can be obtained directly through observations or calculated using other methods with higher precision. Data assimilation is an advanced technique that integrates new observation data into ongoing numerical simulations. This method considers the spatial and temporal distribution of data, as well as the potential errors in both the observational and background fields. By employing the data assimilation method to integrate direct observation data and remote sensing-derived data into the LPJ-DGVM, the accuracy of its simulation can be significantly improved. This paper uses MODIS-derived vegetation LAI to validate and optimize the LPJ model’s output LAI, iteratively refining the model’s algorithms. The data assimilation process in this paper employs the Ensemble Kalman Filter (EnKF) method, a widely recognized data assimilation algorithm particularly suited for nonlinear models. The EnKF method uses the Monte Carlo approach to solve the temporal process of probability density function during the simulation, which is composed of numerous model state ensembles. This probability density is composed of many model state collections, all of which are forward integrated over time from differential equations with random errors representing model uncertainties.
Other physiological and ecological process modules
Beyond the modules, the LPJ-DGVM also includes other physiological process modules. These include a module for simulating the allocation of photosynthetic products, a module for simulating the decomposition processes of litter and soil organic matter, a module for simulating vegetation death due to factors such as light competition and low growth efficiency, a module for simulating the generation of new individuals, and a module for simulating natural disturbances in ecosystems.
For herbaceous vegetation specifically, the allocation of photosynthetic products is simplified to occur primarily between leaves and roots. In the LPJ-DGVM, it is assumed that the decomposition rate of litter is 0.35 yr−1, the decomposition rate of rapidly decomposing soil organic matter is 0.03 yr−1, and the decomposition rate of slowly decomposing soil organic matter is 0.001 yr−1. Additionally, the LPJ-DGVM calculates the mortality of vegetation each simulated year and calculates the generation rate of new individuals each simulated year. The LPJ-DGVM also considers the impact of fire disturbances on ecosystems, which is generally believed to be primarily related to the amount of fuel and the moisture content of litter. Specific details will not be elaborated on here.
Parameterization of functional types of alpine vegetation (PFTs)
Due to the strong influence of the East Asian monsoon on our country, and the natural environment is relatively unique, the original model’s environmental limiting factors do not precisely capture the distribution of plant functional types in the Qinghai-Tibet Plateau. Based on in-depth analysis and synthesis of the vegetation distribution characteristics of the Qinghai-Tibet Plateau and the original 10 plant functional types of the LPJ model, and other studies33,34,35,36 of similar model parameterization schemes about Alpine Meadow Ecosystems, the new functional types have been developed and parameterized to better reflect the alpine vegetation distribution of the Qinghai-Tibet Plateau. New functional types, such as desert shrubs and cold-tolerant grass, have been introduced in adapting the model to the specific ecological conditions of the plateau (Table 2). Table 2 lists two added PFTs and their several physiological parameters in LPJ model. This customization has led to the establishment of an LPJ-DGVM model that is specifically tailored to simulate the alpine vegetation of the Qinghai-Tibet Plateau.


Responses