Increased early-season productivity drives earlier peak of vegetation photosynthesis across the Northern Hemisphere
Introduction
Climate change has caused seasonal shifts in vegetation dynamics in temperate and boreal regions, leading to an earlier start of the growing season (SOS) and enhanced early-season carbon uptake–the period from SOS to the peak of the growing season (POS)1,2. Although a considerable body of research has focused on changes in the early and late stages of the growing season, the POS is key to determine the maximum resource availability for plants3,4. Shifts in POS have far-reaching consequences for total ecosystem productivity, directly impacting variations in ecosystem structure and functioning5,6,7. Recent research highlights that the maximum daily photosynthesis at POS is a prominent determinant of annual productivity, explaining 78% of the interannual variability of vegetation productivity8,9. Yet, until now, the mechanisms underpinning changes in POS timing have received little attention. As a result, the extent and consequences of these shifts remain poorly understood due to a lack of comprehensive insights into the impacts of climatic and biotic factors on POS.
Climatic factors such as temperature, precipitation, and radiation have traditionally been considered as the primary drivers of POS timing, leading to the expectation that rising temperatures will further advance POS in the extratropical Northern Hemisphere3,10. However, vegetation growth in northern ecosystems is also subject to intrinsic developmental effects, where a plant’s current growth stage influences its subsequent development within the seasonal cycle11,12. Indeed, SOS has been shown to affect POS due to programmed apoptosis mechanisms of cells and leaf physiological constraints on longevity7,13,14, but these effects varied across spatial and temporal scales15. Various processes such as photosynthesis, tissue development, bud set, and leaf senescence, are intricately regulated by carbon source-sink dynamics16,17,18. Elevated photosynthesis (source activity) can potentially downregulate subsequent photosynthetic processes and trigger earlier leaf maturity and senescence19,20,21, likely through intrinsic developmental processes that balance source and sink activities16,22. This suggests that early-season productivity also plays a crucial role in governing POS timing23. However, the extent of these intrinsic developmental effects, and how they compare to environmental effects on POS timing, remains poorly understood.
POS timing is a consequence of a plant’s ecophysiological acclimation to a given set of environmental conditions, such as climate and soil moisture, and should reflect the optimal environmental conditions for growth and/or photosynthesis3,24. This suggests that shifts in POS are co-driven by both early-season conditions and subsequent environmental factors (hereafter referred to as late peak season conditions: the period from POS to the end of the POS, see “Methods” section). Previous research has mainly focused on the effects of early-season or total growing-season climate on POS10,25, ignoring late peak season conditions. For instance, increased peak season water and heat stress may alter plant growth26, thereby advancing POS timing. Thus, POS timing should be a consequence of ecophysiological acclimation of vegetation to late peak season conditions. However, little is known about the extent of these late peak season environmental effects, and how they compare to intrinsic developmental effects and early-season environmental effects on POS timing.
Our capacity to predict these effects is limited by an incomplete understanding of the mechanisms driving variations in POS, particularly due to the complex interactions with climate, soil moisture, and plant growth. Previous studies have reported that earlier SOS and rising early-season temperature enhance early-season productivity1,27, but did not test the effects of early-season productivity on POS. If increased productivity during the early growing season plays a vital role in regulating the POS through carbon source-sink dynamics19,23, the effects of SOS and early-season temperature on POS may be primarily driven by their indirect impact via early-season productivity. Moreover, earlier SOS, rising temperature, and enhanced productivity during the early growing season can also lead to peak season soil-water deficit28, which subsequently causes a decrease in summer productivity and an advance in POS timing23, suggesting a complex interplay between early-season factors and late peak season soil moisture in driving POS. However, we still lack a comprehensive understanding of the impacts of early-season carbon uptake and late-peak-season soil moisture on POS and how other factors modulate these patterns.
In this study, we explored the impacts of biotic and environmental factors (i.e., climate and soil moisture) on POS timing using comprehensive data across the Northern Hemisphere (>30°N). Specifically, we address two central research questions: (i) How does early-season productivity (from the SOS to the POS), compared to concurrent variations in SOS, and early- and late peak-season (from the POS to the end of the POS) environmental factors, impact POS timing? (ii) To what extent does late peak season soil moisture drive variations in POS? To explore these questions, we used four independent datasets, including satellite-based FluxSat GPP, VPM GPP, and contiguous solar-induced chlorophyll fluorescence (CSIF) data spanning the years 2000–2019, and carbon-flux data from 40 sites. We employed a range of analytical methods, including ridge correlation analysis, random forest algorithms, and structural equation models (SEMs). This allowed us to examine the direct and indirect effects of these factors on POS timing, thereby unraveling the complex interactions that drive POS variations.
Results
The drivers of the peak timing of the growing season
The observed satellite-derived FluxSat, VPM, and CSIF data from 2000 to 2019 revealed increases in early-season gross primary productivity (GPP) across more than 83% of the areas studied (Fig. 1A–C). These results were consistent with ground-sourced measurements from 40 carbon-flux sites (Fig. 1D). Both the SOS and POS advanced over recent decades, particularly in high-latitude regions (>50°N), such as boreal forests and shrubs. On average, SOS and POS advanced by 1.8 and 0.7 days per decade across the Northern Hemisphere, respectively, but these trends showed some variation across the four datasets, particularly in grassland (Fig. 1E–L). Early- and late peak-season temperatures increased by 0.4 and 0.2 °C per decade, respectively, while early-season soil moisture decreased across ~60% of the areas assessed (Figs. S1 and S2). Other factors, including early- and late peak-season radiation and precipitation, and late peak-season soil moisture, showed only little changes over the study period (Figs. S1 and S2).

A–L Temporal trends of early-season gross primary productivity (GPP, A–D), the start of the growing season (SOS, E–H), and the peak of the growing season (POS, I–L) over the study period. The black dots in (A–C), (E–G), and (I–K) indicate significant trends at P < 0.05. The right axis shows the average of each variable estimated by the ensemble mean at each latitude. The percentages of areas with a positive trend (P) and a negative trend (N) are shown for each variable, with significant percentages displayed in parentheses (P < 0.05).
Linear regression analyses revealed that increased early-season GPP led to an earlier POS in more than 95% of the areas studied (Fig. S3A–D). The SOS also had a pronounced effect on POS timing, with an earlier SOS leading to an earlier POS in 58–95% of the areas studied (Fig. S3E–H). Increases in early-season temperature and radiation led to an earlier POS in more than 70% of the areas studied (Figs. S3I–L, S4A–D), while increases in early-season precipitation and soil moisture led to delays in 66–87% of the areas studied (Fig. S4E–L). We found similar results for late peak season factors across all datasets (Figs. S3M–P, S5).
Ridge correlation analyses, removing potential multicollinearity between multi-variables, revealed the same results. Across all datasets, higher early-season GPP led to an earlier POS in over 93% of the areas studied, with mean ridge correlation coefficients ranging from −0.25 to −0.16 (Fig. 2A–D). In the FluxSat, VPM, and CSIF data, an earlier SOS advanced POS in more than 73% of the areas studied (Fig. 2E–G). By contrast, in the flux data, the effect of SOS on POS was less pronounced (Fig. 2H). Higher early-season temperature led to an earlier POS in more than 80% of the areas studied (Fig. 2I–L), while higher early- and late-peak-season soil moisture led to delays in 58–77% of the areas studied (Figs. 2M–P, S6I–L). Interestingly, early- and late-peak-season radiation and precipitation, and late-peak-season temperature had little effect on POS when controlling for SOS and early-season GPP (Figs. S6 and S7). For each dataset, we obtained similar results across vegetation types (i.e., evergreen-needleleaf forest, deciduous broadleaf forest, mixed forest, open shrubland, woody savanna, savanna, and grassland) (Figs. S8–S11).

A–P Ridge r between the peak of the growing season and early-season gross primary productivity (POS~GPP, A–D), POS and the start of the growing season (POS~SOS, E–H), POS and early growing season temperature (POS~EGS-Tem, I–L), and POS and late peak season soil moisture (POS~LPS-SM, M–P). The black dots in (A–C), (E–G), and (I–K) indicate significant correlations at P < 0.05. The right axis shows the average of each variable estimated by the ensemble mean at each latitude. The percentages of areas with positive ridge r (P) and negative ridge r (N) between POS and the corresponding variable are shown, with significant percentages displayed in parentheses (P < 0.05).
We then applied random forest models to determine the relative importance of each potential driver of POS. Again, we found that, across the four independent datasets, early-season GPP was the strongest driver of POS within each vegetation type and for all vegetation across the Northern Hemisphere (Figs. 3, S12–S14). Early-season temperature and SOS were the second and third most important factors driving POS (Figs. 3, S12–S14). These results collectively suggest that early-season vegetation activity, rather than SOS and environmental factors, is the main driver of POS timing.
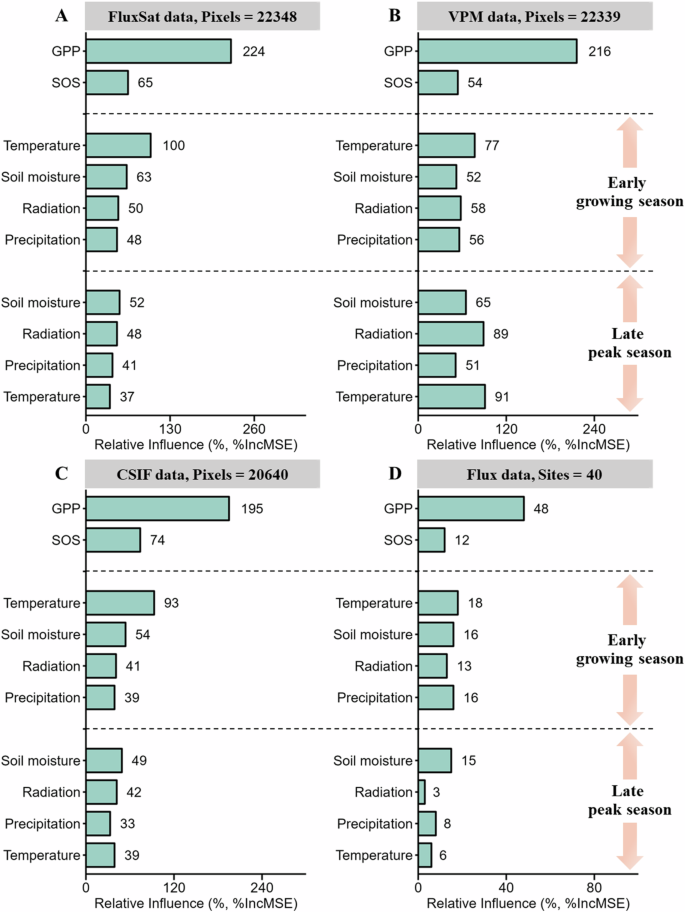
A–D Results for FluxSat data (A), VPM data (B), CSIF data (C), and Flux data (D). The importance value (%IncMSE) of each variable is shown in each bar, which was derived from random forest models. Biotic factors include early-season gross primary productivity (GPP) and the start of the growing season (SOS). Environmental factors include radiation, temperature, precipitation, and soil moisture during the early growing season and late peak season. Time-series data for each variable from each pixel/site of each dataset were standardized using Z-scores.
Direct and indirect drivers of the peak timing of the growing season
To further examine whether the effects of SOS and early-season environmental factors on POS are regulated by early-season GPP, we ran structural equation models (SEMs) to divide these effects into direct and indirect effects. The results showed that, across all datasets, advances in SOS and rising early-season temperatures significantly enhanced early-season GPP with absolute path coefficients >0.3. Early-season GPP was significantly correlated with POS timing, suggesting that changes in SOS and early-season temperatures indirectly regulate the POS via influencing early-season GPP (Fig. 4). Notably, these indirect effects represented more than 50% of the total effects (direct + indirect effects). Compared with GPP, the direct effects of SOS and early-season variables were consistently smaller. An earlier SOS showed small direct advancing effects on POS timing in the FluxSat, VPM, and CSIF data (Fig. 4A–C) and delayed POS timing in the flux data (Fig. 4D). Early-season temperature also had small direct effects on POS, with absolute path coefficients <0.14 in the VPM and flux data (Fig. 4B, D). This indicates that early-season GPP is a dominant driver of POS, and a distinct mediator of the effects of SOS and early-season temperature on POS. In contrast, early-season radiation, precipitation, and soil moisture had little influence on POS, showing neither direct nor indirect effects (Fig. 4).

A–D The results for FluxSat data (A), VPM data (B), CSIF data (C), and Flux data (D). Statistical parameters of the SEMs are shown for each SEM. The solid arrows in the SEMs indicate significant correlations with P < 0.05, while dotted arrows represent nonsignificant correlations with P > 0.05. The error bars in the histograms represent 95% confidence intervals. EGS and LPS represent the early growing season and late peak season, respectively. The indirect effects represent the effects of the SOS, EGS radiation (EGS-Rad), EGS temperature (EGS-Tem), EGS precipitation (EGS-Pre), and EGS soil moisture (EGS-SM) on POS via EGS gross primary productivity (GPP), and the effects of EGS factors, and LPS radiation (LPS-Rad), LPS temperature (LPS-Tem), and LPS precipitation (LPS-Pre) on POS via LPS soil moisture (LPS-SM), respectively. Time-series data for each variable from each pixel/site of each dataset were standardized using Z-scores.
We also applied SEMs to verify whether the shifts in POS are caused by soil-water deficit during the late peak season due to changes in early-season drivers. The results showed that, compared with the biotic and environmental factors during the early growing season, the effects of late peak season climate and soil moisture on POS were smaller. In the FluxSat, CSIF, and flux data, all late peak season variables did not affect or had small effects on POS, with absolute path coefficients <0.13 (Fig. 4A, C, D). Across all datasets, GPP, SOS, temperature, and radiation during the early growing season had little influence on late peak season soil moisture, with absolute path coefficients <0.09. These patterns were consistent across vegetation types (Figs. S15–S17). These results collectively show that early-season factors have small indirect effects on POS via late-peak-season soil moisture. Late peak-season variables have little influence on POS through either direct or indirect pathways. Overall, early-season GPP emerges as a key predictor of interannual variations in POS, with SEMs that include GPP being 40% more accurate compared to models omitting GPP (Figs. 4, S18).
Our findings remained consistent i) across different definitions of POS timing (i.e., mean POS from the start to the end of POS) (Figs. S19–S21), ii) across different early- and late peak-season periods of environmental variables across all datasets (Figs. S22–S24), and iii) when correlating the FluxSat-based early-season GPP against the CSIF-based POS using ridge correlation analysis, random forest models, and SEMs (Fig. S25). This underscores the critical role of early-season photosynthetic carbon uptake as a key driver of changes in POS. Moreover, we also found that an earlier POS induced a decrease in late-season GPP (from POS to end-of-season, Fig. S26, see “Methods” section).
Discussion
In this study, we demonstrate that the interactive effects of increased early-season GPP, advanced SOS, and rising early-season temperature, drive Northern Hemisphere-wide advances in POS timing. Recent studies have highlighted early-season temperature and SOS as the primary drivers of POS across the Northern Hemisphere10,15, but did not test the effects of early-season GPP and late-peak-season conditions, such as temperature and soil moisture. Here, we show that early-season GPP is the dominant driver of POS, with higher early-season productivity giving rise to early POS in more than 93% of the areas studied across the Northern Hemisphere. Late peak season factors had little effect on POS. Accounting for early-season GPP reduced the apparent impacts of SOS and climate on POS, indicating that the effects of these factors are likely to be indirect, by influencing early-season GPP.
The dominant role of early-season GPP on POS may be linked to intrinsic carbon source-sink balances. Plants use carbohydrates produced by photosynthesis (source activity) for developmental activities like tissue growth (sink activity), including cell division and reproduction19. The efficient functioning of these processes requires a balance between source and sink activities16,22. If early-season plant development is accelerated due to an earlier SOS and increased activity, this should lead to earlier maturation of growing cells18,22, and maximum photosynthetic activity will accordingly be reached earlier19,20. This shift may also induce feedback mechanisms that drive declines in late-season photosynthesis (Fig. S26)17. In contrast, a higher early-season GPP may exacerbate soil-water consumption during the early growing season and lead to water deficit28, potentially causing advances in POS timing. However, our analyses showed little effect of early-season water limitation on early-season GPP and POS variations (Figs. 3–4). We also tested whether changes in soil moisture during the early peak season (i.e., the period from the start of the POS to the POS) affect POS timing using variance partitioning analysis, and similarly found that soil moisture had little effect on POS (Fig. S27)10. The reason may be that if water deficit induces an immediate decrease in carbon uptake and an advance in POS timing, the effect of water deficit on POS should be more evident in late peak-season soil-water conditions because the POS has been advanced (Fig. 5A). Overall, our findings support the dominant role of early-season GPP on POS by revealing a strong and widespread negative correlation between early-season GPP and POS timing across various biomes in the Northern Hemisphere (Figs. 2A, 3).
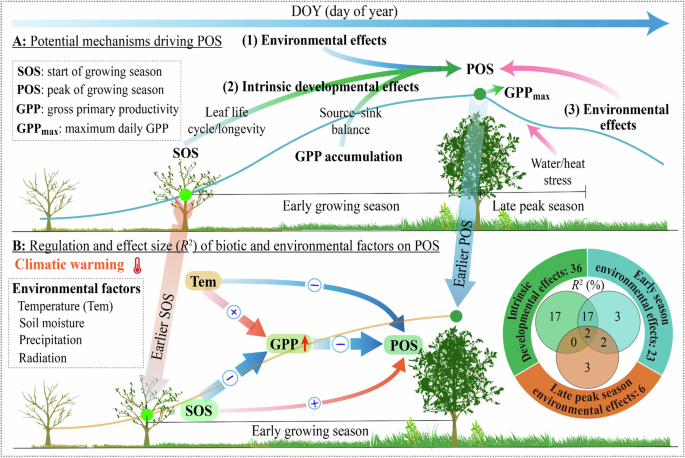
Potential mechanisms underpinning the changes in POS timing include (1) climate and soil moisture conditions during the early growing season (early-season environmental effects), (2) SOS and early-season GPP effects (intrinsic developmental effects), and (3) climate and soil moisture conditions during the late peak season (late peak season environmental effects), such as soil moisture deficit legacies from earlier in the season or heat stress due to climatic warming (A). Early-season GPP was the strongest driver of POS, with increased early-season GPP leading to earlier POS in more than 93% of the studied areas (Fig. 2A–D). SEMs and variation partitioning analysis indicate that intrinsic developmental effects (GPP and SOS) and early-season temperature, rather than late-peak-season environmental effects, drive the variations in POS timing (Figs. 4, S22). SOS and early-season temperature indirectly affected POS timing by influencing early-season GPP (B), suggesting that early-season plant activity controls POS timing through effects on plant source and sink dynamics.
The important role of SOS and temperature, with earlier SOS and rising temperatures enhancing early-season GPP and advancing POS (Fig. 4), highlights the link between climate and the plant seasonal cycle19,21. An earlier SOS can cause earlier tissue development and growth cessation (bud set) due to intrinsic self-regulation mechanisms in the life cycle of plants14,29, such as programmed apoptosis of cells and leaf physiological constraints on longevity13,14, ultimately leading to earlier downregulation of photosynthetic activity and advances in POS16,21. We also found that over 50% of the effects of SOS and early-season temperature on POS were of indirect nature by affecting early-season GPP, indicating that SOS and temperature largely drive POS through intrinsic developmental processes. These findings collectively indicate that early-season GPP is a key predictor of interannual variations in POS, and a key mediator of SOS and early-season temperature effects on POS (Figs. 4, S18, S28).
Unexpectedly, the indirect impacts of SOS, GPP, and temperature during the early growing season on POS via late peak season soil moisture were weaker than previously thought (Fig. 4)26,28, indicating that changes in these factors did not drive interannual variations in POS through inducing water deficit. This result is consistent with a recent study showing that soil moisture during the peak months (e.g., two consecutive months with maximum vegetation photosynthesis) is controlled predominantly by climatic factors rather than early-season productivity, and that soil moisture has limited impacts on productivity during the peak months11. This suggests that intrinsic developmental processes are key drivers of northern vegetation growth and the timing of POS10,11,15, and that temperature, rather than soil moisture, is a co-driver in regulating peak season carbon uptake10,30, with the mean maximum daily temperature (i.e., day-of-year = 202) occurring after the average POS date (i.e., day-of-year = 188) in the Northern Hemisphere3,4. Therefore, it is no surprise that the effects of SOS, GPP, and temperature during the early growing season on peak season moisture were not significant and small (Fig. S27), resulting in no significant effects of these factors on POS via late peak season soil moisture in our study (Fig. 4).
Interestingly, the remote sensing data showed that decreased soil moisture during the late peak season advanced the POS in grassland where water is often the dominant limiting factor, although this impact was weaker than that of SOS, GPP, and temperature during the early growing season (Fig. S17). In contrast, we also found that increased late peak season temperature delayed POS, diminishing the advancing effects of late peak season moisture on POS in grassland (Fig. S17). This indicates complex interaction effects among late peak season environmental factors on changes in POS timing. Overall, our results suggest that late peak season factors have little effect on interannual variations in POS, although there were some differences among datasets (Fig. S28). However, given the potential impacts of summer water and heat stress on vegetation growth28,30,31, the specific effects of each environmental factor during the late peak season on POS and their interaction effects need further exploration.
Our findings, derived from four independent datasets, suggest an important role of intrinsic developmental effects in regulating POS variations over recent decades across the Northern Hemisphere (Fig. 5A). This discovery provides a mechanistic explanation that unifies previous observations regarding the links between earlier SOS and rising temperatures and an earlier POS timing10,15. Earlier SOS and higher temperatures can lead to greater source and sink activities, which in turn affects the timing of POS through earlier maturation of cells and possibly earlier downregulation of photosynthesis (Fig. 5B)16. These findings hold substantial implications for our understanding of how biotic and climatic factors jointly influence the POS process and how these dynamics may shift in the future due to climate warming. The anticipated advances in SOS and rises in early-season temperatures32 will likely further accelerate early-season vegetation carbon uptake1,2,33. This suggests that the POS is likely to continue advancing as a result of enhanced early-season activity, inducing a decrease in late-season carbon uptake in the future (Fig. S26).
The strong control of POS timing by early-season vegetation activity has important implications for the functioning of Northern Hemisphere ecosystems. Variations in POS play a pivotal role in terrestrial carbon storage as they affect the cessation of seasonal activity and may compensate for stress-induced declines in late-season productivity1,20. These advances in early-season carbon uptake and POS have the potential to enhance resilience to late-season environmental disturbances, such as anomalous drought and heat events11. The changes in climate expected in the future, including warmer but more unpredictable springs that may elevate the risk of frost events34, will likely enhance interannual fluctuations in early-season photosynthesis and POS. These fluctuations can have direct implications for the synchrony of biotic interactions and the carbon cycle. Overall, our findings suggest that the ongoing increases in early-season productivity are likely to drive advances in the peak growing season under climate change, with direct consequences for the timing and functioning of these critical ecosystems.
While we demonstrate the dominant role of early-season GPP on POS timing across various Northern Hemisphere vegetation types using four independent datasets, certain limitations and uncertainties remain. Variation in the mechanisms driving interannual variations in POS timing may result in contrasting temporal trends of POS timing15. For example, in ~20% of the studied areas, particularly in savanna and grassland, temporal increases in early-season GPP coincided with delays in POS (Fig. 1) despite increased early-season GPP driving an earlier POS at the interannual scale (Figs. 2, S3). This discrepancy between the drivers of POS timing at the interannual scale and its long-term temporal trends presents challenges to the universality of our findings. Recent studies have similarly reported inconsistencies in the factors controlling plant development at the end of the growing season–differing between interannual variations20,21 and long-term trends35 in deciduous forests. This suggests that plasticity in vegetation growth may enable plants to optimize their functioning in a changing climate. Nevertheless, higher early-season GPP is expected to intensify water stress and nutrient (particularly nitrogen) deficits28,36,37, potentially causing long-term advances in the POS timing. While our analysis reveals little influence of late peak-season environmental factors on interannual variations in POS timing and provides a broad assessment across various vegetation types, uncertainties remain due to the complex interactions among late peak season environmental factors and the absence of comprehensive nutrient databases. Additionally, inconsistencies in POS trends derived from different data sources, particularly in savanna and grassland ecosystems, further limit the robustness of our conclusions. Therefore, further research is needed to explore the factors driving temporal trends in POS, and to verify whether enhanced early-season plant productivity exacerbates water stress and nutrient deficits28,36,37. This should be explored using combinations of satellite, carbon flux, and experimental data, particularly in regions where water and nutrient are key limiting factors.
Methods
Satellite observations
We used two gross primary production (GPP) datasets and one solar-induced chlorophyll fluorescence (SIF) dataset spanning the years 2000 to 2019 and encompassing northern ecosystems (>30°N) to explore the impacts of biotic and environmental factors on POS timing. GPP data came from the global modis and fluxnet-derived gross primary production data (FluxSat, V2.0)38, and a vegetation-level photosynthesis model (VPM, V2.0), including an improved light-use efficiency function39. The SIF data came from the contiguous solar-induced chlorophyll fluorescence (CSIF) dataset40. The FluxSat data is an empirical GPP product with a daily temporal and 0.05° spatial resolution (https://daac.ornl.gov/VEGETATION/guides/FluxSat_GPP_FPAR.html), which upscales global eddy covariance GPP estimates with a neural network based on MODIS multispectral surface reflectance and top-of-atmosphere radiation38. The VPM data has 8-day temporal and 0.05° spatial resolution (https://data.tpdc.ac.cn/en/data/582663f5-3be7-4f26-bc45-b56a3c4fc3b7/), and includes an enhanced light-use efficiency theory utilizing satellite data from MODIS and climate data from NCEP Reanalysis II39. It also incorporates an advanced vegetation index gap-filling and smoothing algorithm, along with distinct considerations of C3/C4 photosynthesis pathways. The CSIF data has a 4-day temporal and 0.05° spatial resolution (https://osf.io/8xqy6/), derived from machine learning techniques applied to raw Orbiting Carbon Observatory 2 (OCO-2) SIF data, utilizing predictor variables from MODIS surface reflectance data40. The CSIF dataset provides a more direct representation of photosynthetic activities and has demonstrated high consistency with estimates of GPP obtained through eddy covariance measurements41. The time-series of daily GPP from FluxSat data were averaged at 8-day intervals to match the temporal resolution of the VPM GPP data for subsequent analyses.
We focused on natural vegetation by excluding pixels corresponding to water bodies, cropland, urban and built-up areas, mosaics of cropland and natural vegetation, permanent snow and ice, barren land, and unclassified pixels. These classifications were based on the International Geosphere-Biosphere Programme (IGBP) classification derived from the MODIS land-cover map as part of the MCD12C1 Version 6 data product (https://doi.org/10.5067/MODIS/MCD12C1.006)42. The spatial resolution of all datasets was aggregated to 0.1° using the mean method to match the climatic dataset. The FluxSat GPP, VPM GPP, and CSIF datasets were filtered by excluding pixels that did not contain natural or unchanged vegetation during 2001–2019 from the MCD12C1 data product (Fig. S29). We also excluded pixels with mean GPP/CSIF values from July to August that were less than 1.2 times the mean GPP/SIF values from December to February43. Additionally, we omitted pixels in which GPP/SIF was highest between October and April each year4.
Ground observations
To validate our findings based on satellite-based observations, we employed carbon-flux measurements from AmeriFlux (https://ameriflux.lbl.gov), ICOS/European Flux (https://data.icos-cp.eu), and FLUXNET2015 datasets (https://fluxnet.org/data/download-data/)44. The carbon-flux measurements from AmeriFlux and ICOS/European Flux datasets are updated FLUXNET2015-compatible datasets by AmeriFlux and ICOS teams. Specifically, we selected daily GPPs derived from the nighttime partitioning method with variable USTAR thresholds, labeled as GPP_NT_VUT_REF45. We included a total of 40 carbon-flux sites with 552 site-year records based on the following criteria: (1) the sites were located in the Northern Hemisphere (>30°N), and the observations included more than 300 daily records per year between 1997 and 2019, (2) the data for each site were of high quality with a quality-control tag exceeding 0.8 for each year, (3) the sites had a minimum of eight years of available data, (4) the sites were situated in natural ecosystems with pronounced seasonality in vegetation growth, featuring only one growing season per year. The vegetation at these sites was classified into four functional types according to the IGBP classification: 16 sites of evergreen-needleleaf forest (ENF) (221 site-years), 12 sites of deciduous broadleaf forest (DBF) (167 site-years), 4 sites of mixed forest (MF) (65 site-years), and 8 sites of grassland (GRA) (99 site-years). For further details about each site, please refer to Table S1 and Fig. S29.
Metric extraction
For satellite-based phenology and GPP, we reconstructed the time-series of GPP and CSIF to reduce the potential noises using daily mean temperature data from the ERA5-land dataset and various fitting methods. Specifically, for a given pixel, we defined that no phenological events occurred before the daily mean air temperature was above 0 °C for 5 consecutive days from the autumn to the spring of the next year as dormancy period46. The GPP/SIF values during the dormancy period in year i were replaced by the average of five maximum GPP/SIF values for two consecutive dormancy periods (the second half of year i − 1, year i and the first half of year i + 1)47. Finally, we fitted the time-series of GPP and CSIF using three common methods: HANTS, Savitzky-Golay, and Spline48,49. The combination of these three methods was used to reduce uncertainty and bias associated with any individual method.
We estimated the start of the growing season (SOS) date using the relative-threshold method50. The choice of the relative-threshold method did not affect the interannual variability of vegetation phenology27. SOS for each year and pixel was defined as the date when GPP/CSIF reached 20% of the annual amplitude of the fitted curve33,51, and the peak of the growing season (POS) was identified as the date when GPP/CSIF reached their highest values in the fitted seasonal curve4. We also determined the start and end date of the POS for each year and pixel when GPP/CSIF corresponds to a 90% increase (POSSOS90) and a 10% (POSEOS90) decrease in the fitted curve, respectively33,51. Early growing season (EGS) was calculated as the interval between mean SOS and mean POS. Compared to seasonal descriptions based on temperature thresholds1 or fixed months28, the definition of the EGS utilizing the actual phenological seasonality is more suitable for analyzing the effects of plant growth stage (carryover effects) and climate (climatic effects) during EGS on its subsequent development (i.e., POS) within the seasonal cycle. Similarly, we defined late peak season (LPS) as the interval between mean POS and mean POSEOS90, since the responses of vegetation carbon uptake to water/heat stress are fast and direct26, and the changes in plant’s developmental process during this period can potentially change the POS timing. The early-season GPP for each year and pixel was calculated as the sum of daily GPP and CSIF values during the EGS in the fitted seasonal curve. Finally, all variables were extracted or calculated from each fitted curve, and the variables from the three fitted methods were averaged to minimize uncertainties and bias linked to any single curve-fitting algorithm.
For ground-based phenology and GPP, we used three different models (Spline, Gu, and Klosterman) to fit the seasonal curves of GPP, which helped identify seasonal patterns and mitigate the influence of outliers. Similar to the satellite-based approach, SOS was determined when the GPP value reached 20% of the annual amplitude of the fitted curve43. The date when the maximum value occurred in the fitted seasonal curves was designated as the POS, and the start and end date of the POS corresponds to a 90% increase and a 10% decrease in the fitted curve, respectively. Early growing season and late peak season were calculated as the interval between mean SOS and mean POS and between mean POS and mean POSEOS90, respectively. Early-season GPP was then computed as the sum of daily GPP values between mean SOS and mean POS in the fitting curves. All variables were extracted or calculated from each fitted curve, and the variables from the three fitted methods were averaged to minimize uncertainties and bias associated with any single curve-fitting algorithm.
For climatic data, we obtained gridded information for shortwave radiation (Rad), temperature (Tem), precipitation (Pre), and soil moisture (SM) at hourly intervals from 2000 to 2019 with a spatial resolution of 0.1 × 0.1° for northern ecosystems from the ERA5-land dataset (https://cds.climate.copernicus.eu/cdsapp#!/dataset/reanalysis-era5-land?tab=overview). We used the variables “surface solar radiation downwards”, “temperature at 2 m”, “total precipitation”, and “volumetric soil-water layers 1 and 2” (0–28 cm). We converted hourly Rad, Tem, Pre, and SM to daily averages, respectively. For ground-based flux sites, we extracted daily SM from the ERA5-land dataset due to the absence of data for some flux sites in the AmeriFlux, ICOS/European Flux, and FLUXNET2015 datasets. The total Rad, mean Tem, total Pre, and mean SM during the early growing season and late peak season for each pixel/site were extracted, respectively.
Statistical analyses
Data were analyzed using MATLAB (R2022b, https://www.mathworks.com/products/matlab.html) and R version 4.2.3 (The R Project for Statistical Computing, https://www.r-project.org/). All outliers exceeding ±3 standard deviations of the multi-year mean for each variable were removed52, and all variables of the GPP and CSIF data were aggregated to 0.5 × 0.5° spatial resolution by calculating the mean. To explore the temporal changes in POS and its potential drivers, we calculated the temporal trends and significant levels (P < 0.05) of each variable over the study period using the Theil–Sen nonparametric slope estimator and a nonparametric Mann–Kendall test in MATLAB53. Two methods were widely used for trend analysis of time-series data because the slope estimator is not affected by outliers and the Mann–Kendall method allows missing values and any distributions of the data15. We also calculated each variable sensitivity of POS and significant levels (P < 0.05) using the corrcoef function of MATLAB for each pixel/site based on the specific correlation between POS and each variable.
To investigate how potential drivers affect POS and avoid potential multicollinearity between multi-variables, we applied ridge regression analysis that adds a penalty parameter to test the correlation between POS and each variable with the ridge package in R54. Specifically, the response variable was the POS, the predictors were the SOS, early-season GPP, and radiation, temperature, precipitation, and soil moisture during the early growing season and late peak season. We used normalized anomalies of each variable as model inputs when calculating the ridge regression coefficients. We further estimated the relative importance of each variable on POS for all data of each dataset using the randomForest R package. Importance values were determined by using the mean decrease in accuracy in mean square error (%IncMSE). The higher the %IncMSE value, the more important the influence of the variable on POS. The time-series data for each variable from each pixel/site of each dataset were standardized before the analysis using Z-scores to exclude spatial differences. The number of trees and variables randomly sampled as candidates at each split were set to 1000 and 4, respectively12. We also calculated the respective effect sizes (R2) of early-season environmental effects (early-season Tem, SM, Rad, and Pre), intrinsic developmental effects (SOS and early-season GPP), and late peak-season environmental effects (late-peak-season Tem, SM, Rad, and Pre) on the POS based on variation partitioning analysis of the Vegan package in R.
To further test whether the effects of SOS and early-season environmental factors on POS are caused by early-season GPP and whether the effects of early-season factors and late-peak-season climatic factors on POS are caused by late-peak-season soil moisture, we ran SEMs to distinguish between direct and indirect effects55 using the piecewiseSEM R package56. The time-series data for each variable from each pixel/site of each dataset were standardized before the analysis using Z-scores. The global goodness-of-fit of the SEMs was assessed using Fisher’s C. A nonsignificant Fisher’s C (P > 0.05) indicates that the model fits the data well56. The direct and indirect effects were estimated using the semEff R package (https://murphymv.github.io/semEff/), and the standardized effect sizes and confidence intervals were calculated by bootstrapping 10,000 times. Given the large sample size of more than 400,000 site-year combinations in the GPP and CSIF data, we estimated the SEM paths, and the direct and indirect effects using a stratified random sampling method to efficiently and accurately test the effects of drivers on POS. Specifically, for data with >8000 site-year combinations, we randomly sampled ~6000 site-year combinations and sampled 50 times based on the stratification of vegetation types with a fixed sampling proportion using the strata function (srswor method) of the sampling R package. The final SEM paths and the direct and indirect effects were then calculated by averaging the values from the 50 samplings. This procedure allowed us to estimate the direct effects of each driver on POS, and to calculate the indirect effects on POS via GPP and late peak season soil moisture. We also calculated the SEMs that did not contain the GPP variable to compare the importance of GPP on POS in improving the model accuracy.
To validate our findings from the above analyses, we also determined the mean POS date (POSMPOS) from the start (POSSOS90) to the end (POSEOS90) of the POS in GPP and CSIF data. We thus calculated the GPP, climatic factors, and soil moisture during the early growing season or late peak season, and tested the factors driving variations in POSMPOS timing using ridge correlation analysis, random forest models, and SEMs (Figs. S19–S21). Moreover, as the POS is more affected by early- and late peak-season climate and soil moisture, and the early- and late peak-season lengths differ among pixels and sites57, we thus calculated the optimal length of early- and late peak-season for each variable of each pixel/site based on partial correlation analysis with ppcor package (spearman method) in R. Specifically, the optimal length of early-season factor (e.g., radiation) was determined as the period preceding the multi-year average of POS (in steps of 1 month) when the largest partial correlation coefficient occurred after eliminating the influence of other early-season factors (e.g., temperature, precipitation, and soil moisture) over the same period and SOS and GPP. Then, the optimal length of the late peak season factor was determined as the period following the multi-year average of POS (in steps of 10 days) when the largest partial correlation coefficient occurred after eliminating the influence of other early- and late peak-season factors over the same period. We set the early- and late peak-season periods as the maximum range for the optimal length of the early- and late peak season, respectively. We tested these factors driving variations in POS timing using ridge correlation analysis, random forest models, and SEMs (Figs. S22–S24).
We also tested the effects of FluxSat-based early-season GPP on the CSIF-based POS across the Northern Hemisphere (Fig. S25). These results support our findings that early-season photosynthesis is the primary determinant of POS timing. We further tested the effects of POS on late-season carbon uptake (from mean POS to mean end-of-season) for FluxSat and Flux data using ridge regression analysis and random forest models. The end-of-season corresponds to an 80% decrease in FluxSat/Flux data43. The late-season climatic factors include radiation, temperature and precipitation, and soil moisture, which were calculated as the mean values between mean POS to mean end-of-season. We found that the advancement of the POS induced a decrease in late-season carbon uptake (Fig. S26).
Reporting summary
Further information on research design is available in the Nature Portfolio Reporting Summary linked to this article.
Responses