Increasing individual-level climate mitigation action: the role of behavioral dimensions and inequality perceptions

Introduction
Many scientists consider climate change the biggest environmental problem of our time, requiring vast political and industrial transformations (Cook et al. 2016; Rockström et al. 2017). Moreover, scholars have argued that although the weight of individual behavior depends on how the origin of carbon emissions is calculated, the impact of household consumption on carbon emissions is not to be neglected (Hertwich and Peters, 2009). This makes the lifestyle decisions of individuals an important component of reduction efforts, especially in developed countries (Dietz et al. 2009; Moran et al. 2018; van de Ven et al. 2018).
It thus comes as no surprise that climate-focused research in many disciplines has been striving to understand how to influence individual green behavior. An important strand of this literature is psychological studies centering on behavioral change through interventions. These can be rather simple tools, like informational campaigns and appeals, but also more complex measures, such as financial incentives and forms of social comparison. The targeted individual behaviors are numerous: examples include recycling, littering, energy consumption, and mobility behavior (Maki et al. 2019; Liebe et al. 2021; Whitmarsh et al. 2021; Bernard et al. 2022; van Valkengoed et al. 2022; Bergquist et al. 2023). However, it has been pointed out that not all of these actions have the same (high) impact on carbon emissions, and some researchers call for more specific studies focusing primarily on behavior with high emission reduction potential (e.g. Wynes et al. 2018; Nielsen et al. 2021; Whitmarsh et al. 2021).
Relatedly, another strand of recent climate research has been assessing the carbon emissions tied to different individual behaviors and calculating which of these dimensions have the highest emission reduction potential (Wynes and Nicholas, 2017; Lacroix, 2018; Ivanova et al. 2020). These analyses come to very similar results: individual behavior with a high impact on emissions can be mostly found in the dimensions of mobility (e.g. using the car less, less air travel), diet (vegetarian or vegan), and household energy use (e.g. shifting to green energy, reducing energy consumption).
Unfortunately, comparing the effectiveness of interventions also shows that precisely these dimensions are among the hardest to influence (Bergquist et al. 2023)—even when concern about climate change is generally prevalent (Huang and Warnier, 2019; Rüttenauer, 2023). One explanation for this could be the low-cost hypothesis, which postulates that the effect of such concerns on actual behavior decreases with increasing costs of the behavior (e.g. in terms of time, money, or other resources (Diekmann and Preisendörfer, 2003; Keuschnigg and Kratz, 2017; Thiel, 2020)). Especially for mobility decisions, it can be argued that these costs can be quite high: switching to public transport can lead to a longer commute, especially in rural areas, and traveling by train to a destination often takes much longer than by plane. However, this attitude-behavior gap has also been found for less costly lifestyle dimensions (Hornsey et al. 2016; Büchs et al. 2018; Jacobs et al. 2018; Huang and Warnier, 2019; Dechezleprêtre et al. 2022) and researchers have identified many further barriers to behavioral change.
Undoubtedly, climate concerns and pro-environmental attitudes have been identified as prerequisites to the decision to act climate-friendly in many cases (Tobler et al. 2012; Bradley et al. 2020; van Valkengoed et al. 2022). However, their influence is altered through a variety of other factors: In addition to the already mentioned individual cost-benefit calculations, researchers have found effects originating from social norms, climate knowledge, skepticism, and/or habits (Steg and Vlek, 2009; Gadenne et al. 2011; Nyborg et al. 2016; Shi et al. 2016; Bruderer Enzler et al. 2019; Mayerl and Best, 2019; Bouman et al. 2020; Bradley et al. 2020; Graves and Roelich, 2021; van Valkengoed et al. 2022). Moreover, another branch of literature closely related to sustainability research has argued for the importance of self- and group-efficacy (Homburg and Stolberg, 2006; van Zomeren et al. 2010; Lee et al. 2014; Doherty and Webler, 2016; Hanss et al. 2016; Huang, 2016; van Valkengoed et al. 2022). Roughly summarized, the general assumption here is that individuals’ probability to act environmentally or climate-friendly is tied to their perception of whether their own behavior can have an actual effect on the environment or climate change mitigation (self-efficacy) and whether humanity as a whole will be able to achieve the corresponding goals (group-efficacy). If they feel like their behavior has no effect in the grand scheme of things, or that humanity will not be able to significantly mitigate climate change, their motivation to act in a climate-friendly manner drops.
Overall, the research highlights that behavior is inert and hard to influence, even when individuals are aware of the issues and the need for action. Nevertheless, it is important to recognize that many people are just inherently opposed to change. This is also relevant for the political dimension since we currently observe backlash against climate mitigation policies in many countries—due to the worry of rising costs but also because citizens are concerned about changes in their lifestyles. The most commonly proposed policy is carbon taxation, since it is seen as a highly cost-efficient way of combating climate change (OECD, 2013). However, a general tax as such neglects the fact that public support might be higher for behavioral changes in some dimensions than others. Other authors have already pointed out the potential of creating policy bundles of highly accepted measures and identifying those in need of more effective explanation due to their low acceptance (Jenny and Betsch, 2022) and combining broad carbon taxation with more targeted nudging approaches for specific behaviors (Gravert and Shreedhar, 2022). Recognizing more (less) popular aspects may aid in the design of more fitted climate mitigation schemes with higher approval rates, which are essential for policy support and for its subsequent successful implementation (Franzen and Meyer, 2004; Tjernström and Tietenberg, 2008; Anderson et al. 2017; Schaffer et al. 2022). Identifying in which lifestyle dimensions with high emission reduction potential we can find the highest willingness to change behaviors is therefore crucial for climate change mitigation, as it not only facilitates habit transformation but also provides vital insights for political-scale transformations. This leads us to our first research question:
(1) In which lifestyle dimensions with high emission reduction potential are respondents most willing to change to more climate-friendly behavior?
Climate change and inequality perceptions
Delving deeper into the factors that can influence individuals’ climate mitigation behaviors, we want to study another potential determinant closely aligned with political science literature: perceptions of inequality. Research on the factors underpinning public support for carbon tax policies has consistently highlighted the significance of fairness perceptions of citizens (Povitkina et al. 2021; Bergquist et al. 2022). Concerns center around the distributional consequences of such policies, particularly regarding their potential to create disproportionate burdens for socioeconomically disadvantaged groups. While these worries can undoubtedly be driven by egotropic concerns and personal loss aversion (Armingeon and Bürgisser, 2021), the findings indicate that it is not just self-interest but also a broader sense of fairness and equality in society driving people’s opinions (Gampfer, 2014; Maestre-Andrés et al. 2019).
However, while this topic relates to redistributive (in)equality, there are many other aspects of inequality connected to climate change: Socioeconomically disadvantaged households will generally be more burdened by higher temperatures and the accompanying changes like food prices or the costs associated with increasing occurrences of natural disasters (Hallegatte and Rozenberg, 2017) while producing fewer emissions themselves (Gough, 2013). This dynamic can also be found at the country level, with wealthier nations being responsible for the lion’s share of CO2 emissions (so far), while being less exposed to the immediate consequences of global warming (Jorgenson and Clark, 2011; Harrington et al. 2016; Oxfam, 2020; Taconet et al. 2020; Ogunbode, 2022). Furthermore, movements like Fridays for Future and similar groups recently brought another aspect of inequality in climate change to light: postponing climate mitigation now leads to increased expenses for addressing climate change in the future, further disadvantaging the already burdened future generations (Gardiner, 2006; Giugni and Grasso, 2021).
These examples show how climate change is connected to many different aspects of inequality, which can also have an effect on people’s climate mitigation preferences through their fairness perceptions or moral concerns (Doran et al. 2019; Pearson et al. 2021). Since such evaluations play a crucial role in shaping individuals’ support for climate policies, it seems intriguing to examine whether perceptions of inequality in climate change might extend their influence to the private sphere as well, and impact individuals’ readiness to act climate-friendly. Making citizens aware of such inequalities could activate moral values and social norms, which have been suggested as potential drivers of behavioral change toward a climate-friendly future (Rees et al. 2015; Nyborg et al. 2016; Otto et al. 2020).
We are therefore choosing the before-mentioned examples of economic, global, and generational inequality in climate change and examine their influence on respondents’ willingness to change their own behavior. In doing so, we can bridge two crucial threads of climate mitigation research, contributing to our understanding of the factors individuals take into account when making political versus private decisions. Moreover, since we are including three different aspects of inequality in climate change, we can differentiate between them, yielding valuable insights into which frames can effectively drive the essential changes required for climate mitigation. Our second research question therefore is:
(2) Are people influenced by inequality perceptions when it comes to their own behavior?
Current study
To answer our research questions, we fielded a factorial survey experiment with a representative sample of the German population (see the “Methods” section). Our study was conducted in Germany since it is one of the most influential countries in the EU concerning climate change policies (Knill, 2003; Plehwe, 2022). Furthermore, it is one of the countries with the highest CO2 emissions in total (Climate Watch, 2023) and has an active public debate about climate mitigation measurements: movements such as Fridays for Future or the Last Generation are widely known to the public and—following the federal election in 2021—the Green party is part of the coalition government. However, the backlash against climate policies or climate-friendly lifestyle change and doubts about how to achieve this transformation are prevalent in Germany, too (Quitzow et al. 2016; Tschötschel et al. 2020). Thus, the country is well suited as an example for many other nations currently struggling with reaching their transformative goals to lower carbon emissions.
Moreover, choosing the German population as our research focus opens up the possibility to further distinguish between the three types of inequality in climate change: since we will have respondents from all age groups and various economic backgrounds, we will likely have participants classifying themselves as negatively as well as participants identifying as positively affected by generational and economic inequality. However, none of our respondents should be able to count themselves as negatively affected by global inequality in climate change, which allows us to analyze whether there are any differences in the effect of our primes between these more and less affected subgroups and across inequality types.
We contribute to the existing body of knowledge on climate mitigation by identifying lifestyle dimensions with higher acceptance rates of behavioral changes, and by examining the impact of perceptions of different types of inequality, therefore combining several strands of literature. This insight provides valuable knowledge, not only for future research but also for policymakers and various stakeholder groups.
By using a factorial survey experiment, we reduce potential social desirability bias in our respondents’ answers due to the salience of climate mitigation topics in the public debate (Atzmüller and Steiner, 2010; Auspurg et al. 2015). This is an advantage over traditional survey questions on climate-friendly behavior.
Moreover, we choose only lifestyle dimensions covering the most relevant domains for high individual emission reduction potential—diet, energy use, and mobility—as identified by the literature (Wynes and Nicholas, 2017; Lacroix, 2018; Ivanova et al. 2020).
Methods
Our analyses are based on a survey experiment fielded in Germany. Data collection took place in July 2022, using an online access panel. The sample is representative of the adult (18 years or older) German population across gender, age, federal state, and education. We use a factorial survey experiment (Auspurg and Hinz, 2015) to examine those lifestyle dimensions in which our respondents are most likely to adapt their behavior. Each respondent is asked to subsequently rate three vignettes describing hypothetical lifestyles (see Appendix F for a vignette example). We vary the climate-friendliness of the lifestyles within seven dimensions that cover the most relevant domains for individual emission reduction in diet, energy use, and mobility as identified by the literature (Wynes and Nicholas, 2017; Lacroix, 2018; Ivanova et al. 2020). Table 1 shows an overview of all varied dimensionsFootnote 1, resulting in a universe of 1620 possible combinations. We use a D-efficient design (Auspurg and Hinz, 2015), which allows for maximum statistical power while at the same time utilizing a subset of only 180 vignettes that are then assigned randomly to respondents. By design, respondents are encouraged to weigh the dimensions describing the lifestyles they are confronted with to produce their general rating of the vignette. This is an important advantage of this approach over direct questioning, which might lead to biased results due to social desirability and the salience of our topic in public debates (Atzmüller and Steiner, 2010; Auspurg et al. 2015).
Our original vignette design included a 7th dimension, describing the expected change in costs when switching to the presented lifestyle (−20%/−10%/same/+10%/+20%). This was to make it possible to analyze the willingness to pay of respondents or to calculate the monetary trade-off for a reduction in our lifestyle dimensions. Since the current paper focusses on identifying the willingness to adapt lifestyles voluntarily and in correlation with climate change inequality perceptions, we are not including this dimension in our discussion. Moreover, the costs had a rather weak effect on our respondents, with them seemingly caring more about changes in their lifestyle than the somewhat abstract cost descriptions related to them (see Appendix B2 for the effect of the cost dimension).
.
For each of those vignettes, we measure two outcome variables on 11-point scales: a rating of how climate-friendly respondents estimate a specific lifestyle would be and a rating of the willingness to adapt individual behavior to the described specific lifestyle. This allows us to ensure respondents’ knowledge of effective adaptation potentials before analyzing their stated willingness to adapt such lifestyles themselves. In this paper, we focus on the respondents’ willingness to adapt a lifestyle, since this variable has more informative value for individual behavior change than their ratings of the vignettes’ climate friendliness.Footnote 3
Before the respondents are presented with the lifestyle vignettes, they are exposed to the priming part of our survey experiment. In this phase, they are provided with one of the aforementioned three aspects of inequality in climate change (generational, global, economic) or are assigned to the control group. We use a between-respondents design and formulate our primes as a question of whether our respondents agree with the statement, to ensure that respondents do not skip over our primes. The statements can be translated as follows: “It is unfair that future generations (countries in the Global South/poorer households) will be more affected by the consequences of climate change, although older generations (countries in the Global North/richer households) are mainly responsible for past CO2 emissions.”
We further include questions to control for other important influences on climate-friendly behavior, like green attitudes, climate change worry, climate change knowledge, as well as the perceived self- and group-efficacy for mitigating climate change (see Appendix I for information about our questionnaire). Moreover, we are asking our respondents about their current habits in all of the lifestyle dimensions included in the vignettes, so we can compare the presented fictional lifestyles to each respondent’s current individual lifestyle (see Appendix G for descriptive statistics of respondent characteristics and their reported behavior).
We have opted to ask the respondents about their current lifestyle after the inequality primes and factorial survey part of the questionnaire to limit social desirability in the vignette ratings—our main outcome variable—due to a more obvious comparison with their own lifestyle, which could prime respondents. However, we are aware that measuring the self-reported behavior after our inequality primes and, therefore, avoiding unwanted priming effects can also lead to a posttreatment bias in our results (Klar et al. 2020; Sheagley and Clifford, 2023). To counteract this, we have taken several steps in the design of the survey to maximize the time between the inequality prime and the self-reported behavior and to formulate the corresponding questions as different as possible from how the behavior was presented in the vignette (see Appendix H1 for a more in-depth discussion). Moreover, we have added additional tests to ensure that our priming groups do not differ significantly in their self-reported behavior (see Appendix H2).
After excluding missing data, we are left with 1321 respondents rating 3952 vignettes.
Statistical analysis
To identify the lifestyle dimensions with the highest potential for behavior change, we are using multi-level random intercept regressions with cluster-robust standard errors on the respondents’ level. Our dependent variable is the respondents’ willingness to adapt to the lifestyle described in the vignette on an 11-point scale from −5 (definitely not) to 5 (definitely yes). Our independent variables are the characteristics of the dimensions shown in the vignette and the aforementioned control variables. To control for the current behavior of our respondents, we calculate the difference between the lifestyle dimensions described in the vignette and our respondents’ stated behavior. For example, for a respondent who is currently using the car 5 times a week and is presented with a vignette that includes car use on only 2 days a week, the new dimension value is the difference of 3 days. The same principle is applied to all other dimensions. However, since we focus on emission reduction, we are only concerned with lifestyle changes that require our respondents to do less than before. Therefore, vignette dimensions that would result in the same behavior or even more are coded as zero (e.g. a vignette dimension that includes car use on 5, 6, or 7 days a week will be set to 0 if the respondent is already using the car only 5 days a week). Our results can, therefore, be interpreted as analyzing the effect of a behavioral reduction in a specific dimension on the respondents’ willingness to adapt to the lifestyle vignette. As this approach signifies that not all vignette dimensions will lead to a reduction of behavior for our respondents in all vignettes, information about the share of vignettes that would lead to such a reduction is added to the results for each dimension. In the following, we will call this the “reduction share”.Footnote 4 Furthermore, the differences between lifestyles are z-standardized for every dimension to ensure comparability between dimensions and for ease of interpretation. The value of the standard deviations is included in the plots.
For our first research question, we examine whether respondents are more or less willing to adopt climate-friendly behavior in certain lifestyle dimensions, so we focus on the differences in effect sizes for a reduction across dimensions. To determine whether our respondents are influenced by their perceptions of different aspects of inequality in climate change (our second research question), we are calculating the same multi-level random intercept regressions, but separately for each priming group. We then analyze whether our priming groups differ compared to the control group and between each other in their willingness to adapt more climate-friendly lifestyles. If our primes have an effect on the respondents, the willingness to adapt more climate-friendly lifestyles should increase. Respondents, who have a value of 4 or 5 on the 5-point scale of agreement with the prime statement are coded as “agreeing respondents”.
Results
Inequality perceptions
Our first result concerns the respondents’ inequality perceptions. Figure 1 shows the distribution of the agreement to our inequality priming statements. The average agreement is quite high for all types of inequality, but there are some differences between the different dimensions of inequality. Respondents seem to agree most with economic inequality being unfair, followed by generational inequality, and lastly global inequality.

Rated on a 5-point scale; average agreement: Economic (4.01) > Generational (3.53) > Global (3.35).
Climate-friendly lifestyle dimensions
The first goal of our analysis is to find out in which dimensions respondents are most willing to change to more climate-friendly behavior. Figure 2 plots the first results of our Factorial Survey Experiment and shows the effect of a reduction in each lifestyle dimension on our respondents’ willingness to adapt such behavior. Since not all behavioral dimensions signify a reduction for the respondents (in the case of individuals showing habits that are more climate-friendly than the description in the vignette), information about the reduction share of vignettes can be found to the right of each dimension. As the differences between lifestyles are z-standardized for each dimension to ensure comparability, the standard deviation of each dimension is added on the left for ease of interpretation. Therefore, the coefficients can be interpreted as the effect of doing something one standard deviation less than before (e.g. using the car around one and a half days less).
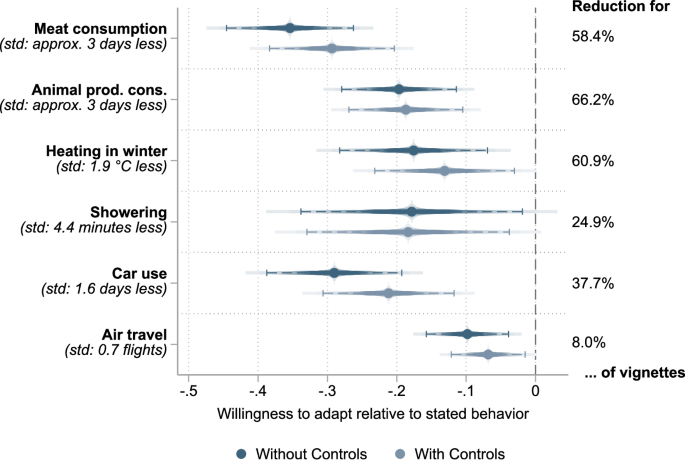
Linear random intercept regression using cluster-robust standard errors. Depicted are point estimates of the effect of behavioral reductions on the willingness to adapt to the lifestyle described in the vignette (rated on scales from −5 to 5) (with or without controlling for gender, age, education, income, climate change denial, climate change worry, climate attitudes, climate change knowledge, self-efficacy, group-efficacy, and the costs described in the vignette) and smoothed confidence intervals (vertical bar signifies 95% level). Estimation results are based on 3952 vignette ratings from 1321 respondents. Percentages on the right indicate the amount of vignettes that would demand behavioral changes from the respondent. For the exact estimates, see also the regression tables in Appendix D2.
Moving to our lifestyle dimensions, we can see that behavioral reduction negatively affects the willingness to adopt the behavior shown in the vignette for all dimensions. However, the number of vignettes that result in a reduction of behavior varies considerably across dimensions, ranging from a reduction share of almost two-thirds of vignettes for animal product consumption to just 8% for air travel. Controlling for other potential influences like self- and group-efficacy, climate change worries, or knowledge does not significantly change these results.Footnote 5 However, there are differences in the strength of our respondents’ opposition: While meat consumption and car use seem to be quite sensitive subjects, showering for a shorter time or reducing the heating temperature in winter have less negative effects on our respondents’ willingness to change their behavior. Especially in the dimension of car use, our standard deviation is not very high—using the car for around one and a half days less—and the respondents’ resistance to behavioral change is still very strong. Moreover, only 37.7% of vignettes even lead to a reduction in using the car, so our respondents seem to be particularly unwilling (or unable) to reduce their behavior further in this mobility dimension. This is different for air travel, where we see a less extreme reaction. On the one hand, the reduction share over all vignettes is clearly lower here. On the other hand, the weaker negative effect could also be driven by a difference in the willingness to change one’s daily routine vs. changing less ordinary activities or because of discounting effects, since respondents might be more willing to agree to change behavior which is further in the future (air travel for the next vacation vs. taking the bus to work tomorrow). Moreover, we cannot rule out that dimensions, which are discussed more controversially in the public, might trigger more pronounced resistance effects primarily due to their ideological associations rather than their level of changeability: We find a stronger negative effect for meat consumption than for dairy and other animal products, although reducing meat consumption is often easier than eliminating all other animal products from one’s diet. Moreover, the reduction share for meat consumption is also lower than for other animal product consumption, so many respondents are already eating less meat. It’s possible that those who are open to behavioral change have already adjusted, leaving a group of remaining individuals who hold particularly strong views.
The effect of inequality perceptions on emission reduction behavior
The second goal of our analysis is to find out whether our respondents’ willingness to adapt climate-friendly behavior is influenced by their perceptions of inequality in climate change. If our primes have an effect on the respondents, the willingness to adapt more climate-friendly lifestyles should increase. Looking at the results of our priming experiment, at first glance our respondents do not seem to be much affected by the inequality statements. The left part of Fig. 3 plots the effects of the factorial survey experiment for all different priming groups and the control group. There are no significant differences between these groups, thus we cannot find an effect of making people aware of different aspects of inequality on their willingness to behave more climate-friendly. However, since this analysis does not take into consideration whether our respondents actually agreed with the inequality statements, we take a closer look.
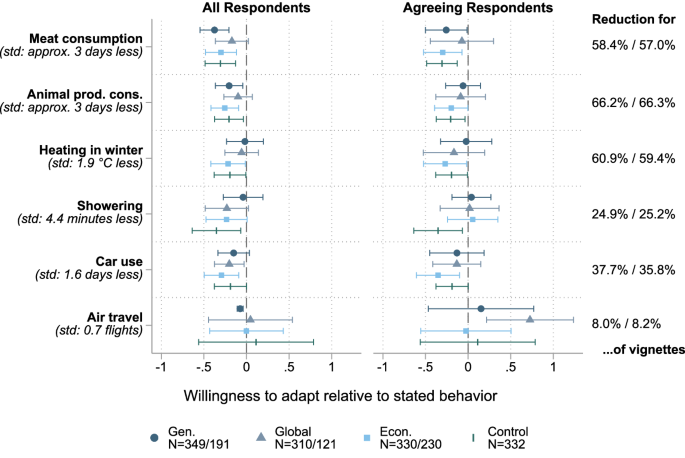
Linear random intercept regressions using cluster-robust standard errors. Depicted are point estimates of the effect of behavioral reductions on the willingness to adapt to the lifestyle described in the vignette (rated on scales from −5 to 5)(controlling for gender, age, education, income, climate change denial, climate change worry, climate attitudes, climate change knowledge, self-efficacy, group-efficacy, and the costs described in the vignette) and 95% confidence intervals for all respondents (left panel), and only for the subgroup of those respondents agreeing with the statement of the specific inequality prime they received (right panel). Estimation results are based on 3952 vignette ratings from 1321 respondents overall (number of respondents for each prime and agreeing to the priming statement is depicted in the legend). Percentages on the right indicate the amount of vignettes that would demand behavioral changes from the respondent (for all respondents/agreeing respondents). For the exact estimates, see also the regression tables in Appendix D3.
The right part of Fig. 3 shows the same analysis but only considers respondents who agreed with the statement they received.Footnote 6 Doing so moves our coefficients to the right in most dimensions. While behavioral reduction led to significantly negative effects in almost all lifestyle aspects before, many coefficients now shift over the zero line—the observed resistance seems to dampen. Interestingly enough, this tendency is somewhat stronger for respondents who got the global or the generational inequality statement, even though the economic inequality statement led to the highest average agreement. This is particularly noticeable for the dimension of air travel, with respondents who got the global inequality prime preferring lifestyles in which they fly less than they did before. Furthermore, the effect of a reduction in lifestyle habits ceases to be significantly negative even in the dimension of car use for respondents with the generational and the global statement. Even though this effect fails to shift to the positive side, it nonetheless shows detectable differences in the effects of our three inequality primes. Moreover, the comparison of the number of vignettes resulting in a behavioral reduction for all respondents and agreeing respondents shows no substantial variation within dimensions, so the effect changes cannot be ascribed to our respondents differing in their behavior ex-ante.
To check whether our primes have different effects depending on whether the respondent can identify as negatively or positively affected by the type of inequality they were shown, we calculate additional models in which we look at the effect of the economic inequality prime for different income groups and the effect of the generational inequality prime for different age groups. Additionally, we compare the level of agreement to our primes by the same subgroups. While we do find our youngest respondents (aged 18–34) to agree slightly more with the generational inequality statement compared to the other age groups, we do not find a clear pattern for the economic inequality statement when comparing income quartiles (see Appendix C1a and C2a). Subsequently, we do not find any statistically significant differences or clear patterns for both age groups or income quartiles when analyzing our respondents’ willingness to adapt climate-friendly lifestyles after being exposed to their respective prime (see Appendix C1b and C2b). Therefore, our respondents seem to either not identify themselves as differently affected by the type of inequality they were shown, or our primes have an effect regardless of whether people consider themselves as part of the affected group.
Discussion and conclusion
In our study, we observe several noteworthy findings. First, when it comes to the willingness to adapt one’s lifestyle in the context of climate change, we found that a reduction of behaviors with high emission potential generally results in opposition across all dimensions we examine. The reduction of meat consumption and car usage seems to evoke the strongest resistance from respondents, although we cannot check whether this is due to the perceived costs of changing behavior, ideologies related to behavior, discounting bias from our respondents, or other reasons. The dimension in which we find the highest potential for behavioral change is air travel, which seems promising since it carries substantial reduction potential, but we also see that most of our respondents already show very low levels of air travel.
In terms of the aspects of inequality in climate change, our findings revealed that respondents agreed the most with the statement about economic inequality, followed by generational and global inequality. However, our study indicates that framing climate change in terms of the two later aspects—global and generational inequality—has more potential to mobilize individuals towards behavioral change compared to the economic inequality framing. This hints towards other factors playing into this effect. Although we do not find any significant differences in comparing the effect of the economic inequality prime for different income groups, it is a reoccurring finding in inequality literature that the majority of Germans consider themselves middle class at the most, independently of whether they actually earn well (Bellani et al. 2021). Therefore, this could decrease the effect of the economic inequality prime, since it gives our respondents the possibility to not identify themselves as the responsible group regardless of their actual earnings.
It is also worth noting that our measurement of respondents’ self-reported behavior post-treatment (i.e. after the inequality primes) introduces certain limitations to interpreting our findings, as the joint effect of treatment on self-reported behavior and willingness to reduce behavior cannot be fully disentangled. However, our additional analyses show that the priming groups do not differ significantly from the control group in their self-reported behavior, indicating that the inequality priming does not influence self-reported behavior. We have provided further details and discussion in the “Methods” section and Appendix H to address this concern.
Nevertheless, priming people with information about climate change inequality alone—while being able to dampen the rejection of behavioral reductions for some of the primes—was insufficient to trigger substantial behavioral change in most dimensions, showing that structural transformations are indispensable for climate change mitigation. This goes in line with recent findings about reframing not being sufficient to increase citizens’ policy support (Bernauer and McGrath, 2016; Tschötschel et al. 2021) or climate-friendly behavioral intentions (Fesenfeld et al. 2021). Moreover, it is important to bear in mind that the willingness to change behavior will most likely not be sufficient for large-scale lifestyle transformations when necessary structural conditions are not met—even in the dimensions where respondents showed less resistance to behaving more climate-friendly. In the context of air travel, for instance, this means that alternatives like better train connections between countries and high-speed rail networks need to be fostered in addition to all endeavors to motivate people through awareness campaigns and messaging. Furthermore, if citizens simply do not have an alternative to their current behavior, like many residents of rural areas when it comes to using their cars, behavioral change can be almost impossible for those who have not yet adapted—even when financial incentives for public transport are dramatically increased (Auspurg et al. 2023). This is emphasized by the strong negative effect of reducing car use despite the low number of vignettes leading to a reduction in this dimension.
In conclusion, while our study illustrates which lifestyle dimensions show the biggest potential for behavioral change without strong public resistance and thus provide starting points for new approaches to motivate people, it also highlights that it is indispensable to provide the necessary support on a political level to facilitate habit changes.


Responses