Insights of aerosol-precipitation nexus in the central Arctic through CMIP6 climate models

Introduction
The Arctic is undergoing rapid warming, surpassing the global average by a factor of up to four1. This phenomenon is termed Arctic Amplification (AA)1. According to recent studies based on the Coupled Model Intercomparison Project (CMIP6)2 multi-model ensemble mean (MMM), AA results in profound consequences on the transition from snow- to rain-dominated precipitation patterns in the Arctic3,4, with significant socio-economic-ecosystem implications3,4. Previous research has extensively explored various factors contributing to the rain-dominated Arctic, such as amplified moisture transport from lower latitudes5,6, increased evaporation due to sea ice loss7, and an increase in temperature8. However, the influence of aerosol particles on precipitation and its type (snowfall and rainfall) in the central Arctic remains inadequately explored9.
Aerosol particles influence cloud-precipitation two-way interaction by acting as cloud condensation nuclei (CCN) and ice nuclei particles (INP) as well as getting wet-scavenged by precipitation10. Precise aerosol load and associated aerosol calculation schemes in climate models are thus essential for simulating aerosol-cloud-precipitation interactions, in turn, snowfall, and rainfall11. This is critical for partitioning the influence of aerosols on clouds and precipitation types11. The uncertainties surrounding the influence of aerosols on precipitation, as well as the removal of aerosols through wet scavenging by precipitation, are especially pronounced in the central Arctic12. Part of this difficulty stems from the insufficient availability of measurements of total aerosol load, more precisely the subset of the aerosol types acting as CCN and INP12, leading to potentially significant biases in quantifying the magnitude of the impact of aerosols on snow and rainfall as well as removal of aerosols by wet-scavenging due to precipitation over the central Arctic13,14.
Addressing this lack of aerosol observational data gap has led to research campaigns like MOSAiC15, ACLOUD/PASCAL16, and PAMARCMIP17,18, alongside land-based measurements9,19,20,21. Still, these efforts did not represent the vast central Arctic. Furthermore, using various satellite observations has the potential to present aerosol distribution information across the central Arctic. However, all these satellites are limited in their ability to retrieve aerosol optical depth (AOD), especially in the central Arctic22,23,24,25. This is mainly associated with the fact that the algorithms employed by these satellites are not specifically designed for retrieving data over cold and highly reflective surfaces, as well as interference from clouds22,24.
Given the scarcity of comprehensive aerosol measurements over the central Arctic snow and ice-covered areas, different attempts tried to address this lack of aerosol distribution information by using AOD obtained from top-of-atmosphere reflectance (TOA) from various remote-sensing space-borne platforms26,27,28,29. Nonetheless, these efforts have mainly concentrated on assessing AOD over Spitsbergen Island of Svalbard archipelago, leaving much of the central Arctic cryosphere unmonitored. Recently, an advanced algorithm named AEROSNOW30 has emerged, specifically designed to retrieve AOD in the central Arctic snow and ice-covered regions. This algorithm offers a detailed spatial depiction of AOD spatio-temporal distribution over the expansive central Arctic cryosphere (≥70°N), covering almost up to a decade from 2003 to 201130.
In this study, we aim to bridge the scientific knowledge gap described earlier by investigating the spatio-temporal AOD disparity simulated by CMIP6 models and retrieved by AEROSNOW in the central Arctic. Our emphasis is on evaluating its effects on snow and rain precipitation as well as the impact of precipitation on the wet-scavenging removal of aerosol in the relatively unexplored central Arctic cryospheric region across different spatial and temporal scales from 2003 to 2011. Our analysis reveals that CMIP6 models struggle to accurately capture seasonal variations in aerosol observed by satellite. Key findings indicate: (a) Majority of CMIP6 models inadequately simulate total aerosol load, leading to a positive bias towards snowfall across the central Arctic. (b) Modeled aerosol compositions are significantly inconsistent between models, emphasizing the need to integrate improved aerosol formation, transport, and deposition knowledge to constrain its effects on Arctic precipitation. Recent research4 has shown that the latest climate models (CMIP6) estimate a faster and more substantial increase in Arctic rainfall than previous estimations based on CMIP5 models and associated this escalation in rainfall to heightened moisture transportation from lower latitudes, escalated evaporation stemming from sea ice reduction, and elevated temperature. However, we propose that the contribution of rainfall to the total precipitation ratio could become even more alarming than currently estimated by ref. 4 with the integration of more realistic aerosol load and aerosol schemes into these models, which simulate high AOD. This study, therefore, serves as a baseline to support the extensive literature that relies on CMIP6 models to quantify the magnitude of aerosol-precipitation co-variation over the central Arctic sea ice region.
Results and discussion
Setting the stage: retrieval of AOD over the central Arctic sea ice region
The AEROSNOW retrieval focused on the rapidly changing central Arctic cryospheric region. Given the challenge of highly reflective surfaces, and low-level mixed-phase clouds to obtain observational data on aerosol distribution there, an advanced retrieval approach was undertaken30. The AEROSNOW retrieval method was utilized, employing data from the AATSR instrument aboard the ENVISAT satellite. This algorithm, detailed in30, identifies and separates cloud-free scenes at high latitudes and retrieves AOD30, presented in Fig. S1. The climate models employed in this study are outlined in Table S1. Assessment of individual climate models concerning AEROSNOW is illustrated in Fig. S2 and Table S2.
The study delves into two specific Arctic seasons: spring (April–May) and summer (June–July–August). These seasons are characterized by the interplay of anthropogenic aerosol transport over long distances in spring and natural aerosol emissions locally during summer. Spring exhibits low precipitation levels, while summer experiences high levels of precipitation12,31. Thus AEROSNOW retrieval during these seasons serves as a benchmark to assess CMIP6 climate models’ ability to simulate aerosols over the central Arctic, providing insight into model performance relative to satellite observations and their association with types of precipitation.
Seasonal aerosol-precipitation nexus
During the spring season, both individual CMIP6 models and the ensemble mean struggle to accurately simulate total AOD compared to AEROSNOW observations (Fig. 1a). The MMM for low-AOD (models underestimating AOD), high-AOD (models overestimating AOD), and combined (Low-AOD + high-AOD) models shows underestimations and overestimations by −55%, 221%, and 32%, respectively, compared to AEROSNOW observations (Fig. 1a). Only the EC-Earth-AerChem and MMM (All) models, within two standard deviations, fall within two standard deviations of the satellite AOD observations. This indicates that these models show better alignment with the observational data compared to others (Fig. 1a). Snowfall dominates across all models during spring by a factor of 6 compared to rainfall. Notably, high-AOD models, which overestimate AOD by an average of 221%, exhibit the lowest rainfall at approximately 0.084 mm/day, underestimating by −13% with respect to the MMM of rainfall (Fig. 1a). Moreover, during the summer season, most models do not accurately simulate the total AOD within two standard deviations of satellite observations (Fig. 1b). However, the EC-Earth-AerChem, MRI-ESM2-0, IPSL-CM5A2-INCA, and MMM (All) models show AOD values within two standard deviations of the satellite observations (Fig. 1b). This suggests that these models more closely match the observed AOD, reflecting a better representation of aerosol distribution during the summer season compared to other models. The MMM for low-AOD and high-AOD models shows significant discrepancies, with underestimations of −48% and overestimations of 122%, respectively. In contrast, the combined MMM (Low-AOD + High-AOD) closely aligns with measurements, showing only a 5% overestimation.

a–c Represent the spring, summer, and combined (spring + summer) mean aerosol components of each model, the multi-model mean, and AEROSNOW averages over the high Arctic sea ice region, respectively. Models simulating total AOD falling below and above the AEROSNOW levels are categorized as low-AOD and high-AOD models. Dotted maroon lines indicate two standard deviations, while solid lines represent the mean of AEROSNOW AOD data. The black vertical line above each AOD bar plot shows the two standard deviations of total AOD simulated by each model. Blue, red, and blue-violet dotted lines depict total precipitation, snow precipitation, and rain precipitation respectively. These dotted lines for precipitation serve as visual aids to discern changes in precipitation across models simulating from low to high AOD. d–f is the same as a–c but for aerosol-only simulations. g–i and j–l are the same as a–c but for temperature and relative humidity respectively.
When investigating precipitation types in summer, low-AOD models simulate two-fold higher rainfall compared to high-AOD models (0.73 mm/day for low-AOD models vs. 0.36 mm/day for high-AOD models). Conversely, high-AOD models simulate 1.6 times higher snowfall than low-AOD models (0.43 mm/day for low-AOD models vs. 0.70 mm/day for high-AOD models) (Fig. 1b). This bias towards snowfall in high-AOD models affects the combined MMM, resulting in snowfall becoming the slightly dominant form of precipitation in the central Arctic region at 0.56 mm/day compared to rainfall at 0.54 mm/day (Fig. 1b).
Given that the Arctic is fully illuminated by sunlight in summer, it is expected to be rainfall-dominated3. Thus, it is crucial to adjust the total AOD, and the speciation of the aerosol types, which will, in turn, optimize the CCN and INP number concentrations together with implementing a precise aerosol scheme in high-AOD models during summer to match AEROSNOW AOD observations could lead to a higher dominance of rainfall than currently projected. This highlights the limitations of the MMM of climate model ensembles in evaluating the current magnitude of rainfall associated with AA over the sea ice region (Fig. 1b).
The high-AOD models positive bias towards snowfall during summer affects the precipitation types during both spring and summer combined (Fig. 1c). However, in high-AOD models, snowfall is enhanced by threefold more than rainfall (snowfall is 0.67 mm/day, rainfall is 0.22 mm/day) (Fig. 1c). This threefold higher snowfall contributes to the dominance of snowfall in combined MMM in the central Arctic over rain approximately by a factor of two. The relative percentage difference of AOD with respect to MMM, its components, and the associated precipitation of each individual model are presented in Fig. S3. Adjusting total AOD together with aerosol schemes in high-AOD models during summer to align with AEROSNOW observations could result in a decrease in snowfall and a more substantial increase in rainfall in the MMM estimations than currently estimated by ref. 4 over the central Arctic region.
Further, to estimate the impact of aerosol on snowfall and rainfall and to confirm that the high load of aerosols in models is triggering higher snowfall in high-AOD models, we have considered, the historical anthropogenic aerosols-only (Hist-aer) simulations2, which focus on historical anthropogenic aerosol forcings, while holding other forcings like carbon dioxide, greenhouse gases, land use, volcanic activity, and solar radiation constant at pre-industrial levels, are a significant component of the Detection and Attribution Model Intercomparison Project (DAMIP)2 within the CMIP6 framework. These simulations aim to isolate the effects of anthropogenic aerosol load on climate by providing a controlled environment to study their impacts on precipitation2. By utilizing a range of climate models, Hist-aer allows us to assess how variations in aerosol load influence precipitation patterns. Thus by analyzing this Hist-aer simulations, we explored the contribution of aerosols on rainfall and snowfall over the central Arctic region, as shown in Fig. 1d–f. This analysis revealed that models with high AOD simulated nearly double the snowfall compared to low-AOD models during the summer season (0.82 mm/day in high-AOD models vs. 0.41 mm/day in low-AOD models) (Fig. 1e). However, there is only one high-AOD model (i.e., GISS-E2-1G) provides Hist-aer simulations, but it is representative for all the GISS high-AOD models that use same aerosol scheme (i.e., One-Moment Aerosol scheme (OMA)). Thus the insights gained from this analysis confirm that high-AOD models are overestimating snowfall and underestimating rainfall (Fig. 1d–f). Thus, in turn, the summertime high snowfall simulated by high-AOD models contributes to the higher snowfall and lesser rainfall in the MMM during both spring and summer seasons combined (Fig. 1f).
Additionally, beyond aerosols, we explored the impact of temperature and relative humidity (RH) co-variation on precipitation, illustrated in Fig. 1g–i and Fig. 1j–l, respectively. High temperatures typically reduce snowfall due to increased melting and less efficient ice crystal formation. In contrast, low temperatures promote higher snowfall amounts as they favor ice crystal growth and accumulation10. High RH enhances both snowfall and rainfall by increasing atmospheric moisture, which facilitates the growth of cloud droplets and ice crystals, leading to heavier precipitation events as saturation is more easily achieved10. Conversely, low RH restricts moisture availability, resulting in reduced cloud formation and smaller droplet sizes, thereby diminishing overall precipitation amounts. To assess whether the higher summertime snowfall simulated by high-AOD models is influenced by temperature and RH, we examined the co-variation of temperature between high- and low-AOD models in Fig. 1h. This analysis revealed that high-AOD models, despite simulating slightly warmer temperatures (−0.64 °C for high-AOD versus −0.67 °C for low-AOD), still generated greater snowfall than rainfall. Similarly, Fig. 1k depicts the co-variation of RH, indicating that high-AOD models exhibited lower RH during summer (32.9% for high-AOD versus 35.3% for low-AOD) yet still produced higher snowfall compared to rainfall.
Zonal mean cycle of aerosol-precipitation nexus
In addition, when examining the zonal-averaged seasonal variability of the impact of precipitation on wet-scavenging of aerosols co-variations, as previous observational studies12,31, the Arctic zonal average exhibits significant aerosol concentration ranging from 70°N to 90°N during spring, coinciding with relatively low precipitation levels. Conversely, during summer, there is a decline in aerosol concentration and a rise in precipitation within the same latitudinal range12,31. Therefore, the zonally averaged spring and summer cycles of total AOD overlaid with various aerosol components and satellite measurements for low-AOD, high-AOD, and combined MMM simulations are depicted in Fig. 2a for further evaluation of co-variation with respect to precipitation (Fig. 2b), as well as meteorological parameters, such as temperature (Fig. 2c), and RH (Fig. 2d). The zonal-averaged seasonal variability of AOD and associated precipitation for individual models is illustrated in Fig. S4(i, ii). This reveals that nearly all models, except for EC-Earth3-AerChem, fail to replicate this seasonal pattern of aerosol-precipitation interaction. This discrepancy may stem from inadequate integration and parameterization of various aerosol schemes particularly the wet-scavenging of aerosols due to seasonal variation of precipitation within the individual models. This is evident in models such as IPSL-CM6A-LR (Fig. S4i, c and Fig. S4ii, c) and IPSL-CM5A2-INCA (Figs. S5i and S6j), where there is interaction between aerosol concentration and precipitation, resulting in high summer precipitation coinciding with high aerosol concentration. This observed positive correlation is opposite to the expected negative relationship. This is associated with the absence of aerosol schemes in these simulations (Table S1).
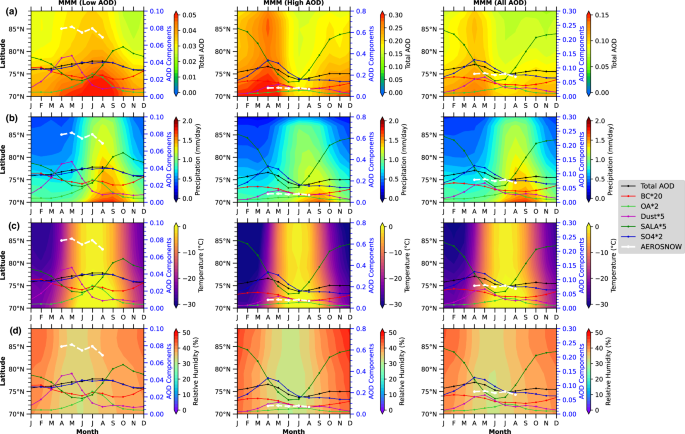
a–d rows display zonal averages of the total AOD, total precipitation, temperature, and relative humidity over the high Arctic sea ice regions, respectively, plotted against month and latitude for both the multi-model mean (MMM) of low-AOD and high-AOD models, respectively. Additionally, it features AEROSNOW-retrieved total AOD data, as well as the seasonal cycle from 2003 to 2011 of total aerosol load in terms of AOD and its speciations in the central Arctic sea ice region.
As a result, this disparity in zonal-averaged seasonal variability among individual models is evident in the MMM for both low-AOD and high-AOD models (Fig. 2a). In the MMM of low-AOD models, the zonal average reveals the highest aerosol concentration between 70°N and 90°N during the summer, coinciding with increased precipitation. This could be attributed to either aerosol-induced precipitation effects (such as suppression of rain or the Wegener-Bergeron-Findeisen (WBF) process) or to precipitation-induced wet scavenging of aerosols (Fig. 2a, b, first column). Conversely, in the MMM of high-AOD models (Fig. 2a, b, second column), the zonal average displays lower aerosol concentration between 70°N and 90°N during summer, coinciding with increased precipitation, showcasing wet-scavenging due to higher precipitation during summer (Fig. 2a, b, middle column), albeit with 1.4 times less total precipitation than low-AOD models. Furthermore, the responses of different aerosol types and their associations with precipitation, along with the relative percentage differences of each aerosol component from the multi-model mean for individual models, are depicted in Figs. S3–S6, respectively. Additionally, the seasonal and zonal variations of meteorological parameters, such as temperature and RH, are shown in Fig. 2c, d. In both the low- and high-AOD model MMMs, the zonal average indicates the highest temperatures occur between 70°N and 90°N during summer, aligning with increased precipitation (Fig. 2c). Meanwhile, in both model groups, RH is higher during the winter months compared to summer (Fig. 2d).
Co-variation of simulated meteorology with aerosol composition and precipitation
Analysis of combined MMM aerosol types and associated meteorology co-variation, such as precipitation (Fig. 3a–c), temperature (Fig. 3d–f), RH (Fig. 3g–i) across the central Arctic reveals distinct patterns for both spring and summer. In spring, characterized by snowfall dominance across the models (0.61 mm/day), there is a positive correlation (R = 0.35) between dust aerosol, a significant Ice Nucleating Particle (INP) source in the Arctic32, and precipitation (Fig. 3a). This shows that the scavenging process of the dust aerosol due to snowfall during spring is not well adopted in the models. Similarly, in summer, with rainfall predominance (0.54 mm/day) (Fig. 1b), a high correlation of ~0.78 is observed between sea salt (SS) aerosol load (Fig. 3b), a prominent CCN source in the Arctic33, and precipitation (Fig. 3b). This further shows that the scavenging process of the sea salt aerosol due to rainfall during summer is not well adopted in the models. This discrepancy underscores the necessity for enhanced aerosol schemes parameterization within climate models, particularly focusing on Arctic aerosol-cloud-precipitation processes such as wet-scavenging, the Wegener-Bergeron-Findeisen mechanism etc, which governs ice and liquid droplet growth under Arctic conditions34,35 (also see Table 1 and Method). Further, the spring and summertime different aerosol types response to precipitation for individual climate models are shown in Figs. S5 and S6. In addition, from Figs. S5 and S6, reveal that nearly all models fail to replicate this seasonal wet-scavenging of sea salt and dust aerosol types and associated snowfall and rainfall precipitation co-variations, except for EC-Earth3-AerChem in low-AOD models, and GISS-E2-1-H, GISS-E2-1G, INM-CM5-0, INM-CM4-8, GISS-E2-2-G in high-AOD models. It is noteworthy that although in the high-AOD models, there is a better seasonal wet-scavenging of sea salt and dust aerosol types and associated snowfall and rainfall precipitation co-variations the aerosol load is significantly higher than the AEROSNOW observations. Additionally, the impact of meteorological factors, such as temperature and RH, on aerosol swelling and their influence on high AOD during seasonal aerosol loading of various components is presented in Fig. 3d–f and g–i. The results show the co-variation between high AOD and either temperature or RH.
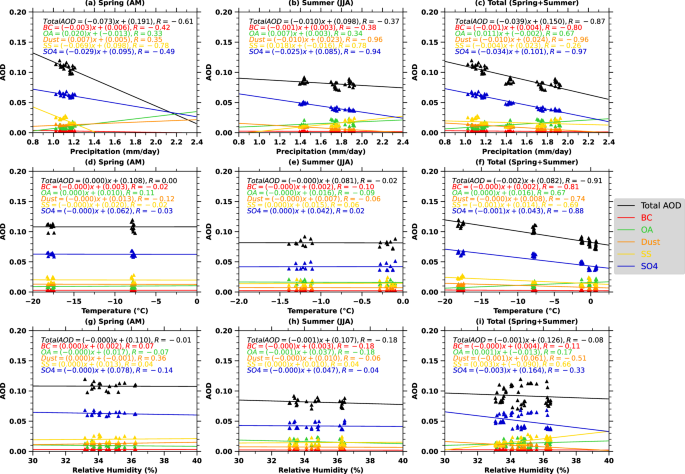
The linear relationship between the multi-model mean (MMM) of total AOD and its components with the MMM of precipitation (a–c), temperature (d–f, and relative humidity (g–i) during spring (first column), summer (second column), and total (spring+summer) (third column). The triangles represent the monthly mean of MMM AOD of aerosol types, precipitation, temperature, and relative humidity. The correlative coefficient is presented as R.
Further, to analyze the correlation between precipitation and AOD, temperature, and RH, we utilize statistical relationships represented by correlation coefficients (Fig. 4a–i). In the Arctic, these linear correlations vary across spring, summer, and combined seasonal timescales. During spring, the correlation coefficient (R) between precipitation and AOD is strongly negative (e.g., −0.61), suggesting a significant suppression of precipitation by aerosols or vice versa (Fig. 4a). Temperature exhibits a moderate positive correlation (e.g., +0.22) (Fig. 4d), reflecting its role in enhancing precipitation through convective processes as Arctic temperatures rise31. RH shows a weaker negative correlation (e.g., −0.27), indicating its limited influence on precipitation during this season (Fig. 4g). In summer, the correlation between precipitation and AOD remains negative (e.g., −0.37), potentially due to the interaction between aerosol loading and increased precipitation (Fig. 4b). Meanwhile, temperature shows a slight positive correlation (e.g., +0.03), and RH maintains its minimal role (Fig. 4e). When considering spring and summer together, the correlations present averaged relationships, AOD remains negatively correlated with precipitation, while temperature and RH exhibit moderate positive correlations. These patterns underscore the complex interplay of atmospheric dynamics and climatic factors driving Arctic precipitation variability.
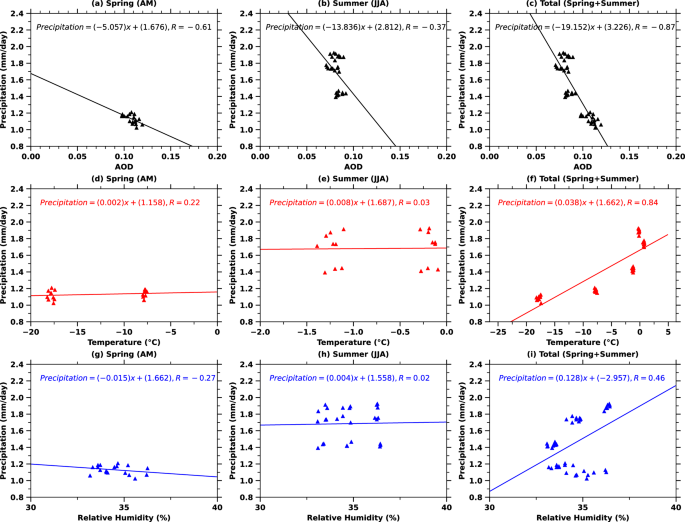
The linear relationship between the multi-model mean (MMM) of Precipitation with the MMM of aerosol optical depth (a–c), temperature (d–f), and relative humidity (g–i) during spring (first column), summer (second column), and total (spring+summer) (third column). The triangles represent the monthly mean of MMM AOD of precipitation, aerosol optical depth, temperature, and relative humidity. The correlative coefficient is presented as R.
Additionally, the impact of RH and temperature on AOD is essential for comprehending aerosol-climate interactions (Fig. 3a–i). RH affects aerosols through hygroscopic swelling36, where water-soluble particles grow in size under high humidity, altering their optical properties and increasing light scattering. Temperature influences AOD by driving temperature-dependent aerosol emissions, such as volatile organic compounds (VOCs), and affecting atmospheric stability and wind patterns, which impact aerosol transport and distribution31. Both RH and temperature also influence precipitation through their roles in cloud formation and moisture availability, creating a confounding effect. For example, increased RH may simultaneously enhance aerosol hygroscopic growth (high AOD) and precipitation, leading to an apparent, but indirect, link between AOD and precipitation9. This highlights the need to account for the shared influence of RH and T when analyzing AOD-precipitation relationships.
This confounding relationship introduces challenges when trying to interpret the interactions between AOD and precipitation. Without properly accounting for the roles of RH and temperature, it may be difficult to discern whether changes in AOD are directly influencing precipitation patterns or whether both are simply responding to common environmental factors. Therefore, a more thorough description of the impacts of RH and temperature on AOD, including their effects on aerosol swelling, emission, and transport, is essential to disentangle these complex interactions and to avoid misinterpretation of the relationship between aerosol dynamics and precipitation. Understanding these interactions will also help in improving climate models that need to account for both aerosol effects on radiation and cloud processes.
This emphasizes the importance of reconciling the total AOD simulated by different models with the satellite observations and improving the aerosol schemes used in the models that are responsible for the mechanisms of Arctic aerosol emissions, their evolution, wet-scavenging and their impact on precipitation in the form of CCN, and INP in the central Arctic.
Implications for quantifying the magnitude of Arctic rainfall and snowfall dominance
Fresh insights into total AOD, the subset of which act as sources of CCN and INP throughout the central Arctic, contribute significantly to addressing a critical gap in understanding cloud formation, lifetime, and properties that profoundly affect precipitation patterns, including rain and snowfall. In Fig. 1a–c, we present the seasonal variations in aerosol loading and aerosol properties during the AEROSNOW retrieval period.
The total aerosol load, quantified by AOD, significantly influences precipitation patterns and vice versa in climate models through various aerosol schemes11. The higher aerosol load can be due to the presence of CCN and INP particles, changing cloud microphysics, and associated processes for the type of precipitation10. For instance, aerosols like black carbon, organic carbon, dust, sea salt, and sulfate interact differently with clouds, affecting the formation and intensity of rainfall and snowfall as well as getting wet-scavenged by the precipitation11. Aerosol schemes used in various models such as SPRINTARS6.0, TACTICv2, MAM4, HAM2.3, OsloAero, INCA v6 AER, TM5, MASINGAR mk2r4, OMA, and INM-AER1 incorporate these aerosol-cloud-precipitation co-variations (See Table 1 and S1), yet their effectiveness varies based on how comprehensively they represent these microphysical processes (see Table 1 and Method). More realistic aerosol schemes and associated wet-scavenging processes tend to better capture these interactions, leading to more realistic predictions of aerosol-precipitation changes under various climate scenarios.
We propose that incorporating improved aerosol loads, diverse aerosol types, and associated aerosol schemes into high-AOD climate models will decrease the contribution of snowfall to the total precipitation ratio during summer. Consequently, this will result in a greater contribution of rainfall to the total precipitation over the Arctic than is currently estimated by ref. 4. Examining the representations of aerosol-precipitation variations provides insights into climate model performance in the central Arctic. Leveraging satellite-derived AOD data as a benchmark, we identify a significant negative bias towards Arctic rain dominance in high-AOD climate models, particularly evident during summer (Fig. 1b). Our analysis underscores that across high-AOD models where total AOD surpasses the observation by relatively 121%, snowfall intensifies by two times compared to rainfall during summer (0.70 mm/day snowfall vs. 0.36 mm/day rainfall) (Fig. 1b).
This is associated to the significantly higher AOD estimation by these models than the observation and also using aerosol schemes such as OMA, and INM-AER1, which are missing various aerosol-cloud microphysical processes such as autoconversion, accretion, wet-scavenging, Bergeron-Findeisen processes (see Table 1, and Method). These basic aerosol schemes need significant improvements in microphysical and feedback processes (see Table 1). This further raises concerns regarding the suitability of the current MMM of various climate models for realistically quantifying the impacts of Arctic warming on rain and snowfall.
The MMM combined (low-AOD + high-AOD models) is crucial to acknowledge that constraining total AOD and associated aerosol schemes in models with high aerosol loads projecting substantial snowfall during summer to align with observations could result in less snowfall and higher dominance of rainfall contribution to the total precipitation ratio than currently estimated by ref. 4. This underscores the limitations of MMM of various CMIP6 models in assessing the magnitude of current and future rainfall dominance associated with AA over the central Arctic sea ice region. These findings emphasize the critical role of integrating new observational datasets, such as AEROSNOW, for benchmarking total AOD and associated aerosol schemes in climate models and refining the assessment of Arctic precipitation patterns amid ongoing Arctic warming.
Methods
Space-borne observational data
This study employs the Advanced Along-Track Scanning Radiometer (AATSR)37 on ENVISAT to determine the total AOD over Arctic snow and ice from 2003 to 2011. The AATSR was a part of the European Space Agency’s (ESA) ENVISAT mission. The lifespan of this mission was from February 28th, 2002 to April 8th, 2012. ENVISAT crosses the equator at 10:00 local time. The AATSR provided measurements from May 2002 to April 2012, with a spatial resolution of 1 km at nadir and a swath width of 512 km. It is equipped with dual-viewing observations, with a forward viewing angle of 55°, and measures upwelling reflectance at 0.55, 0.66, 0.87, 1.6, 3.7, 11, and 12 μm.
The AEROSNOW algorithm30 integrates aerosol retrieval26 and cloud masking methods38 specifically designed for high Arctic latitudes (≥ 72°N). Utilizing AATSR’s dual-viewing capability, AEROSNOW effectively estimates the aerosol contribution to TOF reflectance over bright cryospheric surfaces. AOD values peak in spring (March–May) and are lower in summer (June–August). AERONET ground-based measurement stations located in high Arctic snow and ice-covered areas (such as PEARL, OPAL, Hornsund, and Thule) were used for validation of the AEROSNOW-retrieved AOD data. The validation showed a high correlation (R = 0.86) and minimal bias, with an average AOD less than 0.15. The increased AOD in spring effectively captures Arctic haze events31. AEROSNOW provides unique, high-resolution AOD data, offering valuable insights into Arctic cryospheric dynamics from 2003 to 2011. The satellite observations of temperature data for the same period are taken form from https://doi.org/10.48670/moi-00123.
Model datasets
The CMIP62 represents a comprehensive effort in climate modeling, providing a wealth of data critical to understanding the Earth’s climate system. Within CMIP6, AOD is a critical component for assessing atmospheric composition and radiative forcing. Several aerosol components, including sulfate, black carbon, organic carbon, dust, and sea salt, are explicitly simulated by CMIP6 models, allowing studies of their spatial and temporal distributions and their impact on climate processes39. In addition, CMIP6 models provide valuable insights into precipitation dynamics, including snowfall, rainfall and total precipitation, temperature, and RH. By simulating these components, CMIP6 facilitates analyses of precipitation variability, trends, and extremes, thereby improving our understanding of hydrological cycles and their response to anthropogenic forcing. These datasets enable rigorous assessments of climate model performance and uncertainties, informing climate projections and policy decisions aimed at mitigating the impacts of climate change2. The models selected in this study are based on the data availability of total AOD, associated aerosol types, and associated precipitation types from individual models.
In the assessment of the monthly mean AOD simulated by CMIP6 models in conjunction with AEROSNOW retrievals, the calculation of the monthly mean AOD from AEROSNOW is restricted to months characterized by at least 15 days of daily data for Arctic complex conditions, as suggested by refs. 24,40, in order to adequately capture the nuances of the complex Arctic climatic conditions. Furthermore, in the assessment of the central Arctic cryosphere using the CMIP6 model, the AEROSNOW retrieval offers continuous temporal coverage throughout the month as the CMIP6 models and collocated spatially with the output of each model. Further, the precipitation units from kg/m2/s of the models are converted to mm/day by using the below formula3,4.
Precipitation (mm/day) = Precipitation (kg/m2/s) × 86400
The multi-model mean was generated by regridding the model data to a 1° × 1° latitude and longitude grid. Additionally, to ensure spatial collocation with the models, the AEROSNOW data underwent regridding to the same 1° × 1° latitude and longitude grid as the models by using CDO41.
Aerosol Schemes and associated precipitation types
Aerosols influence precipitation types such as snowfall and rainfall through various processes in climate models. One common method used in climate models to simulate aerosol-cloud-precipitation interactions is by incorporating aerosol schemes. These schemes account for aerosol effects on cloud microphysics, which in turn has an impact on precipitation formation by acting as CCN or INPs, depending on their properties. CCN can enhance cloud droplet formation, affecting cloud properties such as cloud droplet concentration, size distribution, and cloud albedo. INP can initiate ice crystal formation, influencing the formation of ice clouds and precipitation types such as snowfall. The representation of aerosol-cloud interactions in climate models involves parameterizing these processes based on the physical and chemical properties of aerosols.
Understanding how aerosol schemes in climate models calculate precipitation types like snowfall and rainfall and how they are influenced by aerosols involves examining the aerosol-cloud-precipitation interactions employed in these models. The detailed explanation of Aerosol-Cloud-Precipitation interactions in Climate Models with equations are as follows;
-
i.
Aerosol Activation and Impact on Cloud Microphysics: Aerosols act as CCN for liquid clouds and Ice Nucleating Particles (INP) for ice clouds. The formation of precipitation (rain or snow) depends on these initial cloud microphysical processes10. Cloud Droplet Number Concentration (Nd): Cloud droplets form around aerosols acting as CCN. The cloud droplet number concentration is influenced by the concentration of CCN and the environmental supersaturation (S)42.
$$S=frac{e-{e}_{s}}{{e}_{s}}$$(1)where, e is the actual vapor pressure, es is the saturation vapor pressure over liquid water. The relationship between cloud droplet number concentration and the concentration of CCN can be expressed as:
$${N}_{d}=C(S)times {(text{CCN})}^{alpha }times {S}^{beta }$$(2)Where, Nd is the cloud droplet number concentration, C(S) is a function that varies with supersaturation, CCN is the concentration of CCN, α is an empirical exponent typically less than 1, S is the environmental supersaturation, β is an empirical exponent representing the influence of supersaturation on Nd. Ice Crystal Number Concentration (Ni): Ice crystals form around aerosols acting as INP. The ice crystal number concentration depends on the concentration of INPs and the environmental conditions, particularly temperature (T) and supersaturation with respect to ice (Sice)43.
$${N}_{i}=f(T,,text{INP},)$$(3)Where:Ni is ice crystal number concentration, f is a function dependent on temperature and INP concentration.
-
ii.
Microphysical Processes: Autoconversion and Accretion: The formation of precipitation from cloud droplets and ice crystals involves several microphysical processes, including autoconversion (the process by which cloud droplets merge to form raindrops) and accretion (the process by which raindrops collect cloud droplets)44. Autoconversion Rate (Pauto): The autoconversion rate is the rate at which cloud droplets convert into raindrops. This process is influenced by the concentration of cloud droplets44.
$${P}_{{rm{auto}}}propto {N}_{d}^{-3/2}times {text{LWC}}^{2}$$(4)Where: Pauto is the autoconversion rate, Nd is cloud droplet number concentration, and LWC is the liquid water content. Accretion Rate (Paccr): The accretion rate is the rate at which raindrops grow by collecting cloud droplets. This rate is influenced by cloud droplet size and concentration44.
$${P}_{{rm{accr}}}propto {r}_{d}^{4}times {N}_{d}$$(5)Where: Paccr is the accretion rate, and rd is the mean droplet radius.
-
iii.
Ice Nucleation and Snowfall Formation: In cold clouds, aerosols can act as INPs, promoting the formation of ice crystals. The presence of ice crystals impacts the type and amount of precipitation, particularly snowfall. Ice Nucleation Rate (J): The rate of ice nucleation depends on the number of INPs and the supersaturation with respect to ice45.
$$J={n}_{s}times {S}_{{rm{ice}}}$$(6)Where: J is the ice nucleation rate, ns is the number density of ice nuclei, and Sice is the supersaturation with respect to ice.
-
iv.
Mixed-Phase Clouds and Precipitation Partitioning: Mixed-phase clouds contain both supercooled liquid droplets and ice crystals. The partitioning between rain and snow in these clouds is influenced by the Bergeron-Findeisen process46.
$$frac{d{M}_{i}}{dt}=alpha ({e}_{w}-{e}_{i})$$(7)Where:(frac{d{M}_{i}}{dt}) is the growth rate of ice crystals, α is the collection efficiency, ew is the saturation vapor pressure over water, and ei is the saturation vapor pressure over ice.
-
v.
Aerosol Wet Scavenging: Wet scavenging refers to the removal of aerosols by precipitation. This process is critical for determining the lifetime of aerosols in the atmosphere and their interaction with clouds and precipitation. Wet-Scavenging Rate (Sw): The scavenging rate depends on precipitation rate (P), the aerosol concentration (Ca), and scavenging coefficient (λw)47.
$${S}_{w}={lambda }_{w}times Ptimes {C}_{a}$$(8)Where: Sw is the aerosol wet-scavenging rate, λw is the scavenging coefficient, P is the precipitation rate, and Ca is the aerosol concentration.
-
vi.
Radiative and Thermodynamic Feedbacks: Aerosols influence cloud albedo and radiative forcing, which in turn affect surface temperatures and atmospheric moisture, thereby impacting precipitation patterns. Surface Radiative Forcing (ΔQ):48
$$Delta Q=-Delta tau cdot S$$(9)Where: ΔQ is the change in surface radiative forcing, Δτ is the change in cloud optical thickness, and S is incoming solar radiation. These equations illustrate how climate models use aerosol schemes to simulate the effects of aerosols on snowfall and rainfall, capturing the intricate interactions between aerosols, cloud microphysics, and precipitation processes. Changes in cloud optical thickness due to aerosols can alter surface evaporation and atmospheric moisture, impacting precipitation patterns.
Summary of the Table:
SPRINTARS6.0: comprehensive model with detailed microphysical processes, excellent for mixed-phase clouds. Good balance between snowfall and rainfall impacts.
MAM4 and HAM2.3: among the best in terms of detailed microphysics and aerosol interactions, though MAM4 lacks some long-term feedback mechanisms.
TACTICv2 and OsloAero: good models but less detailed in microphysical processes compared to SPRINTARS6.0.
INCA v6 AER, TM5, and MASINGAR mk2r4: fair models with some strengths in regional applications but need more comprehensive microphysics for global scales.
OMA and INM-AER1: basic models needing significant improvements in microphysical and feedback processes.

Responses