Integration of multiple machine learning approaches develops a gene mutation-based classifier for accurate immunotherapy outcomes

Introduction
In recent years, the advent of immune checkpoint blockade (ICB) targeting programmed death-1 (PD-1), programmed death ligand-1 (PD-L1), and cytotoxic T lymphocyte-associated protein-4 (CTLA-4) has revolutionized cancer therapy and offered tremendous clinical benefits for patients with various types of cancer who had failed from first-line treatments1,2,3. However, only a small subset (~20–30%) of cancer patients respond to ICB therapy, and the underlying causes of insensitivity to ICB remain elusive4,5.
In the present clinical practice, PD-(L)1 expression and tumor mutation burden (TMB) serve as two major predictive biomarkers for ICB therapy, but both have obvious shortcomings. PD-(L)1 protein expression is mainly evaluated using immunohistochemistry (IHC). However, the staining result is susceptible to both spatial and temporal heterogeneity of tumor samples and subjective judgment of pathologists, which would induce an inevitable bias of assessment6. Paradoxically, some cancer patients with high PD-L1 expression unexpectedly show resistance to ICB, yet some patients with negative PD-L1 still respond to ICB therapy7.
As for TMB, which reflects the somatic mutation burden including synonymous and nonsynonymous variants of a tumor sample, has been proposed as another promising biomarker for ICB therapy over recent years8,9. For example, TMB has been shown as a favorable biomarker for response to frontline treatment with nivolumab together with ipilimumab in patients with advanced non-small cell lung cancer (NSCLC)7. However, the assessment of TMB still stagnates at the level of “quantity of mutations”, that is to say, the total number of all detected mutations10. Actually, different mutation variants contribute diversely to neoantigen generation and tumor immunogenicity. Some variants, such as EGFR mutation and KEAP1-driven co-mutations, even attenuate immune activation as well as ICB response11,12, but such mutations are still included in the calculation of TMB. Unsurprisingly, McGrail et al. reported that TMB fails to guide ICB treatment across all cancer types, especially those cancers where neoantigen load is not associated with CD8+ T cell infiltration13. Moreover, accumulating evidence indicates that technical approaches and bioinformatic interpretations vary across different sequencing platforms, which increases the difficulty of TMB harmonization14.
Apart from PD-(L)1 expression and TMB, recent studies have reported that some specific variants such as EGFR mutation, KEAP1 mutation, and POLE/POLD1 co-mutations can affect ICB response by regulating the tumor immune microenvironment and would serve as potential biomarkers to predict outcomes of immunotherapy11,12,15,16. However, the discriminative capacity of one single mutational index is limited, which is incapable of identifying more eligible patients who may benefit from ICB or not. In a word, an accurate selection of cancer patients for ICB therapy is vital but limited to the current situation of unsatisfactory biomarkers and nonuniform testing standards.
In this study, we attempted to move beyond conventional biomarkers such as PD-(L)1 and TMB, and further identify an optimum ensemble of critical mutations that are determinant of ICB response. After balancing potential confounders and removing ineligible mutations, an NSCLC-ICB cohort sequenced with the MSK-IMPACT panel was trained using multiple machine learning approaches, and a Gene mutation-based Predictive Signature (GPS) was proposed to classify overall patients into three levels with distinct treatment responses and clinical outcomes. Subsequently, GPS was validated in external independent cohorts undergoing ICB therapy, and the predictive capacity of GPS was compared with conventional predictors. Based on analyses of multi-omics data and mIHC, we comprehensively investigated the intrinsic tumor immunogenicity, extrinsic immune response, and characteristics of tumor microenvironment (TME) in lung adenocarcinoma (LUAD) across different GPS groups. Finally, we validated distinct responses of different GPS samples to ICB in an ex-vivo tumor organoid-PBMC co-culture model.
Results
A gene mutation-based predictive signature was developed to predict ICB response
The thematic design of this study is shown in Fig. 1a. Firstly, a total of 179 LUAD-ICB patients with MSK-IMPACT sequencing data and clinicopathological features were extracted from the Rizvi cohort, and the propensity score matching (PSM) algorithm was implemented to balance potential confounders including sex, age, smoking, lines of Tx, IRB, gene panel, and treatment type between responders and non-responders. After removing the synonymous and low-frequency mutations, a nonsynonymous mutation matrix of 165 samples with 47 genes was generated for data training using multiple machine learning approaches (NB, RF, SVM, LDA, and XGBoost). Finally, candidate genes that overlap in the outputs of these machine learning approaches were considered most important to ICB response. In detail, after the PSM algorithm, 55 DCB and 110 NDB patients were matched, and 14 unmatched NDB patients were excluded (Fig. 1b). Based on a feature selection method of RFE and a training framework of LOOCV, four machine learning approaches including NB, RF, SVM and LDA were combined to screen for the most effective candidate genes. The optimal ensemble of candidates was determined when the predictive accuracy of each model reached the maximum (Fig. 1c), and three genes named STK11, FAT1, and ERBB4 overlapped in the intersection of outputs. In addition, the XGBoost algorithm was performed to evaluate the importance of each gene included for training, and we observed that the three GPS-genes dominate the top positions (second, third, and fourth, respectively) in the importance ranking (Fig. 1d). A funnel graphically illustrates the screening process of the optimal candidates which compose GPS (Fig. 1e). In order to explain the impact of each mutation on ICB therapy, we further calculated the SHAP value for each candidate gene, and STK11 mutation exerts a negative influence on ICB (rank first among all the mutations), while FAT1 and ERBB4 mutations exert positive influences (Fig. 1f).

a The thematic design of this study. b After the balance of PSM algorithm, 55 DCB and 110 NDB patients were matched and 14 unmatched NDB patients were excluded. c In four machine learning models (NB, RF, SVM, and LDA), the most optimal candidates were determined when the predictive accuracy of each model reaches the maximum. d The XGBoost algorithm confirmed that the three GPS-genes dominate the top positions (second, third, and fourth) in the importance ranking. e A funnel illustrates the screening process of the optimal candidates composing GPS. f The SHAP value was calculated for each candidate gene respectively. STK11 mutation exerts a negative influence on ICB, while FAT1 and ERBB4 mutations exert positive influences. g A mutational heatmap of the three GPS-genes was depicted to display their mutation frequencies and variant details in the NDB and DCB patients. h A forest plot of odds ratio demonstrates that patients with STK11 mutation are prone to NDB while patients with FAT1 or ERBB4 tend to experience DCB, which accords with the distribution of SHAP values of the three GPS-genes. i The DCB rate progressively and significantly decreased along with the descending GPS level (p = 0.0005). j The Kaplan-Meier curve demonstrated that a significant difference of PFS was observed among different GPS groups, with G1 (GPS-pos) patients exhibiting the best prognosis (p = 0.0217). k In the training cohort, PD-L1 TPS did not correlate with ICB efficacy with a borderline significance (p = 0.0532). In contrast, GPS level significantly correlates with ICB efficacy, showing a Fisher’s exact test p-value of 0.0266. l Multivariate logistic regression analysis demonstrated that GPS serves as the only significant predictor for ICB outcome (OR = 2.627, 95% CI = 1.172–5.887, p = 0.019) after adjusting with various clinicopathological variables. *p < 0.05.
A mutational heatmap of the three GPS-genes was depicted to display their mutation frequencies and variant details in the NDB and DCB patients (Fig. 1g). Univariate logistic regression analysis was performed to calculate the OR and 95% CI for each gene, and the forest plot demonstrates that patients with STK11 mutation are prone to NDB while patients with FAT1 or ERBB4 tend to experience DCB (Fig. 1h), which accords with the distribution of SHAP values of the three GPS-genes. According to the definition of GPS mentioned above, all samples were classified into three levels: GPS-pos (G1), GPS-zero (G2), and GPS-neg (G3), and the DCB rate was progressively and significantly decreased along with the descending GPS level (p = 0.0005; Fig. 1i). Furthermore, the Kaplan-Meier curve demonstrated that significant difference of PFS was observed among different GPS groups, with GPS-pos patients exhibiting the best prognosis (p = 0.0217; Fig. 1j).
The predictive capacity of GPS was compared with conventional clinicopathological features. Fifty-nine LUAD samples with PD-L1 TPS were extracted from the training cohort, and we observed that PD-L1 TPS did not correlate with ICB efficacy with a borderline significance (p = 0.0532). In contrast, GPS score significantly correlates with ICB efficacy, showing a Fisher’s exact test p-value of 0.0266 (Fig. 1k). In the multivariate logistic regression analysis, GPS serves as the only significant predictor for ICB outcome (OR = 2.627, 95% CI = 1.172–5.887, p = 0.019) after adjusting with various clinicopathological variables including age, sex, smoking, IRB, treatment type, EGFR state, TP53/KRAS co-mutation, KEAP1 state, KEAP1/STK11 co-mutation, and TMB (Fig. 1l).
GPS was validated in an independent NSCLC-ICB cohort
The predictive capacity of GPS was subsequently tested in an independent NSCLC-ICB cohort (the Hellmann cohort treated with PD-1 plus CTLA-4 blockade), which contains 59 non-squamous (non-SQ) and 16 squamous (SQ) NSCLC patients with corresponding responses to ICB and survival follow-up. A mutation landscape of STK11, FAT1, and ERBB4 was depicted to illustrate their mutation frequencies and variant details, and we observed that STK11 is more frequently mutated in NDB patients, while FAT1 and ERBB4 are more frequently mutated in DCB patients (Fig. 2a). Likewise, DCB rate progressively and significantly decreased from GPS-pos to GPS-zero to GPS-neg in the testing cohort (Fig. 2b). After removing 7 NE patients, a stacked plot illustrated the distribution of BORs among different groups (Fig. 2c). Surprisingly, ORR of GPS-pos patients achieves 100% (7/7), while ORR of GPS-neg patients is 0% (0/9) (Fig. 2d). These results indicated that GPS retained an extremely accurate prediction for ICB therapy in the testing cohort. Expectably, a significant difference in PFS was observed among different groups (p = 0.0009; Fig. 2e).
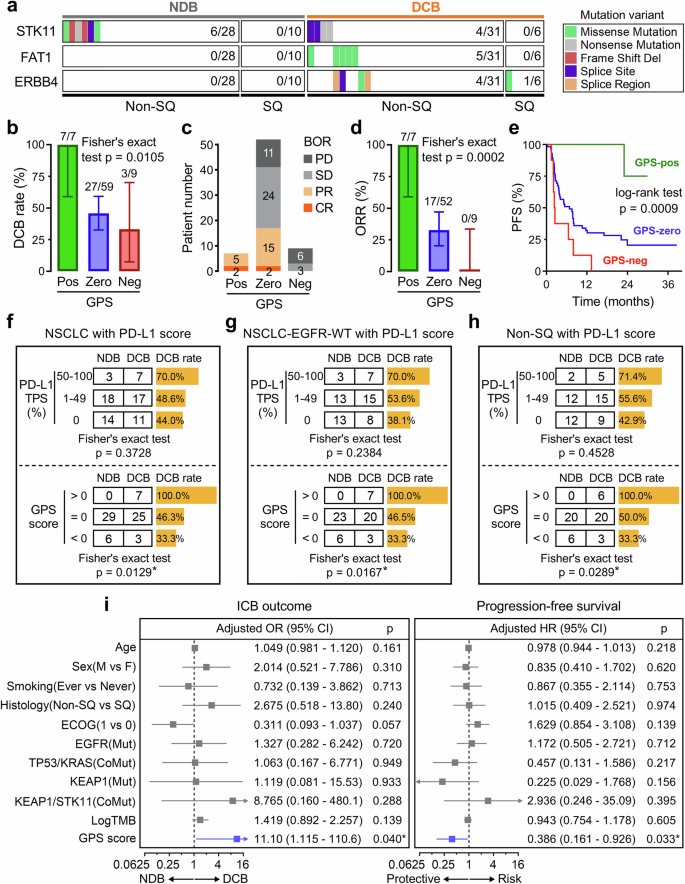
a A mutation landscape was depicted to illustrate the mutation frequencies and variant details of STK11, FAT1, and ERBB4 in an independent NSCLC-ICB cohort. STK11 is more frequently mutated in NDB patients, while FAT1 and ERBB4 are more frequently mutated in DCB patients. b The DCB rate progressively and significantly decreased from GPS-pos to GPS-zero to GPS-neg patients. c After removing 7 NE patients, a stacked plot illustrated the distribution of BOR among different groups. d ORR of GPS-pos patients achieves 100% (7/7), while ORR of GPS-neg patients is 0% (0/9). e Significant difference of PFS was observed among different GPS groups (p = 0.0009). f–h PD-L1 TPS neither significantly correlates with ICB response in all 70 NSCLC patients (p = 0.3728; upper of f), nor in the EGFR-WT NSCLC subgroup (p = 0.2384; upper of g), nor in the non-SQ NSCLC subgroup (p = 0.4528; upper of h). In contrast, GPS score was significantly correlated with ICB response in all the above-mentioned subsets: p-value of 0.0129 for all 70 NSCLC patients, 0.0167 for EGFR-WT NSCLC subgroup, and 0.0289 for non-SQ NSCLC subgroup (lower of f–h). i Multivariate regression analyses demonstrated that GPS serves as not only a significant predictor for ICB response (OR = 11.10, 95% CI = 1.115–110.6, p = 0.040) but also an independent factor for PFS (HR = 0.386, 95% CI = 0.161–0.926, p = 0.033). *p < 0.05.
Subsequently, a total of 70 NSCLC patients with PD-L1 TPS were extracted from the testing cohort for comparative analysis (5 patients were excluded because their PD-L1 staining scores are not recorded), and Fisher’s exact test showed that PD-L1 TPS neither significantly correlates with ICB response in all 70 NSCLC patients (p = 0.3728; upper panel of Fig. 2f), nor in the EGFR-WT NSCLC subgroup (p = 0.2384; upper panel of Fig. 2g), nor in the non-SQ NSCLC subgroup (p = 0.4528; upper panel of Fig. 2h). In contrast, GPS score was significantly correlated with ICB response in all the above-mentioned subsets: p-value of 0.0129 for all 70 NSCLC patients, 0.0167 for EGFR-WT NSCLC subgroup, and 0.0289 for non-SQ NSCLC subgroup (lower panels of Fig. 2f–h). Furthermore, multivariate logistic and Cox regression analyses were separately performed on GPS along with various clinicopathological variables including age, sex, smoking, histology, ECOG status, EGFR state, TP53/KRAS co-mutation, KEAP1 state, KEAP1/STK11 co-mutation, and TMB. Among all the included variables, GPS serves as not only a significant predictor for ICB response (OR = 11.10, 95% CI = 1.115–110.6, p = 0.040) but also an independent factor for PFS (HR = 0.386, 95% CI = 0.161–0.926, p = 0.033) in the testing NSCLC-ICB cohort (Fig. 2i).
To further investigate whether GPS could accurately predict responses to ICB in NSCLC subgroups, we merged the training and testing cohorts and extracted eligible patients including high-TMB and combinational ICB, respectively. We observed that GPS retained its prognostic capacity in both subgroups: p = 0.0053 for patients with TMB > 10 muts/Mb (Fig. S1a); p = 0.0002 for patients who received combinational ICB (Fig. S1b).
To exclude the possibility of randomness in the predictive ability of GPS, we randomly selected 3 genes (excluding STK11, FAT1, and ERBB4) from the remaining genes, repeated this process 100 times, and performed univariate logistic regression analysis for these 100 models in the validation set. As a result, 13 models showed significant p-values (p < 0.05). Subsequently, multivariate logistic regression analysis was conducted for the 13 models respectively (adjusted with age, sex, histology, ECOG, EGFR, etc.), and none of these models demonstrated significance (all p > 0.05). This result further confirms the superiority of the GPS signature. More details are in the Supplementary File.
Mutation landscapes of GPS genes were depicted and compared in different NSCLC cohorts
To comprehensively depict the mutational characteristics of the 3 GPS-genes in NSCLC along with different clinicopathological features such as sex, smoking status, ethnicity, and histology, data from four large-scale NSCLC cohorts [OrigiMed-NSCLC (n = 1954), OncoSG-LUAD (n = 302), MSK-NSCLC (n = 1423), TCGA-NSCLC (n = 1144)] were adopted for further investigation. OncoPrints of putative driver genes including TP53, EGFR, and KRAS, as well as 3-GPS genes were plotted to depict their mutational characteristics and variant details, and we observed that the 3 GPS-genes were mutually exclusive in each cohort (Fig. 3a–d). The hotspots of the three GPS-genes in LUAD and LUSC samples from TCGA were shown in lollipop plots (Fig. S2). Furthermore, we performed multivariate logistic regression analysis on the 3 GPS-genes in the meta-cohort (n = 4208) merged from the four cohorts. The forest plot illustrated that all the 3 GPS-genes are significantly mutated in smokers, and particularly, STK11 is more frequently mutated in the Caucasian ethnicity. In the aspect of the pathological subtype, STK11 is more frequently mutated in LUAD, while the mutation of FAT1 is more visible in LUSC (Fig. 3e).
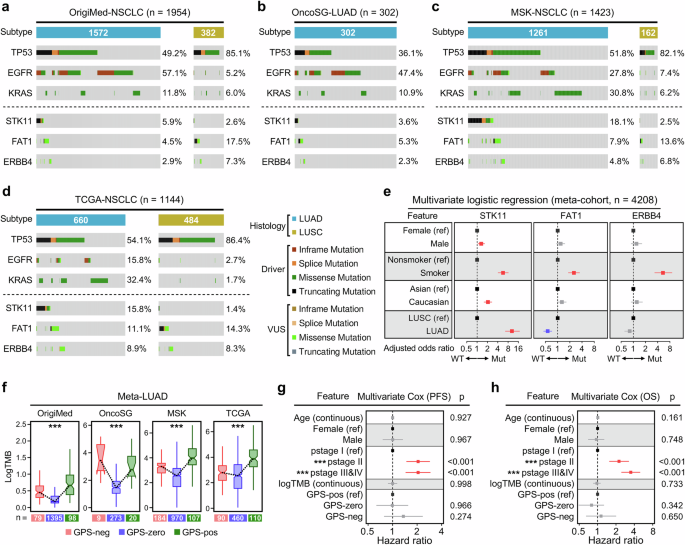
To comprehensively depict the mutational characteristics of the 3 GPS-genes in NSCLC along with different clinicopathological features such as sex, smoking status, ethnicity, and histology, four large-scale NSCLC cohorts [OrigiMed-NSCLC (n = 1954), OncoSG-LUAD (n = 302), MSK-NSCLC (n = 1423), TCGA-NSCLC (n = 1144)] were enrolled for further investigation. a–d OncoPrint of putative driver genes including TP53, EGFR, and KRAS and 3-GPS genes was plotted to depict their mutational characteristics and variant details in each cohort. e Multivariate logistic regression analysis was performed on the 3 GPS-genes in the meta-cohort (n = 4208) merged from the four cohorts. The forest plot illustrated that all the 3 GPS-genes are significantly mutated in smokers. Particularly, STK11 is more frequently mutated in the Caucasian ethnicity. In the aspect of pathological subtype, STK11 is more frequently mutated in LUAD, while FAT1 is more frequently mutated in LUSC. f Similar distribution of TMB was observed in each cohort: (i) Significant difference in TMB level was observed among distinct GPS groups; (ii) GPS-pos LUADs always display a high level of TMB, while GPS-zero LUADs display the lowest TMB; (iii) GPS-neg LUADs, which tend to be resistant to ICB therapy, always display significantly higher TMB than GPS-zero samples in each cohort, even significantly higher than GPS-pos samples in the OncoSG cohort. g, h A total of 488 LUAD patients with detailed information of age, sex, pathological stage (pstage), TMB, GPS, and survival follow-up (PFS and OS) were extracted from the TCGA project, and multivariate Cox regression analysis demonstrated that pstage acts as the only one independent risk factor for both PFS and OS. In comparison, GPS fails to exert a significant influence on prognosis of LUAD patients who did not receive ICB therapy. ***p < 0.001.
Then we compared TMB in LUAD among different GPS groups, and some similar distributions were observed in each cohort: (i) Significant difference of TMB level was observed among distinct GPS groups; (ii) GPS-pos LUADs always display a high level of TMB, while GPS-zero LUADs display the lowest TMB; (iii) GPS-neg LUADs, which tend to not respond to ICB therapy, always display significantly higher TMB than GPS-zero samples in each cohort, even significantly higher than GPS-pos samples in the OncoSG cohort (Fig. 3f). These findings indicated that TMB is just a rough indicator for ICB therapy in the pan-LUAD assessment and cannot accurately reflect the potential response to ICB in some specific subgroups.
Next, from the TCGA project, we extracted a total of 488 LUAD patients with detailed information of age, sex, pathological stage (pstage), TMB, GPS and survival follow-up (PFS and OS), and multivariate Cox regression analysis demonstrated that pstage acts as the only one independent risk factor for both PFS and OS, while GPS fails to exert a significant influence on prognosis of LUAD patients who did not receive ICB therapy (Fig. 3g, h).
GPS correlates with CD8+ T Cell infiltration and retains its predictive capacity in a pan-cancer ICB cohort
With the representative marker genes for each cancer type generated from Wilcox rank-sum test, t-SNE dimensionality reduction was applied to show the distribution and dissimilarity of all the 32 solid malignancies (Fig. 4a). Among the pan-cancer samples, the 3 GPS-genes display a similar distribution of nonsynonymous mutation with the “category I” cancer types which are more responsive to ICB therapy (Fig. 4b). In detail, an integrated mutational spectrum was plotted to intuitively display the mutation frequencies and distributions of the 3 GPS-genes in pan-cancer with “cancer categories (I or II)”, and we observed that cancer types with high mutational frequencies of the 3 GPS-genes were enriched in “category I” (Fig. 4c). STK11, the only “ICB-resistant” gene in GPS, is specifically and most frequently mutated in LUAD (arrow point) compared to other cancer types (Fig. 4c). The Cibersort algorithm was applied to estimate the relative proportions of 22 tumor-infiltrating immune cell types for each sample of “category I” cancers, and a stacked barplot and a Sankey diagram were combined to depict their immune cell distribution and classification towards different GPS groups (Fig. 4d). In addition, four algorithms including quanTIseq, TIMER, MCP-counter, and Cibersort were used to estimate the absolute infiltration of CD8+ T cell for each sample, and we found CD8+ T cell infiltration was progressively and significantly elevated from GPS-neg to GPS-zero to GPS-pos group among all “category I” cancer samples (Fig. 4e). The ssGSEA enrichment scores of 18 immunotherapy-predicted pathways and 23 steps involved in the cancer-immunity cycle were quantified for all “category I” cancer samples, and a substantial number of immunotherapy-predicted pathways and immunity-related processes showed significant differences among different GPS groups (Fig. 4f).
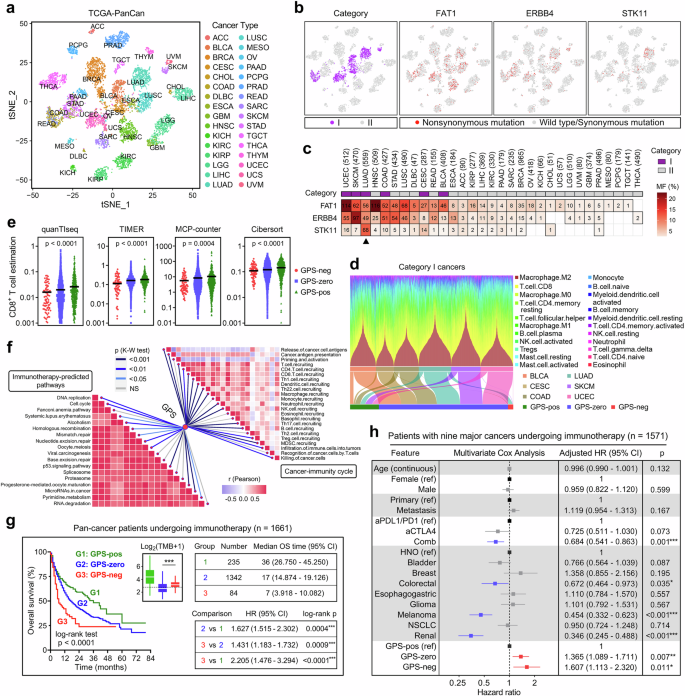
a The t-SNE dimensionality reduction was applied to show the distribution and dissimilarity of all the 32 solid malignancies. b Among the pan-cancer samples, the 3 GPS-genes display a similar distribution of nonsynonymous mutation with the “category I” cancer types which are more responsive to ICB therapy. c An integrated mutational spectrum was plotted to intuitively display the mutation frequencies and distributions of the 3 GPS-genes in pan-cancer with “cancer categories (I or II)”. STK11, the only “ICB-resistant” gene in GPS, is specifically and most frequently mutated in LUAD (arrow point) compared to other cancer types. d A stacked barplot and a Sankey diagram were combined to depict their immune cell distribution and classification towards different GPS groups. e Four algorithms demonstrated CD8+ T cell infiltration was progressively and significantly elevated from GPS-neg to GPS-zero to GPS-pos group among all “category I” cancer samples. f A substantial number of immunotherapy-predicted pathways and immunity-related processes showed significant differences among different GPS groups. g In the Samstein cohort of 1,661 patients with various cancer types who received ICB therapy, significant differences of overall survival were observed among different GPS groups, and GPS-pos patients showed the best prognosis while GPS-neg patients the worst. h A forest plot of adjusted HRs illustrated that GPS remains as an independent risk factor for prognosis with the adjustment of various potential confounders [GPS-zero vs GPS-pos: HR = 1.365 (1.089–1.711), p = 0.007; GPS-neg vs GPS-pos: HR = 1.607 (1.113–2.320), p = 0.011]. *p < 0.05; **p < 0.01; ***p < 0.001.
In the Samstein cohort of 1661 patients with various cancer types who received ICB therapy, significant differences of overall survival were observed among different GPS groups, and GPS-pos patients showed the best prognosis while GPS-neg patients the worst (Fig. 4g). However, the TMB level is significantly higher in GPS-neg patients compared to GPS-zero ones (Fig. 4g). Furthermore, after removing 89 patients with cancer of unknow primary (CUP) and one patient without age registration, multivariate Cox regression analysis was performed on the remaining 1,571 patients with nine major cancer types, and a forest plot illustrated that GPS remains as an independent risk factor for prognosis with the adjustment of various potential confounders [GPS-zero vs GPS-pos: HR = 1.365 (1.089–1.711), p = 0.007; GPS-neg vs GPS-pos: HR = 1.607 (1.113–2.320), p = 0.011; Fig. 4h].
Distinct patterns of genomic alterations and immunogenomic features were observed among different GPS groups
Next, we attempted to decipher the mutational patterns of LUAD and their relationship with GPS. A lego plot illustrates that 6 major categories of single-nucleotide variant (SNV) patterns were defined in the TCGA-LUAD cohort with 96 trinucleotide permutations (Fig. S3a), and a pie chart shows the overall mutational pattern was mainly dominated by C > T transition and C > A transversion (Fig. S3b). An optimal k factorization of 4 was selected (Fig. S3c), and four corresponding mutation signatures (smoking, APOBEC, dMMR, and aging) were identified and mapped in the COSMIC database (Fig. S3d). Using the hierarchical clustering, the TCGA-LUAD cohort was classified into four signature groups (SGs) with the relative abundance of above-mentioned mutational signatures (Fig. S3e). A comprehensive heatmap including mutation count, TiTv alteration, mutation signature, SG, tumor purity, age, gender, pT, pN, pstage, smoking status was plotted to display the distribution characteristics of these parameters among different GPS groups (Fig. 5a). Specifically, GPS-neg LUAD samples exhibited the highest tumor purity, while GPS-pos ones showed the highest levels in MSI score, HRD score, TNB, TMB and mutation abundance of the smoking signature (Fig. 5b). The cumulative proportion curves demonstrated that both clonal and sub-clonal counts were significantly elevated in the GPS-pos samples compared to GPS-neg (Fig. 5c), which indicates a higher intratumor heterogeneity (ITH) in GPS-pos LUAD.
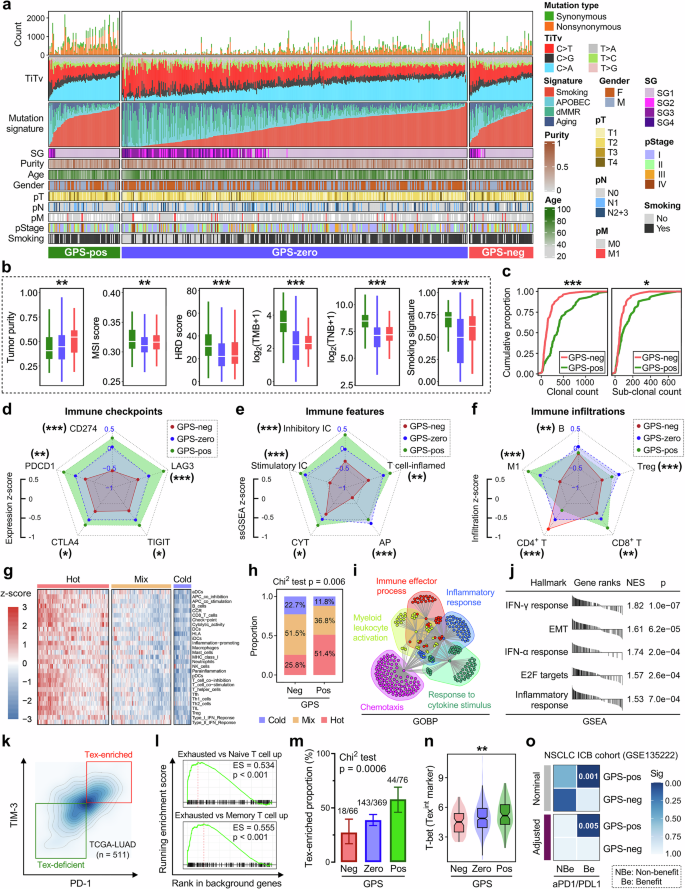
a A comprehensive heatmap including mutation count, TiTv alteration, mutation signature, SG, tumor purity, age, gender, pT, pN, pstage, smoking status was plotted to display the distribution characteristics of these parameters among different GPS groups. b GPS-neg LUAD samples exhibited the highest tumor purity, while GPS-pos ones showed the highest levels in MSI score, HRD score, TNB, TMB and mutation abundance of the smoking signature. c The cumulative proportion curves demonstrated that both clonal and sub-clonal counts were significantly elevated in the GPS-pos samples compared to GPS-neg. d–f Relevant radar charts illustrated the patterns of representative immune checkpoints expression, immune features, and immune infiltrations across different GPS groups. g The TCGA-LUAD cohort was divided into three distinct immune patterns labeled “Cold”, “Mix”, and “Hot”. h A stacked plot illustrated that “Hot” tumors occupy a proportion of 51.4% in the GPS-pos group, while the proportion of “Hot” in the GPS-neg is only 25.8% as a comparison (Chi2 test p = 0.006). i DEGs between GPS-neg and -pos groups were identified, and GOBP analysis demonstrated that these DEGs are mainly enriched in “Immune effector process”, “Myeloid leukocyte activation”, “Chemotaxis”, “Response to cytokine stimulus” and “Inflammatory response” with inherent linkage and crosstalk. j GSEA showed that top five hallmarks which change the most between GPS-neg and -pos groups are annotated as “IFN-γ response”, “EMT”, “IFN-α response”, “E2F targets” and “Inflammatory response”. k Two subsets labeled “Tex-enriched” and “Tex-deficient” were defined with the median expressions of TIM-3 (HAVCR2) and PD-1 (PDCD1) in the TCGA-LUAD cohort, l and GSEA was applied to ensure the most significant difference between the two subsets is the enrichment of exhausted T cells. m The proportion of Tex-enriched samples is progressively elevated as GPS level increases (Chi2 test p = 0.0006). n T-bet (TBX21), which is considered as a marker for the Tex intermediate (Texint) subset, shows a similar trend with Tex proportion among different GPS groups. o SubMap analysis revealed that the GPS-pos group showed a high likelihood of clinical benefit from ICB therapy using a NSCLC-ICB cohort as a reference (adjusted p = 0.005). *p < 0.05; **p < 0.01; ***p < 0.001.
We also investigated the CNV profiles of GPS-neg and -pos samples, and we found that 3q arm changes the most among all chromosome arms, which may contribute to the genomic instability-induced resistance to ICB therapy (Fig. S4a). CNV frequency with gain in red and loss in blue was shown in Fig. S4b, and clear differences of chromosomal aberrations in some specific regions were observed between the two groups. Furthermore, we calculated the focal and arm-level CNV frequencies for each sample and compared them between the GPS-neg and -pos groups, and we observed the burden of focal copy number gain is significantly elevated in the GPS-pos group (Fig. S4c).
Higher GPS score indicates higher tumor immunogenicity in LUAD
We further investigated the intrinsic tumor immunogenicity and extrinsic immune response of LUADs across different GPS groups. The expression patterns of five representative immune checkpoints (ICs) including CD274, PDCD1, CTLA4, TIGIT, and LAG3 were compared among different GPS groups, and we found GPS-pos LUADs always exhibited the highest expression level of ICs while GPS-neg the lowest (Fig. S5a). Similarly, GPS-neg LUADs showed the lowest ssGSEA scores of inhibitory ICs, stimulatory ICs, antigen presentation (AP), T cell-inflamed pattern and cytolytic activity (CYT), while the GPS-pos samples generally exhibited high levels (Fig. S5b). Relevant radar charts intuitively illustrated the average z-scores of ICs expression patterns and immunogenic characteristics across different GPS groups (Fig. 5d, e). Furthermore, the absolute infiltrations of four representative lymphocytes (B, Treg, CD4+, and CD8+ T cells) and M1 macrophages were estimated and compared among different GPS groups, and one result especially attracted attention: the infiltrating abundance of CD8+ T cell is progressively and significantly elevated as GPS level increases (Fig. S5c), indicating that GPS significantly correlates with adaptive immunity especially CD8+ T activation and infiltration. Furthermore, a relevant radar chart illustrated the infiltrating characteristics of the five immune cells across different GPS groups (Fig. 5f).
Using the unsupervised hierarchical clustering, the TCGA-LUAD cohort was divided into three distinct immune patterns labeled “Cold”, “Mix”, and “Hot” based on the ssGSEA score matrix of 29 documented immune signatures (Fig. 5g). A stacked plot illustrated that “Hot” tumors occupy a proportion of 51.4% in the GPS-pos group, while the proportion of “Hot” in the GPS-neg is only 25.8% as a comparison (Chi2 test p = 0.006; Fig. 5h). Subsequently, differentially expressed genes (DEGs) between GPS-neg and -pos groups were identified, and GOBP analysis demonstrated that these DEGs are mainly enriched in “Immune effector process”, “Myeloid leukocyte activation”, “Chemotaxis”, “Response to cytokine stimulus” and “Inflammatory response” with inherent linkage and crosstalk (Fig. 5i). Meanwhile, GSEA showed that top five hallmarks which change the most between GPS-neg and -pos groups are annotated as “IFN-γ response”, “EMT”, “IFN-α response”, “E2F targets” and “Inflammatory response” (Fig. 5j).
Two subsets labeled “Tex-enriched” and “Tex-deficient” were defined with the median expressions of TIM-3 (HAVCR2) and PD-1 (PDCD1) in the TCGA-LUAD cohort (Fig. 5k), and GSEA was applied to ensure the most significant difference between the two subsets is the enrichment of exhausted T cells (Fig. 5l). We found that the proportion of Tex-enriched samples is progressively elevated as GPS level increases (Chi2 test p = 0.0006; Fig. 5m). Particularly, T-bet (TBX21), which is considered as a marker for the Tex intermediate (Texint) subset, shows a similar trend with Tex proportion among different GPS groups (Fig. 5n). Furthermore, the SubMap analysis revealed that the GPS-pos group showed a high likelihood of clinical benefit from ICB therapy using a NSCLC-ICB cohort (GSE135222 treated with anti-PD-1/PD-L1) as a reference (adjusted p = 0.005; Fig. 5o). The above-mentioned findings demonstrated that LUAD patients with different GPS levels may display different potential responses to ICB therapy due to distinct tumor immunogenicity and immune responses such as T cell activation, effector process and Tex proportion.
Glycolytic activity of malignant cells and evolution of CD8+ Tex were jointly orchestrated by GPS levels and EGFR states in LUAD
Nine LUAD samples from GSE171145 were categorized into three subgroups according to their GPS level and EGFR state: “GPS-negative” (negGPS, one specimen), “GPS-zero/EGFR-mutated” (zeroGPS/mEGFR, five specimens) and “GPS-zero/EGFR-wild type” (zeroGPS/wEGFR, three specimens), and their scRNA-seq data were analyzed to elucidate the characteristics of tumor microenvironment (TME). A total of 21,121 cells passed quality control and remained for further study. Firstly, UMAP dimensionality reduction was used to delineate the distribution and dissimilarity of 12 cell types within TME including B, CD4+ T, CD8+ T, endothelial, epithelial, fibroblast, mast, myeloid, NK, Plasma, Tprolif, and Treg cells according to their marker genes (the first panel of Fig. 6a; Fig. S6a, b). Further, UMAP plot was used to delineate the distribution of the 12 cell types in different subgroups respectively (the rest three panels of Fig. 6a). A Circos plot summarizes the subordination relationship between the infiltrating abundance of the 12 cell types and the three GPS/EGFR subgroups (Fig. 6b). All the epithelial cells were included for CNV estimation using CD8+ T cells as references, and we found all epithelial cells can be considered malignant due to their high chromosome instability (Fig. 6c). As shown in the left panel of Fig. 6D, the proportion of malignant cells, namely tumor purity, is progressively decreased from “negGPS” to “zeroGPS/mEGFR” to “zeroGPS/wEGFR” as the proportion of CD8+ T cells gradually increases. In addition, the proportion of CD8+ Tex cells is significantly highest in the zeroGPS/wEGFR subgroup. Meanwhile, none of CD8+ Tex is observed in the negGPS subgroup (the right panel of Fig. 6d). A total of 2267 malignant epithelial cells were extracted for ssGSEA quantification of ten cancer-hallmarks (glycolysis, EMT, inflammation, angiogenesis, stemness, hypoxia, cell cycle process, DNA repair, apoptosis, and senescence) based on the UMI matrix and corresponding gene sets retrieved from MSigDB, and the XGBoost algorithm assessed their relative importance to different GPS/EGFR subgroups. A lollipop chart illustrated that glycolysis acts as the most variable hallmark among the three subgroups (Fig. 6e). Figure 6f illustrates that GPS-negative LUAD malignant epithelial cells exhibited the highest glycolytic activity, and the glycolysis ssGSEA scores and representative marker genes were further visually depicted in Fig. 6g. In addition, intercellular communications of CD8+ T and epithelial cells with other cell types in different GPS/EGFR subgroups were generated in Fig. 6h and j respectively, and we found that the negGPS sample shows the lowest inferred interactions of both CD8+ T and epithelial cells with other cell types (Fig. 6i and k).
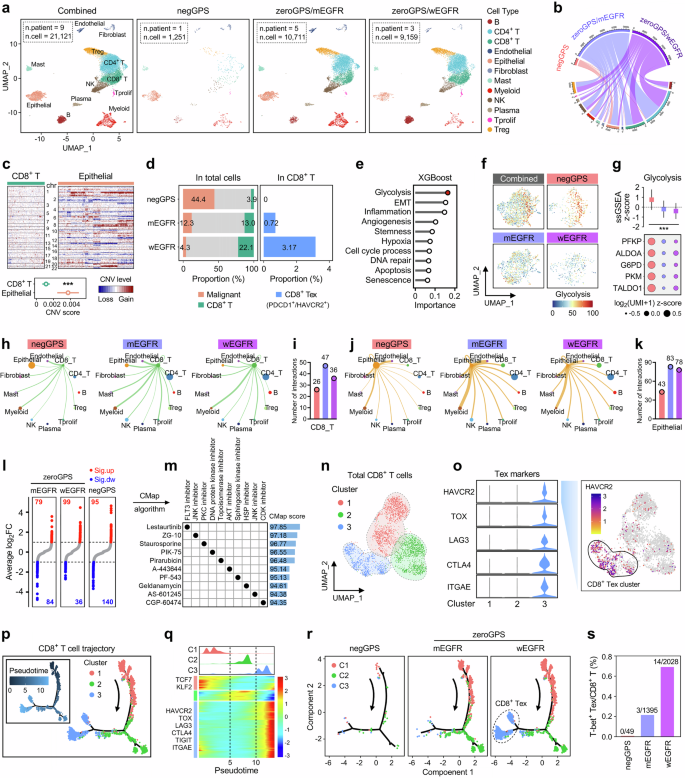
a The UMAP dimensionality reduction was used to delineate the distribution and dissimilarity of 12 cell types within TME including B, CD4+ T, CD8+ T, endothelial, epithelial, fibroblast, mast, myeloid, NK, Plasma, Tprolif, and Treg cells in different GPS/EGFR subgroups, respectively. b A Circos plot summarizes the subordination relationship between the infiltrating abundance of the 12 cell types and the three GPS/EGFR subgroups. c All the epithelial cells were included for CNV estimation using CD8+ T cells as references. d Tumor purity (proportion of malignant cells) is progressively decreased from “negGPS” to “zeroGPS/mEGFR” to “zeroGPS/wEGFR” as the proportion of CD8+ T cells gradually increases. Meanwhile, the proportion of CD8+ Tex cells is significantly highest in the zeroGPS/wEGFR subgroup. Particularly, no CD8+ Tex can be observed in the negGPS subgroup. e The XGBoost algorithm demonstrated that glycolysis acts as the most variable cancer-hallmark among malignant cells from different subgroups. f The malignant cells from the negGPS subgroup exhibited the highest glycolytic activity. g Comparisons of glycolysis ssGSEA scores and representative marker genes among different GPS groups. h, j Intercellular communications of CD8+ T and epithelial cells with other cell types in different GPS/EGFR subgroups. i, k The negGPS sample shows the lowest inferred interactions of both CD8+ T and epithelial cells with other cell types. l DEGs for malignant cells among different groups were identified with thresholds of FDR q < 0.01 and |log2FC| > 1. m CMap algorithm was applied to explore potentially applicable drugs for negGPS patients, and a dot diagram displayed top 10 promising compounds with the highest predictive scores and corresponding mode-of-actions. n A total of 3,472 CD8+ T cells were extracted for sub-clustering analysis, and three sub-clusters were identified using UMAP dimensionality reduction. o Sub-cluster 3 was defined as “CD8+ Tex cluster” due to the specifically high expressions of acknowledged Tex markers such as HAVCR2, TOX, and LAG3. p A pseudotime trajectory analysis was performed to simulate the evolution of all the CD8+ T cells (left panel), and the arrow indicated the putative developmental direction from initial T to Tex cells (right panel). q A pseudotime-dependent transcriptional pattern was depicted during the dynamic development of CD8+ T cells. r The developmental trajectory of CD8+ T cells was depicted for each GPS/EGFR subgroup respectively. s The proportion of CD8+ Texint (T-bet+) is progressively elevated from “negGPS” to “zeroGPS/mEGFR” to “zeroGPS/wEGFR”, and this gradient corresponds with the potential responses to ICB of each GPS/EGFR subgroup. ***p < 0.001.
DEGs for malignant cells within different groups were identified with thresholds of FDR q < 0.01 and |log2FC| > 1, and numbers of up-regulated and down-regulated genes for each group were shown in Fig. 6l. Subsequently, DEGs of negGPS malignant cells were submitted to the CMap algorithm to explore potentially applicable drugs for negGPS patients who are more prone to non-responders, and a dot diagram displayed top 10 promising compounds with the highest predictive scores and corresponding mode-of-actions (Fig. 6m).
A total of 3472 CD8+ T cells were extracted for further investigation of sub-clustering analysis, and three sub-clusters were identified using UMAP dimensionality reduction with a higher resolution (Fig. 6n). Sub-cluster 3 was defined as a “CD8+ Tex cluster” due to the specifically high expression of acknowledged Tex markers such as HAVCR2, TOX, LAG3, etc. (left panel of Fig. 6o), and we observed that HAVCR2, a representative marker for Tex, has a definitely high expression in the sub-cluster 3 (right panel of Fig. 6o).
Furthermore, we performed a pseudotime trajectory analysis to simulate the evolution of all the CD8+ T cells (left panel of Fig. 6p), and the arrow indicated the putative developmental direction from initial T to Tex cells (right panel of Fig. 6p). In addition, a ridgeline plot and a pseudotime heatmap were combined to depict a pseudotime-dependent transcriptional pattern during the dynamic development from sub-cluster 1 to 2 to 3 (Fig. 6q). Subsequently, the developmental trajectory of CD8+ T cells was depicted for each GPS/EGFR subgroup respectively, and we found that Tex is basically deficient in negGPS and zeroGPS/mEGFR samples, but mainly enriched in the terminally differentiated branch of CD8+ T cells from the zeroGPS/wEGFR group (Fig. 6r). Interestingly, the proportion of CD8+ Texint (T-bet+) is also progressively elevated from “negGPS” to “zeroGPS/mEGFR” to “zeroGPS/wEGFR”, and this gradient corresponds with the potential responses to ICB therapy of each GPS/EGFR subgroup (Fig. 6s). Taken together, these findings demonstrated that glycolytic activity of LUAD cells and CD8+ Tex proportion were jointly orchestrated by GPS accompanying with different EGFR states and partly account for distinct ICB responses.
Distinct anti-tumor immune responses were observed in different GPS samples in an autologous ex-vivo organoid-PBMC co-culture model
For an in-house validation, we retrospectively analyzed a total of 338 NSCLC patients (consisting of 236 LUAD and 102 LUSC) who received comprehensive therapies in the First Affiliated Hospital of Nanjing Medical University and meanwhile performed a targeted-sequencing panel test (sequenced by SimcereDx). An oncoplot depicts the mutations of STK11, FAT1, and ERBB4 in the NSCLC cohort (Fig. 7a), and barplots showed the mutation frequencies of the three genes in the different histological subtypes (Fig. 7b). Two recent representative LUAD samples (characterized with single STK11 mutation or single FAT1 mutation) were processed for mIHC analysis, and autologous fresh tumor specimen and peripheral blood were collected for tumor organoid culture and PBMC isolation. For mIHC analysis, compared to single STK11 mutation, the sample with FAT1 mutation shows a significantly higher infiltration of CD8+ T and Tex cells which are marked with CD8 and PD-1/TIM-3 respectively (Fig. 7c). As shown in the flowchart (Fig. 7d), the patient-derived tumor organoids were successfully established ex vivo (three repetitions for each patient). Meanwhile, the PBMC was cultured with exposure to tumor antigen for activation and expansion of the T cell population. Then, the prepared tumor organoids were co-cultured with autologous PBMC in 96 well U-bottom plate, and 400 μg/ml PD-1 antibody (Tislelizumab) was introduced into the co-cultured system to induce the potential anti-tumor immune response. Co-cultured for 72 h, cells were collected and stained with several cell or subpopulation markers for multiplex immunophenotyping by flow cytometry (FCM). Gating strategies for cells collected from co-culture models derived from different patients were presented in Fig. 7e, f. As expected, we observed that treatment of PD-1 antibody induced obvious anti-tumor immunity in the posGPS sample-derived co-culture model, including a significant expansion of CD8+ cytotoxic T lymphocytes (CD3+/CD8+; Fig. 7g) and effector CD8+ T cells (CD3+/CD8+/CD45RA+/CCR7–; Fig. 7h). In summary, these findings indicated that GPS-pos samples are more sensitive to PD-1 treatment and easier to induce anti-tumor immunity compared to GPS-neg samples.
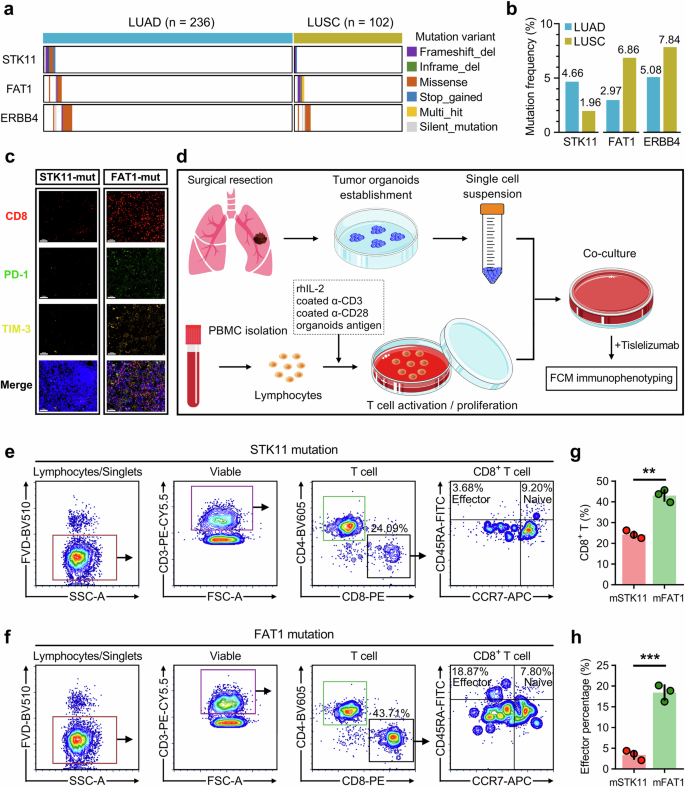
a An oncoplot depicts the mutations of STK11, FAT1, and ERBB4 in an in-house NSCLC cohort consisting of 236 LUAD samples and 102 LUSC samples. b Barplots showed the mutation frequencies of the three genes in the different histological subtypes. c Two recent representative LUAD samples (characterized with single STK11 mutation or single FAT1 mutation) were processed for mIHC analysis. Compared to single STK11 mutation, the sample with FAT1 mutation shows a significantly higher infiltration of CD8+ T and Tex cells which are marked with CD8 and PD-1/TIM-3 respectively. d A schematic diagram depicts procedures of patient-derived tumor organoids establishment ex vivo, T cell activation and expansion, tumor organoids co-culture with autologous PBMC, treatment of PD-1 antibody (Tislelizumab), and final multiplex immunophenotyping by flow cytometry (FCM). e, f Gating strategies for cells collected from co-culture models derived from patients with STK11 mutation or FAT1 mutation. g, h Treatment of PD-1 antibody induced obvious anti-tumor immunity in the GPS-pos sample-derived co-culture model, including significant expansion of CD8+ cytotoxic T lymphocytes and effector CD8+ T cells. **p < 0.01; ***p < 0.001.
Discussion
Although immune checkpoint blockade (ICB) has revolutionized cancer therapy, a durable response is still observed only in a minority of cancer patients4,5. Therefore, the selection of eligible patients for ICB treatment is vital, and there is an urgent need to identify reliable biomarkers to accurately predict a sustainable response17. However, we have to admit that a single index such as PD-L1 or TMB alone is insufficient to precisely identify patients who can benefit from ICB therapy, and more reliable biomarkers are urgently needed to guide personalized decision-making.
In this study, we identified three determinant mutations (STK11, FAT1, and ERBB4) and developed a scoring classifier named GPS to improve the predictive accuracy of ICB response. GPS outperforms conventional parameters such as PD-L1, point mutations, co-mutations, and TMB in the comparison of predictive accuracy. Furthermore, we comprehensively analyzed the mutational characteristics of the three GPS-genes across four large-scale NSCLC cohorts (OrigiMed-NSCLC, OncoSG-LUAD, MSK-NSCLC, TCGA-NSCLC), and we observed that all the three GPS-genes tend to mutate in smokers. Using drug repositioning analysis in scRNA-seq data, we identified lestaurtinib as the most promising candidate drug for STK11-mutant LUAD. Lestaurtinib is an FLT3 inhibitor and has been widely studied for its potential in treating acute myeloid leukemia with FLT3 mutations18. In addition, some recent studies revealed that lestaurtinib has the potential to inhibit solid cancers19,20,21. Particularly, STK11 is more frequently mutated in the Caucasian race. When it comes to histological subtypes, STK11 is more frequently mutated in LUAD, and FAT1 is more frequently mutated in LUSC. This finding was also validated in our in-house NSCLC cohort. These findings indicated that the frequency and distribution of determinant mutations to ICB response at least vary in race, smoking status, and pathological subtype, suggesting that in addition to mutations, these potential influencing factors should be taken into consideration when making therapeutic decisions.
STK11, also known as LKB1, is a tumor suppressor gene in LUAD. Loss of STK11 is linked to metabolic reprogramming and immune evasion in lung cancer22,23. Specifically, STK11 mutation correlates with reduced infiltration of cytotoxic CD8+ T cells and results in a non-inflamed “cold” tumor microenvironment that is resistant to ICB therapy24,25. This aligns with our findings that STK11-mutated samples are associated with unfavorable responses to ICB. FAT1 is a protocadherin and plays a pivotal role in cell adhesion and signal transduction. Deletion of FAT1 accelerates tumor initiation and malignant progression and promotes an EMT phenotype26. ERBB4, a member of the ErbB family of receptor tyrosine kinases, is involved in cell proliferation and differentiation. Currently, there is limited research on the relationship between ERBB4 mutation and tumor immunity. Two recent studies have reported a positive correlation between ERBB4 and improved anti-tumor outcomes27,28. In our study, FAT1 and ERBB4 mutations exhibit significantly higher responses to ICB, suggesting their potential in promoting an immune-supportive TME and serving as favorable biomarkers for ICB responses.
Based on analyses of multi-omics data and mIHC, we found that both intrinsic tumor immunogenicity and extrinsic immune response were enhanced in GPS-positive LUAD. Meanwhile, the glycolytic activity of malignant cells and CD8+ Tex proportion were jointly orchestrated by GPS levels and EGFR states, which partially explains the immune evasion observed in GPS-negative samples29,30. Finally, an ex-vivo tumor organoid-PBMC co-culture model was established to validate distinct responses of different GPS samples to ICB.
Our GPS classifier has several prominent advantages in practical application. Firstly, GPS is superior to conventional biomarkers such as PD-L1 and TMB in terms of predictive accuracy. Secondly, both PD-L1 and TMB are continuous variables and hard to determine optimum thresholds for a specific cancer type or patient subset, but in contrast, GPS score originates from the mutation status of three genes and is much more convenient to detect with a customized sequencing panel or SNP microarray. Undoubtedly, our strategy will avoid considerable costs and shorten the testing period, which is critical for widespread implementation in a clinical setting. In addition, assessment bias of PD-L1 and TMB is inevitable due to various causes such as technical variations, batch effects, and nonuniform standards. In comparison, the GPS score remains comparable across different testing platforms because the binary status of a specific gene, namely wild type or mutation, is easy to accurately measure regardless of other potential confounders such as some point mutations or co-mutations of uncertain significance. In a word, the GPS classifier is original, inexpensive, and easy-to-operate with accurate prediction, thereby maximizing immunotherapy efficacy and minimizing unnecessary treatments.
Some limitations of our study should be acknowledged. First, it is a retrospective analysis mainly based on public data; therefore, a prospective study is needed for further validation. Second, a certain degree of research heterogeneity exists in our study. Different ICB strategies such as monotherapy of anti-PD-(L)1 or combination with anti-CTLA-4 were implemented in different cohorts, hence, the predictive efficiency of GPS for each drug in diverse cancer types needs further investigation. Third, given the tumor heterogeneity across cancer types, the utility of GPS should be explored in other cancers where ICB therapy is applied in the real world.
In conclusion, our study provides evidence for the utility of GPS as a predictive tool for ICB therapy in NSCLC, highlighting its potential to stratify patients and guide personalized ICB strategies. Further validation in larger, independent cohorts is warranted to confirm its clinical applicability and optimize its integration into routine practice.
Methods
Data collection and preprocessing
The Rizvi cohort was used as a training set31. This cohort encompasses 240 NSCLC patients who received anti-PD-(L)1 based ICB therapy, and samples were sequenced with the MSK-IMPACT assay, which was designed for targeted sequencing of acknowledged oncogenes, tumor-suppressor genes, and members involved in oncogenic pathways considered actionable for targeted therapies. Among these NSCLC patients, 179 LUAD samples with explicit ICB responses [durable clinical benefit (DCB) or no durable benefit (NDB)] were further included for data training and model construction. To generate a high-quality and statistically unbiased input matrix, three sequential steps were arranged: Step 1: PSM algorithm was implemented to balance potential confounders including sex (female or male), age (continuous), smoking (ever or never), lines of Tx (1-7), IRB (clinical trial or commercial), gene panel (341, 410, 468), and treatment type (monotherapy or combination) between responders and non-responders, and 14 unmatched patients were excluded; Step 2: Only nonsynonymous mutations (including “Frame_Shift_Del”, “Frame_Shift_Ins”, “In_Frame_Del”, “In_Frame_Ins”, “Missense_Mutation”, “Nonsense_Mutation”, “Nonstop_Mutation”, “Splice_Region”, “Splice_Site”, and “Translation_Start_Site”) were considered effective for the generation of immunogenic neoantigens. That is to say, all synonymous mutation variants such as silent mutations were filtered out; Step 3: Low-frequency mutations that did not hold predictive significance were removed using the “nearZeroVar” function in the R software. After the above three steps, we ultimately generated a sparse matrix of nonsynonymous mutations of 165 samples with 47 genes for model training. Our established predictive model was validated in two independent ICB therapy cohorts: the Hellmann cohort and the Samstein cohort8,32. The Hellmann cohort contains 75 NSCLC patients (59 non-squamous and 16 squamous carcinomas sequenced with WES) treated with PD-1 plus CTLA-4 blockade, and clinical response parameters such as best overall response (BOR), DCB or NDB, and progression-free survival (PFS) were recorded in detail. The Samstein cohort contains 1,661 patients with various cancer types (samples were sequenced with the MSK-IMPACT assay) who received anti-PD(L)1 or CTLA-4 blockade or combination therapy, and their overall survival information was accordingly recorded. In the Samstein cohort, a total of 1,572 samples were categorized into nine main cancer types (head and neck, bladder, breast, colorectal, esophagogastric, glioma, melanoma, NSCLC, renal), while only one case was annotated as non-melanoma skin cancer and the rest 88 cases were labeled cancer of unknown primary (CUP). Four NSCLC cohorts including OrigiMed-NSCLC (n = 1954)33, OncoSG-LUAD (n = 302)34, MSK-NSCLC (n = 1423)35, and TCGA-NSCLC (n = 1144)36 sequenced with different platforms were used to display the mutational landscape of STK11, FAT1, and ERBB4, and their co-occurrence and mutual exclusivity (COME) patterns along with putative driver genes such as TP53, EGFR, and KRAS. The distribution and frequency of mutation variants were depicted with OncoPrint and all mutation variants were categorized into two main subtypes: driver variants and variants of unknown significance (VUS). Transcriptome RNA-seq data, somatic mutation profiles, copy number data, and clinical annotations of pan-cancer patients with 32 solid malignancies (ACC, BLCA, BRCA, CESC, CHOL, COAD, DLBC, ESCA, GBM, HNSC, KICH, KIRC, KIRP, LGG, LIHC, LUAD, LUSC, MESO, OV, PAAD, PCPG, PRAD, READ, SARC, SKCM, STAD, TGCT, THCA, THYM, UCEC, UCS, UVM) were obtained from The Cancer Genome Atlas (TCGA, https://gdc.cancer.gov/) using R package “TCGAbiolinks”. The RNA-seq raw data of read count or FPKM were converted to TPM and further log2-transformed for impartial comparison across different batches or cancer types. R package “GenVisR” was used to visualize the classification and distribution of somatic mutations, and R package “sigminer” was used to decipher mutational signatures based on the application of the Bayesian variant of non-negative matrix factorization (NMF) algorithm in the 96 trinucleotide contexts37. The optimal factorization k value is chosen when the magnitude of the cophenetic correlation coefficient starts to fall significantly. The extracted mutational signatures were annotated by computing cosine similarity against single base substitution (SBS) mutational catalogs retrieved in the database of Catalog of Somatic Mutations in Cancer (COSMIC). GISTIC 2.0 was used to calculate gistic scores, arm- and focal-level somatic copy number variations (SCNVs) in a tumor sample with a segment file and a marker file.
Multiple machine learning approaches for mutation data training
Multiple machine learning (ML) approaches were used to identify efficient and robust mutations for the prediction of ICB response. In brief, using the R package “caret”, the Naive Bayes (NB), Random Forest (RF), Support Vector Machine (SVM), and Linear Discriminant Analysis (LDA) algorithms based on the feature selection of recursive feature elimination (RFE) and a training framework of leave-one-out cross-validation (LOOCV) were performed to train the input matrix respectively, and the overlaps among the optimal candidates from each algorithm were considered as the ultimate signature, and we call it Gene mutation-based Predictive Signature (GPS). In addition, the eXtreme Gradient Boosting (XGBoost) algorithm was used to quantify the importance of all candidate mutations included in the training model. In order to intuitively exhibit the impact of each gene mutation on ICB therapy, we further calculated the SHapley Additive exPlanations (SHAP) values to explain how much a single mutation affects the ICB response using the R package “SHAPforxgboost”. For example, STK11-mutated LUAD samples with lower SHAP values suggested that this specific mutation tends to exert a negative influence on ICB therapy. The GPS score was established to reflect the overall impact of the three genes (STK11, FAT1, and ERBB4). We defined that the score of STK11 was assigned with −1 if STK11 was non-silently mutated; the FAT1 or ERBB4 score was individually assigned with +1 if FAT1 or ERBB4 was non-silently mutated; otherwise, the score of each gene was 0. Ultimately, the GPS score was calculated as the sum of the scores of the above-mentioned three genes, and all sequenced samples were categorized into three levels: GPS-negative (GPS score < 0), GPS-zero (GPS score = 0), and GPS-positive (GPS score > 0).
Immunogenomic analysis
For samples sequenced with WES, tumor mutation burden (TMB) was defined as the total number of nonsynonymous somatic mutations divided by the exome size of 38 Mb as an estimation or obtained from the original studies. Data of tumor neoantigen burden (TNB), clonal, and sub-clonal fraction of TCGA-LUAD samples were obtained from The Cancer Immunome Atlas (TCIA)38. Tumor purity was inferred using the ESTIMATE algorithm39, and the microsatellite instability (MSI) scores of TCGA-LUAD samples were obtained from a pan-cancer MSI landscape study40. The homologous recombination deficiency (HRD) scores and immunomodulators for inhibitory immune checkpoints (ICs), stimulatory ICs, and antigen presentation (AP) were obtained from a pan-cancer immune landscape study conducted by Thorsson et al.41. A T cell-inflamed pattern composed of 18 inflammatory genes was used to evaluate the potential response to ICB therapy42. A single-sample gene set enrichment analysis (ssGSEA) algorithm was applied to calculate the enrichment scores for each sample based on the transcriptome data and corresponding gene signatures of immunogenomic features. The cytolytic activity score (CYT) was defined as the geometric mean of GZMA and PRF1 expression43.
Estimation of immune infiltration and evaluation of immune features
Four TME inferring algorithms named TIMER44, MCPcounter45, Cibersort46, and quanTIseq47 were respectively applied to estimate the absolute infiltration abundance of CD8+ T cells in “category I” cancers defined previously, which include BLCA, CESC, COAD, LUAD, SKCM and UCEC, and these cancer types are more responsive to ICB therapy13. Furthermore, the relative proportions of 22 tumor-infiltrating immune cell types were estimated using the Cibersort method, which represents a benchmark for the quantification of immune cell infiltration in bulk samples. Using the unsupervised hierarchical clustering method, the TCGA-LUAD cohort was divided into three distinct immune patterns labeled “Cold”, “Mix”, and “Hot” based on the ssGSEA z-scores of 29 immune signatures48. Differences in the ssGSEA enrichment scores of 18 immunotherapy-predicted pathways and 23 steps involved in the cancer-immunity cycle were analyzed among different GPS groups49,50.
Identification and enrichment analysis of differentially expressed genes (DEGs)
DEGs were identified between different groups with a threshold of the false discovery rate (FDR) q < 0.01 based on the RNA-seq data of read counts and R package “DESeq2”. Analyses of gene ontology biological process (GOBP) and GSEA were performed to reveal the enrichment pathways of DEGs with corresponding gene sets retrieved from the Molecular Signatures Database (MSigDB)51.
Single-cell RNA-sequencing analysis
One single-cell RNA-sequencing (scRNA-seq) dataset (GSE171145)52 which contains nine LUAD samples with mutational annotation was used for single-cell transcriptome analysis with R package “Seurat”. Cells with the following criteria were considered passing the quality control: (i) mitochondria UMI rate of <40%; (ii) median gene number*0.5 < nFeature_RNA < median gene number*2; (iii) nCount_RNA > 2000. Ultimately, a total of 21,121 eligible cells remained for further study. Principal component analysis (PCA) was performed based on the scaled data of the top 2000 highly variable genes (HVGs) to reduce dimension, and the “Harmony” algorithm was applied to eliminate the batch effect. The top 20 principals were extracted for UMAP construction, and DEGs or marker genes were identified using the “FindAllMarkers” function with Wilcox rank-sum test. Using R package “infercnv”, the SCNVs of epithelial cells were estimated using putative non-malignant cells as reference. The “CellChat” package was applied to characterize intercellular communications across different cell types. Furthermore, we performed a single-cell trajectory analysis using Monocle2 algorithm with default parameters. Cells were arranged into a developmental trajectory which was segmented with different branch fates to imitate their evolution.
Drug repositioning with connectivity map (CMap) analysis
CMap is a resource that uses transcriptional expression data to probe the relationships between disease, cell physiology, and therapeutics53. DEGs of GPS-negative malignant cells relative to the others were submitted to the CMap algorithm to explore potential targets and applicable drugs for GPS-negative patients who are not sensitive to ICB therapy. The top 10 compounds with the highest predictive scores and their corresponding mode-of-actions (MoAs) were shown in a dot diagram.
Analysis of T cell exhaustion (Tex)
TCGA-LUAD samples with high expressions of both PD-1 (PDCD1) and TIM-3 (HAVCR2) are defined as Tex-enriched samples, otherwise Tex-deficient. T-bet (TBX21) is considered a marker gene for the Tex intermediate (Texint) subset, which re-engages some effector biology and prompts individuals to respond to ICB therapy54. In scRNA-seq analysis, a total of 3472 CD8+ T cells were identified and further included for pseudotime analysis. A terminally differentiated cluster with especially high expressions of HAVCR2, TOX, LAG3, CTLA4, and ITGAE was regarded as the CD8+ Tex cluster. Furthermore, the CD8+/PD-1+/TIM-3+/T-bet+ T cells were defined as the CD8+ Texint subpopulation55.
Patient sample and multiplex immunohistochemistry (mIHC) staining
All samples were collected following ethical standards and received approval from the ethics committees of the affiliated hospitals of Nanjing Medical University (approval number: 2023-SRFA-450 in The First Affiliated Hospital of Nanjing Medical University; [2023]KY024-06 in The Affiliated Changzhou No. 2 People’s Hospital of Nanjing Medical University). All procedures performed in this study involving human participants comply with principles in the Declaration of Helsinki. Informed consent was obtained from all participants or their relatives, and all personal information was kept confidential and used for research purposes only. The formalin-fixed paraffin-embedded (FFPE) tissues (3–4 μm) were prepared from resected tumors and baked for 1 h at 60 °C in an oven, then dewaxed with xylene and rehydrated through graded concentrations of ethanol. Following rehydration, the sections were fixed for 20 min at room temperature (RT) in 10% neutral buffered formalin, placed in Tris-EDTA buffer (pH 9.0) and microwaved for 1 min at a high power followed by an additional 15 min at a low power for antigen retrieval. The slides were then blocked after cooling at RT and incubated with the primary antibody at RT for 10 min. The slides were washed thrice with TBST and then incubated with Opal Polymer HRP Ms + Rb at RT for 10 min. Before incubation with Opal Signal Generation, the slides were washed with TBST thrice. Microwave treatment, blocking, primary antibody incubation, introduction of Opal Polymer HRP, and tyramide signal amplification (TSA) were repeated. The primary antibodies (CD8, 1:500, ZA0508; PD-1, 1:500, 86163S; TIM-3, 1:1000, 45208S), HRP-conjugated secondary antibodies (WAS1201100), and fluorophore-conjugated TSA (TSA570, WAS1003050; TSA520, WAS1002050; TSA650, WAS1005050) were repeated until all markers were labeled. Finally, the slides were added with DAPI in the dark for 5 min at RT, and the slides were cleaned with distilled water and TBST before being mounted. The Pannoramic MIDI II scanner was used to take images, which were then processed using SlideViewer (version 2.6).
Ex vivo experiments
Fresh tumor specimens were collected and immediately placed on ice after surgical removal. The samples were stored in sterile tubes containing primary sample stocking buffer and transported to the laboratory on ice. The samples were transported to the lab within 24 h to ensure quality. Upon arrival, the tumor tissues were washed with primary sample washing buffer for 30 min at room temperature on an orbital shaker. After that, the tumor tissue was diced into small pieces and digested using enzymatic digestion buffer in a shaker at 37 °C for 30–50 min. Cell suspensions were vigorously pipetted to ensure complete dissociation and passed through a 70 μm cell strainer. Then the cell suspensions were resuspended in Matrixgel (40183ES10, Ceturegel® Yeasen Biotechnology) and seeded in 6-well plates. For the first 48 h, primary cells were cultured in lung cancer organoids culture medium with ROCKi (10 µM, ROCK inhibitor, only for the first 24 h), and the fresh medium without ROCKi was changed every 48 h. More details on the preparation of tumor-reactive T cells and co-culture of tumor organoids and PBMCs could be found in a previously published article56.
Flow cytometry analysis
For FACS staining, cells were washed and resuspended at the concentration of 106 cells/ml in PBS for Fixable Viability Dye (FVD) staining (Thermo Fisher, 65-0866-14, 65-0867-14, 65-0863-14 or L34957) at 15 min in room temperature. Subsequently, cells were pre-incubated with the blocking buffer for 15 min and subsequently stained with FACS antibodies for surface staining at 4 °C 20 min, then cells were fixed and permeabilized. After that cells were intracellular stained at room temperature for 20 min. Flow cytometry analysis and cell sorting were performed on a FACSAria II flow or a FACSCelesta cytometer (BD Biosciences). Data were analyzed by FlowJo (version 10.4; FlowJo LLC). Each assay was performed in triplicate.
Additional bioinformatic and statistical analyses
In addition to the response defined by RECIST (CR, PR, SD, and PD), ICB efficacy was defined as DCB (CR/PR or SD that lasts >6 months) or NDB (PD or SD that lasts ≤6 months), and objective response rate (ORR) was defined as the proportion of patients with CR or PR. Patients who did not progress and were censored before 6 months of follow-up were considered not evaluable (NE). The Subclass Mapping (SubMap) algorithm was applied to evaluate the expression similarity between independent datasets, and the significance was evaluated with the Bonferroni correction57. Heatmaps were generated to depict the distribution of pathological parameters, mutation frequencies, and feature ssGSEA scores using R package “complexheatmap”. The 95% confidence interval (CI) for the population rate was assessed using the Clopper-Pearson method. Pearson correlation analysis was performed to evaluate the correlation between two variables subject to normal distribution. Student’s t-test or one-way analysis of variance (ANOVA) was used to analyze differences among different groups with variables subject to normal distribution, otherwise Mann-Whitney U test or Kruskal-Wallis test. Categorical variables among different groups were compared using the chi-square test or Fisher’s exact test. The Kaplan-Meier analysis was used to plot survival curves, and the log-rank test was performed to evaluate survival differences. Univariate or multivariate logistic regression analysis was used to evaluate the odds ratio (OR) and 95% CI for each variable, and multivariate Cox regression analysis was performed to evaluate the risk significance of each variable for survival. A two-sided p-value or FDR q value less than 0.05 was considered statistically significant. All analyses were performed in the GraphPad Prism 8.0 and R 4.2.1 software.
Responses