Interpretable multimodal transformer for prediction of molecular subtypes and grades in adult-type diffuse gliomas

Introduction
Adult-type diffuse gliomas are the most common malignant primary brain tumors1. The 2021 World Health Organization (WHO) classification of central nervous system tumors simplifies the classification of adult-type diffuse gliomas2. Unlike the 2016 WHO classification which assigned multiple entities in adult-type diffuse gliomas, the current classification simplifies adult-type diffuse gliomas to only three types based on isocitrate dehydrogenase (IDH) mutation and 1p/19q codeletion status: IDH-mutant and 1p/19q-codeleted oligodendroglioma (herein oligodendroglioma), IDH-mutant astrocytoma, and IDH-wildtype glioblastoma2,3. The new classification emphasizes different prognoses within each type according to its biological behavior2, while grading continues to have an impact on survival in adult-type diffuse gliomas4,5.
Genetic testing is costly and time-consuming and may not be available in resource-limited regions, while tissue insufficiency in biopsy may lead to incomplete diagnosis. Thus, a complementary noninvasive method to predict molecular information is crucial for predicting prognosis and planning the treatment strategy. Magnetic resonance imaging (MRI) features have been shown to be predictive of molecular subtyping and tumor grading6,7,8,9,10. Leveraging this insight, deep learning (DL)-based studies using MRI have been conducted for molecular subtyping and/or grading of adult-type diffuse gliomas. However, most DL studies were conducted based on the previous 2016 WHO classification, resulting in the inclusion of tumors outside the family of adult-type diffuse gliomas in the current 2021 WHO classification11,12,13,14,15. Furthermore, prior DL studies employed traditional convolutional neural networks (CNNs)11,12,13,14,15. Despite its widespread application, CNNs often fail to capture the global context of MRI data due to its inherent local processing nature. Thus, an advanced DL method that can effectively interpret the intricate spatial characteristics in glioma may be imperative.
A key advancement in DL has been the emergence of transformers16, which overcame the limitations of sequential data processing with an innovative self-attention mechanism that allows for dynamic encoding of relationships between all parts of the input data simultaneously. Initially making a significant impact in the field of natural language processing (NLP), the application of transformers has been extended to image processing17,18,19,20,21. Consequently, the success of transformer models in both vision and language domains has catalyzed a broader exploration of their capabilities, particularly in multimodal research. This includes significant applications within the medical field by integrating imaging with clinical data using transformer architectures22. We hypothesized that multimodal-based transformer models may provide a robust and interpretable DL framework for molecular subtyping and grading of adult-type diffuse gliomas.
In this study, we aimed to develop and validate a robust and interpretable multimodal transformer, glioma multimodal transformer (GlioMT), for molecular subtyping and grading of adult-type diffuse gliomas, in accordance with the 2021 WHO classification.
Results
Patient characteristics
The clinicopathological characteristics of the institutional set (n = 1053), The Cancer Genome Atlas (TCGA) external validation set (n = 200), and the University of California, San Francisco (UCSF)23 external validation set (n = 477) are summarized in Table 1. Although the distribution of sex was not statistically different between the three cohorts (P = 0.265), age (P = 0.001), molecular subtype (P < 0.001), CNS WHO grade (P < 0.001), and MGMTp methylation status (P < 0.001) showed significant differences between three cohorts, reflecting the heterogeneity of real-world datasets.
MR image processing
To accurately predict molecular subtypes and tumor grading using MRI data, we conducted a series of experiments to determine the optimal number of input slices for training our model. The results of the ablation study are presented in Supplementary Fig. 1. To identify the most optimal number of slices, a vision transformer17, ViT-base, was used for the ablation study. For prediction of IDH mutation and 1p/19q codeletion status, the model was trained and evaluated using the top 75% of axial slices by tumor area, achieving the highest area under the curves (AUCs) of 0.965 and 0.786, respectively, on internal validation. For the tumor grade prediction task, the model was trained and evaluated using the top 50% of slices, achieving the highest AUC of 0.925 on internal validation. Consequently, the top 75%, 75%, and 50% of slices according to tumor area were used for the prediction of IDH mutation, 1p/19q codeletion, and tumor grade, respectively, to train and validate all DL models.
Comparison of model performance between CNN, visual transformer, and GlioMT
The performances of the DL models are summarized in Supplementary Tables 1–3 for IDH-mutation, 1p/19q codeletion, and tumor grade prediction tasks, respectively. The model with the highest average AUC across two external validation sets was selected as the top-performing model. Table 2 provides a summary of the top-performing models from each DL model category—CNN, Visual Transformer, and GlioMT—along with the corresponding ROC curves and statistical analyses in Fig. 1. Across all prediction tasks, GlioMT consistently outperformed the other models, followed by visual transformer and then CNN.

Receiver operating characteristic (ROC) curves for IDH mutation status, 1p/19q codeletion status, and tumor grade prediction tasks on the (a) TCGA and (b) UCSF external validation sets. For tumor grade, which involves three classes (Grade 2, Grade 3, and Grade 4), ROC curves were generated using a one-vs-rest approach, followed by macro-averaging to produce the final curves. (c) AUC comparison for each task across both TCGA and UCSF validation sets. (d) AUC comparison for each grade (Grade 2, Grade 3, and Grade 4) using a one-vs-rest approach across the TCGA and UCSF validation sets. Error bar represents the 95% confidence interval (CI). To compare the statistical differences in AUCs, DeLong’s test was used for the binary classification tasks (IDH mutation and 1p/19q codeletion), and the bootstrapping method was employed for the multiclass classification task (tumor grade).
In the prediction of IDH mutation status, GlioMT achieved AUCs of 0.915 (95% CI 0.869–0.955) on TCGA and 0.981 (95% CI 0.968–0.991) on UCSF, with statistically significant differences compared to both CNN (P < 0.01 on TCGA and P < 0.001 on UCSF) and visual transformer (P < 0.05 on both TCGA and UCSF). The visual transformer and CNN showed lower performance than GlioMT, with AUCs of 0.901 and 0.862 on TCGA and 0.971 and 0.950 on UCSF, respectively.
For the prediction of 1p/19q codeletion status, GlioMT achieved AUCs of 0.854 (95% CI 0.770–0.929) on TCGA and 0.806 (95% CI 0.646–0.946) on UCSF. Although there were no statistically significant differences compared to visual transformer (P > 0.05), GlioMT still showed higher AUCs, with visual transformer achieving AUCs of 0.831 on TCGA and 0.737 on UCSF. CNN showed the lowest performance, with AUCs of 0.773 on TCGA (P < 0.05) and 0.740 on UCSF (P = 0.381).
For the prediction of tumor grade, GlioMT achieved the highest AUCs of 0.862 (95% CI 0.806–0.912) on TCGA and 0.960 (95% CI 0.942–0.977) on UCSF. The visual transformer showed lower performance than GlioMT, with AUCs of 0.840 on TCGA (P = 0.254) and 0.947 on UCSF (P < 0.05), while CNN showed the lowest performance with AUCs of 0.793 on TCGA (P < 0.001) and 0.932 on UCSF (P < 0.001). As shown in Fig. 1d, GlioMT outperformed both CNN and visual transformer in most one-vs-rest comparisons across tumor grades. Although the visual transformer slightly outperformed GlioMT for grade 2 in TCGA, GlioMT demonstrated superior performance in all other comparisons, including grades 3 and 4.
Effectiveness of clinical data encoding using BERT
The performance of our GlioMT model, which utilizes pre-trained BERT for clinical data encoding, is summarized in Supplementary Table 4. Compared to alternative methods such as simple concatenation, a single fully connected (FC) layer, and trainable embeddings, GlioMT achieved the highest average AUC (0.896) across multiple tasks, including IDH mutation status, 1p/19q co-deletion status, and tumor grade classification, on external validation sets (TCGA and UCSF).
Interpretability of GlioMT
Figure 2a–c shows attention maps for correctly predicted cases according to IDH mutation status, 1p/1p codeletion status, and tumor grade using GlioMT. The attention maps generated by GlioMT distinctly highlighted tumor areas, reflecting the specific imaging signature that assists in prediction. For example, GlioMT focused on the T2-FLAIR mismatch sign for a patient with IDH-mutant astrocytoma, whereas for a patient with IDH-wildtype glioblastoma, GlioMT focused on ring-enhancing areas (Fig. 2a). In 85.9% of accurately classified cases, the model demonstrated a precision score exceeding 0.5, indicating that the majority of the attention region was correctly focused within the tumor regions.
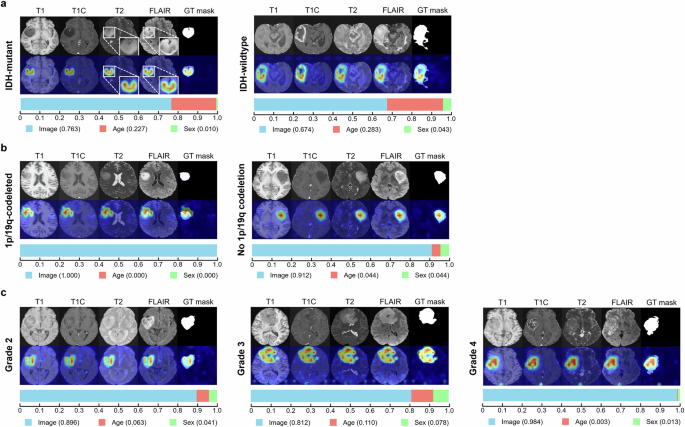
The figure shows results for three tasks: a IDH mutation status, b 1p/19q codeletion status, and c tumor grade in TCGA and UCSF external validation sets. For each task, the upper row shows the attention maps, while the lower row shows the modality contribution scores. Attention maps focused on the relevant tumor region including both enhancing and non-enhancing areas, for all correctly predicted patients. Notably, in a 36-year-old male with IDH-mutant astrocytoma (a, left), the attention map accurately highlighted the tumor with “T2-FLAIR mismatch sign”. Modality scores varied between patients; in overall showing that imaging features have the highest contribution score on the model’s predictions, followed by age and sex.
Supplementary Fig. 2 shows attention maps for misclassified cases that were confused by focusing on regions outside of the tumor area in prediction of IDH mutation status, 1p/1p codeletion status, and tumor grade, respectively. In 42.4% of misclassified cases, the precision score was below 0.5, indicating that nearly half of the misclassified cases were confused by focusing on regions outside the tumor area. In the remaining 57.6% of misclassified cases in which the model accurately activated the tumor region (precision score above 0.5), accurate prediction of IDH mutation status, 1p/1p codeletion status, and tumor grade was also confusing to radiologists (Supplementary Fig. 3). For example, in majority (69.0%) of misclassified cases in predicting IDH mutation status in which the model accurately activated the tumor region, tumors lacked characteristic imaging findings according to IDH mutation status; IDH-mutant tumors showed enhancement with necrosis while IDH-wildtype tumors lacked enhancement and/or necrosis, which made prediction of IDH mutation status also difficult to radiologists.
Furthermore, the contribution score of each modality is presented as a horizontal bar graph below each attention map in Fig. 2. These scores quantify the relative importance of different input features—imaging features, age, and sex—in the model’s predictions. Across all tasks, imaging features consistently had the highest impact on the model’s predictions, followed by age and sex.
Discussion
Our study introduces a novel DL model utilizing a GlioMT that integrates imaging and clinical data for molecular subtyping and grading in adult-type diffuse gliomas according to the 2021 WHO classification. Our GlioMT model demonstrated superior performance in predicting adult-type diffuse gliomas compared to CNNs and visual transformers. Specifically, GlioMT achieved AUCs of 0.915–0.981, 0.806–0.854, and 0.862–0.960 for prediction of IDH mutation status, 1p/19q codeletion status, and tumor grade, respectively, indicating generalizable results with a potential for clinical application. To the best of our knowledge, this study is the first to 1) apply the updated 2021 WHO classification criteria in a DL model for molecular subtyping and grading of adult-type diffuse gliomas, 2) demonstrate the utility of GlioMT integrating imaging and clinical data, which shows its superiority and robustness over conventional CNNs and visual transformers in large external validation sets, and 3) providing interpretability to clinicians not only by attention maps via images but also by showing contribution of imaging and clinical data to the model’s final prediction.
Previous studies applying DL for the prediction of molecular subtypes and/or grades of adult-type diffuse gliomas have encountered limitations in study design11,12,13,14,15. Histological grade 2 or 3 IDH-wildtype diffuse gliomas, not otherwise specified (NOS) or not elsewhere classified (NEC), which no longer belong in the family of adult-type diffuse gliomas in the 2021 WHO classification2, were included in datasets of previous studies according to the 2016 WHO classification. Moreover, there are no longer grade 2 or grade 3 IDH-wildtype gliomas in the 2021 WHO classification2. This inclusion of outdated classifications led to incorrect ground truth labels that are not aligned with the current classification. Additionally, several prior works focused solely on the prediction of IDH mutation status11,13,20. Furthermore, the lack of external validation in several studies undermines confidence in the robustness of their findings in real-world clinical settings11,12.
Of note, previous DL studies with external validation have relied on models based on traditional CNNs for the classification of gliomas12,13,14,15, with suboptimal performances than our study, and external validation was only performed on TCGA datasets. A previous study based on ImageNet-pretrained VGG-16 showed an accuracy of 81.6% on TCGA dataset in predicting IDH mutation and 1p/19q codeletion status on a 2-tiered approach based on conventional T1, T2 and T1C images14. Although this study also reported a higher accuracy of 85.7% for predicting IDH mutation and 1p/19q codeletion status in a 3-class approach when including diffusion-weighted images, caution should be taken in interpreting this result because external validation was not possible in this sub-study due to lack of diffusion-weighted images14. Another study implementing a 3D CNN reported AUCs of 0.90, 0.85, and 0.81 for prediction of IDH mutation status, 1p/19q co-deletion status, and tumor grade, respectively15. Meanwhile, another study added clinical information (age) and radiomics features as numeric inputs to a ResNet model in addition to imaging data, showing an AUC of 0.86 for prediction of IDH mutation status13. Inherent limitations remain in the DL architecture of these prior researches; CNN models suffer from the intrinsic locality limitation of convolution operations, potentially missing broader contextual information necessary for understanding complex glioma characteristics17,24. Moreover, while some studies have incorporated additional data types, the integration often remains suboptimal, limiting the model’s comprehensive predictive capability24.
Addressing these limitations, our study introduces a novel multimodal transformer, GlioMT, leveraging the latest breakthrough in DL. GlioMT effectively integrates and analyzes data from multiple modalities, overcoming the inherent limitations of CNNs. As transformers employ a self-attention mechanism that allows for a more global understanding of the data, a detailed evaluation of glioma with its widespread infiltrative nature is available2, enabling more nuanced understanding of the tumor characteristics that are critical for accurate classification. In addition, a transformer-based LLM for clinical data processing was applied for integration of clinical data. Previous CNN-based studies often converted clinical data into numeric inputs or learnable parameters to be fused with image features at the feature level13,24,25. However, this approach has limitations in effectively capturing the intricate relationships between different data modalities. In this study, a transformer-based LLM, namely BERT26, was used for encoding clinical data such as age and sex by converting them into text form (e.g., “A magnetic resonance image of an old patient”). The strength of BERT encoding can be attributed to its pre-training on vast amounts of text data, enabling it to transform clinical data into rich embeddings that align effectively with high-dimensional MRI features. By incorporating clinical data into imaging data, which are known to vary among different molecular subtypes and grades of gliomas27, GlioMT achieves higher performance compared to traditional CNNs and visual transformers.
Previous studies with CNN-based models often yielded attention maps that show broad, non-discriminative activation regions, which fail to offer detailed explainability14,15. In contrast, our approach employs a specialized attention visualization methodology28 designed for transformer architectures, resulting in more detailed and insightful attention maps. Specifically, the attention maps of GlioMT precisely target relevant tumor areas, enhancing our understanding of the factors influencing the model’s predictions. In misclassified cases, 42.4% of the attention maps focused not only on tumor areas but also on non-tumor areas, and 16.7% completely failed to focus on the tumor areas, which can serve as a warning to clinicians to prevent to blindly trust the model’s prediction in such cases. Such detailed interpretation not only validates the diagnostic decisions of our model but also demonstrates the potential to provide reliable results to clinicians for clinical application. Additionally, our study provides scores indicating the contribution of clinical and imaging modalities to the model’s predictions. These scores offer local interpretability to clinicians; a clearer picture of how different information influences the model’s outputs in each case. Of note, our results show that imaging features overall have the most significant contribution to the model’s predictions, followed by age and sex, which is similar to our decision-making process in clinical setting.
Our study has several limitations. First, our study was based on a 2D rather than a 3D DL model, chosen for the greater availability of ImageNet pre-trained models and computational efficiency. While this choice aligns with our focus on using readily accessible and computationally manageable models, 3D models may be superior in capturing volumetric spatial relationships within the brain, potentially enhancing diagnostic accuracy. Future studies should explore the integration of 3D DL models to understand the complex geometries of tumors more effectively. Second, our study utilized conventional MRI sequences without integrating advanced imaging sequences such as diffusion-weighted or dynamic susceptibility contrast imaging. The goal of this study was to utilize routine clinical sequences and provide robustness of the model, which requires the use of external validation sets. However, the absence of advanced imaging sequences in most of these external sets limits their inclusion in our study. Nonetheless, additional quantitative imaging has been shown to highlight unique features according to molecular subtype and grade of adult-type diffuse gliomas27, and should be incorporated in the future to improve the performance.
In conclusion, GlioMT, integrating imaging and clinical data, showed robust performance in molecular subtyping and grading of adult-type diffuse gliomas according to the 2021 WHO classification. The interpretability provided by attention maps has the potential to improve the accuracy of clinical decision-making.
Methods
Study design and ethical approval
Requirement for patient consent was waived owing to the retrospective study design. This study was approved by the Institutional Review Board of Severance Hospital (No. 4-2024-0040). The study was conducted in accordance with the Declaration of Helsinki.
Patient population
Between June 2005 and December 2022, 1226 patients with diffuse gliomas were included in the institutional developmental set. The inclusion criteria were as follows: 1) diffuse gliomas confirmed by histopathology, 2) known IDH mutation and 1p/19q codeletion status, and 3) aged >18 years. The exclusion criteria were as follows: 1) histological grade 2 or 3 IDH-wildtype diffuse gliomas which did not undergo testing of genetic parameters (TERTp, EGFR gene, or chromosome +7/−10), thereby diagnosed as IDH-wildtype diffuse glioma, NOS (n = 114)29, 2) histological grade 2 or 3 IDH-wildtype diffuse gliomas which were negative to all three genetic parameters (TERTp, EGFR gene, and chromosome +7/−10), thereby diagnosed as for IDH-wildtype diffuse glioma, NEC (n = 21)29, 3) presence of H3 K27M alteration, leading to a diagnosis of diffuse midline glioma, H3 K27-altered (n = 36), and 4) preprocessing error (n = 2). A total of 1053 adult-type diffuse glioma patients were included in the institutional set. For training and internal validation, the institutional set was randomly split into 80% (n = 841) and 20% (n = 212), respectively.
For external validation, identical criteria were applied to patients from TCGA (http://cancergenome.nih.gov) and UCSF sets23, resulting in the inclusion of 200 and 477 adult-type diffuse glioma patients, respectively. Figure 3 shows the patient flowchart.

This figure shows the patient flowchart in the institutional, TCGA external validation, and UCSF external validation sets.
Molecular classification
All patients were diagnosed according to the 2021 WHO classification2. IDH1/2 mutation and 1p/19q codeletion status was assessed. The presence of H3 K27M mutation was evaluated in tumors with midline location. Targeted next-generation sequencing (NGS) was performed by Illumina TruSight Tumor 170 panel in the institutional set since 201530. In the institutional and TCGA external validation sets, 20 patients and 18 patients with histological grade 2 or grade 3 IDH-wildtype gliomas with either TERTp mutation, EGFR gene amplification, or chromosome +7/−10 were classified as IDH-wildtype glioblastoma according to their molecular profiles, respectively.
MRI protocol
Preoperative MRI was performed using a 3.0-T MRI scanner (Achieva or Ingenia, Philips Healthcare, Best, the Netherlands) equipped with an eight-channel sensitivity-encoding head coil in the institutional setting. The imaging protocol included T1-weighted (T1) turbo spin-echo images with inversion recovery (TR, 2000 ms; TE, 10 ms; TI, 1000 ms; FOV, 240 mm; section thickness, 5 mm; matrix, 256 × 256), T2-weighted (T2) turbo spin-echo images (TR, 3000 ms; TE, 80 ms; FOV, 240 mm; section thickness, 5 mm; matrix, 256 × 256), and T2-weighted fluid-attenuated inversion recovery (FLAIR) images (TR, 10,000 ms; TE, 125 ms; TI, 2500 ms; FOV, 240 mm; section thickness, 5 mm; matrix, 256 × 256). Additionally, three-dimensional postcontrast T1-weighted (T1C) turbo field echo images (TR, 9.8 ms; TE, 4.6 ms; FOV, 240 mm; section thickness, 1 mm; matrix, 224 × 224) were acquired after intravenous injection of gadolinium-based contrast (0.1 mL/kg of gadobutrol, Gadovist; Bayer Schering Pharma, Berlin, Germany).
Image processing
Image preprocessing involved isovoxel resampling to 1 mm3, N4 bias field correction, and co-registration of T1, T2, and FLAIR images to T1C images, utilizing ANTs. Skull stripping was performed using HD-BET31. Signal intensity was z-score normalized.
Figure 4a illustrates the workflow for determining the input image of the DL network. Initially, automatic tumor segmentation was performed to identify the tumor region. For this purpose, nnU-Net32 was employed, which achieved a Dice score of 0.95 on our previous institutional dataset33. The predicted masks representing the total tumor (including contrast-enhancing tumor, non-enhancing tumor, and necrosis) were utilized to facilitate the automatic selection of axial slice images containing significant tumor regions. Subsequently, axial slices of tumor mask were sorted according to the area of tumor, and only a subset of slices with substantial tumor areas were selected. To utilize the input slices that are beneficial for training, an ablation study was conducted for each task: prediction of IDH mutation status, 1p/19q codeletion status, and tumor grade. From this subset of selected slices, a single slice was then randomly chosen for each patient. Finally, each chosen slice from T1, T1C, T2, and FLAIR was concatenated into a single input image with dimensions of 224 × 224 × 4.

a Workflow for slice selection from multiparametric MRI (T1/T1C/T2/FLAIR) using nnU-Net to predict tumor regions. The top n% of slices by tumor area are selected, with a single slice randomly chosen per patient for model training. Traditional deep learning models based on b CNN and c visual transformer. d Overview of GlioMT for classification of adult-type diffuse gliomas according to the 2021 WHO classification. MR images are encoded using a visual transformer, while clinical data are processed by LLM-based text encoder, specifically BERT. During training, all layers of the BERT model are frozen.
CNNs, visual transformers, and GlioMTs
The DL-based models for classifying molecular subtypes and grading adult-type diffuse gliomas are shown in Fig. 4b–d. For the processing of input images, either CNNs, which employ convolution and pooling layers, or visual transformers, which utilize self-attention layers, were used (Fig. 4b, c). Five representative CNN models (such as ResNet34, DenseNet35, or EfficientNet36) and two representative visual transformers (such as Vision Transformer [ViT]17 or Swin Transformer18), were implemented.
In our GlioMT (Fig. 4d), a visual transformer was used for multiparametric image processing. In addition to imaging data, clinical data such as age and sex were included as a part of the input data and converted into well-designed prompts (e.g. a magnetic resonance image of a male patient). Since the sparse age distribution in our dataset could lead to the model struggling with insufficient data for a particular age range, we dichotomized age with an age threshold of 45 years which maximizes the standard chi-square statistics, into young and old age. Supplementary Fig. 4 illustrates the P values of chi-square tests between two age groups, with age thresholds ranging from 25 to 70 years, according to IDH mutation status, 1p/19q codeletion status, and tumor grade. The clinical prompts were encoded with BERT26, which is a widely used transformer-based large language model (LLM). To integrate imaging and clinical features, a multimodal fusion module was employed, consisting of a series of attention blocks based on the ViT17. Finally, a multi-layer perceptron head was used to classify the IDH mutation status, 1p/19q codeletion, and tumor grade.
A comparative analysis was conducted across three different categories of DL models: traditional CNNs, visual transformers, and our GlioMT. During the evaluation, each axial slice in the subset selected through image processing for each patient was individually assessed and the final probability for each patient was calculated by averaging the predicted probabilities from these slices. The image encoder (CNNs and Transformers) was implemented using the “timm” library (v0.9.2), and the text encoder BERT using the “transformers” library (v4.36.1). To enhance performance, image encoders were initialized with ImageNet pre-trained weights. Since these networks were originally designed for three-channel RGB images, the first layer’s weights were extended to accommodate four-channel MRI data by adding the R channel and scaling the weights by a factor of 3/4. All models and training codes were implemented using Python 3.9 and PyTorch 1.13.12.
Effectiveness of clinical data encoding using BERT
To demonstrate the effectiveness of clinical data encoding using BERT in GlioMT, a comparative ablation study was conducted on three different clinical data encoding methods, as illustrated in Supplementary Fig. 5a–c. First, multiparametric images were encoded through a visual transformer to generate “MRI Features.” The three comparative methods include: (a) converting clinical data into simple numerical values for concatenation with MRI features, (b) using a single fully connected (FC) layer to encode clinical data into features with the same dimension as the MRI features, and (c) dichotomizing the clinical data, as in our proposed approach, followed by encoding it into features with the same dimension as the MRI features using trainable embeddings. To ensure a fair comparison across all experiments, a specific random seed was fixed to control the randomness in data augmentation and model weight initialization.
Interpretability of GlioMT
To demonstrate the interpretability of GlioMT, which enables understanding the decision-making process of DL models, a rollout-based attention visualization method28 was utilized to generate attention maps for GlioMT. Similar to the use of various interpretability techniques in CNN-based studies to understand feature importance37,38,39, the rollout-based attention visualization method28 provides detailed insights into the focused areas of attention layers in transformers, making it suitable for the inherent characteristics of transformer architectures. To quantitatively evaluate whether the attention map focuses on the tumor, the attention map was binarized using a threshold of 0.5, and the precision score was calculated by comparing it to the tumor mask predicted by nnU-Net32. The precision score indicates the proportion of correctly identified tumor area within the binarized attention map compared to the total tumor area. Additionally, to quantify the contribution of each modality (imaging data, age, and sex) to the model’s predictions, modality contribution scores were calculated using Layer-wise Relevance Propagation37.
Statistical analysis
The diagnostic performance was measured in terms of the area under the curve (AUC), accuracy, sensitivity, specificity, and receiver operating characteristic (ROC) curve. For binary classification problems, the optimal threshold for predicted probabilities was determined on the internal validation set using Youden’s index; an identical threshold was then applied to external validation. For the multiclass performance assessment in predicting tumor grades, AUCs were computed using a one-vs-rest approach. The overall AUC, sensitivity, and specificity were macro-averaged across tumor grades. The clinicopathological characteristics were compared between the institutional set, TCGA set, and UCSF set using one-way analysis of variance (ANOVA) for continuous variables, and the chi-square test for categorical variables. Delong’s test was used for comparing the AUCs across different DL models and calculating 95% CIs for the binary classification tasks (IDH mutation and 1p/19q codeletion). For the multiclass classification tasks (tumor grade), bootstrapping with 5000 iterations was employed. Statistical significance was set at P < 0.05. All statistical analyses were performed using R (version 4.4.1) and Python (version 3.9.16).

Responses