Intracellular assembly of supramolecular peptide nanostructures controlled by visible light
Main
Molecular self-assembly plays an indispensable role in cellular life, but the complex dynamics and transience of the diverse supramolecular species within the assembly process impede their structure–activity correlation in biology1,2,3,4,5,6,7,8,9. In most synthetic systems, precursor molecules undergo defined chemical transformations into active monomers that propagate into various supramolecular intermediates, eventually achieving different nanostructural outcomes. Challenges arise because many parameters such as temperature, lifetime, local concentration of the monomers and intermediates, as well as the nucleation threshold, direct the self-assembly pathways and the subsequent growth of the nanostructure10,11,12. The heterogeneity of aggregates is further amplified by the formation of kinetically driven, metastable structures on encountering different intracellular environments. Therefore, synthetic approaches that control the supply of active monomers to produce different assembly states and dynamics is necessary to provide the critical breakthrough in correlating aggregation-based function in living cells.
The control over molecular assemblies is well developed in cell biology, where optogenetic techniques show the transformative use of light to manipulate protein clustering, neuronal function, gene expression and signalling13,14,15,16,17,18,19,20. These seminal studies have inspired us to create a synthetic parallel in which photochemistry is adapted to control supramolecular chemistry and structure formation in living cells. In this respect, photocleavable protecting groups (PPGs) can be designed such that molecules of interest can be released on demand in a spatiotemporal manner, with applications ranging from drug delivery to self-healing smart materials21,22. Among various PPGs, coumarin derivatives have been broadly applied as a result of their multifunctional chemical versatility with adaptable wavelengths and tunable photolysis rate23.
However, in living cells, the selection of a photochemical system is only one of many aspects that dictates the assembly of supramolecular monomers. Depending on the internalization, transport and localization of the molecules, the crowded intracellular environment imposed by the high density of biomacromolecules also influences reaction and assembly kinetics24,25. As these parameters exist only in living cells and cannot be studied in model systems, in situ technologies such as the use of phasor-fluorescence lifetime imaging (phasor-FLIM) are invaluable for tracking dynamic self-assembly processes in real time using time-resolved fluorescence26. By combining photocleavable, self-assembling peptides with phasor-FLIM imaging technology, we aim to understand how assembly is controlled, promoted and propagated in living cells.
In the present study, we present the construction of two amphiphilic pro-assembling peptide sequences (1 and 2) protected by a visible light-sensitive, coumarin-based photocage. The peptides are designed to undergo visible light-induced molecular and supramolecular transformations to form nanofibres within living cells (Fig. 1). Cell internalization of the caged peptides is facilitated by a cell-penetrating, oligo-arginine peptide sequence. The photolysis reaction and subsequent conversion of the stable photocaged monomers (1 and 2) into the ‘active’ self-assembling peptides (1a and 2a) was realized inside living cells on irradiation with 505-nm visible light. In contrast to previously reported caged peptides that respond to endogenous stimuli, such as pH or reactive oxygen species, the irradiation time now controls the uncaging reaction where monomer generation and local concentration regulate the assembly kinetics. A near-infrared (NIR) fluorophore has been attached to peptide 2 to track assembly dynamics, in particular the transition of different molecular and supramolecular species, using the recently reported phasor-FLIM technology. The propagation of these species into nanostructures is subsequently validated by correlative light-electron microscopy (CLEM). We show that an intracellular assembly strategy encoding the molecular information for light sensitivity and fibril formation enables the control and visualization of different assembly states and dynamics of self-assembling peptide monomers, intermediates and nanofibres in living cells. Direct imaging of the complex assembly processes within cells correlates with their impact on cell viability.
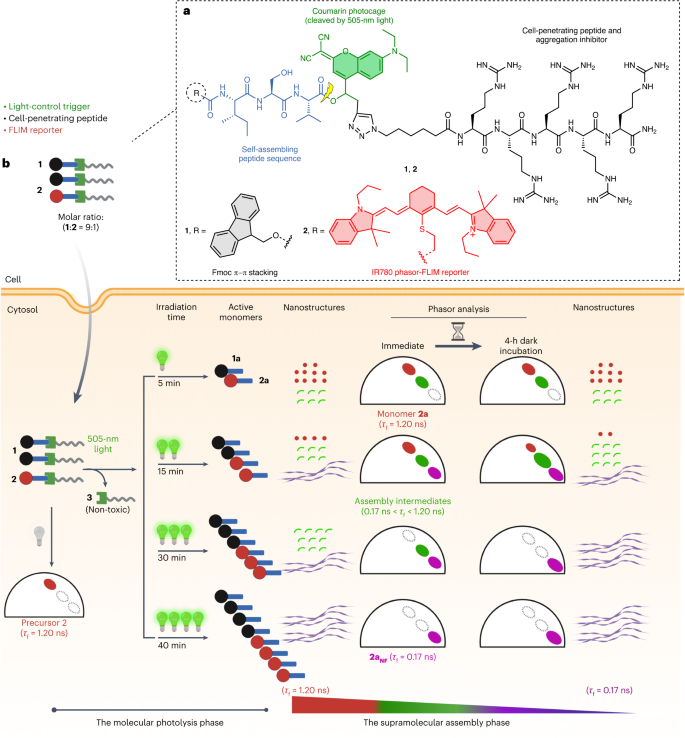
a, Chemical design of the photocaged pro-assembling peptides 1 and 2 in which the formation of intracellular nanofibres can be controlled by light. b, Pro-assembling peptides 1 and 2 (τf = 1.20 ns) entered A549 cells via ‘Arg5’-mediated endocytosis. Visible light serves as an external stimulus to transform 1 and 2 into self-assembling peptides 1a and 2a on irradiation. The irradiation time enables control of the generation and concentration of assembling monomers 1a and 2a, which, in turn, regulate the assembly states and dynamics within living cells. The assembly dynamics are monitored as photons change between τf = 1.20 ns and τf = 0.17 ns during assembly. Figure 1b created with BioRender.com.
Synthesis of the photocaged pro-assembling peptides
The photocleavable pro-assembling peptides (1 and 2) have been designed to contain four main functionalities: (1) the self-assembling peptide sequence (Fmoc-Ile-Ser-Val, Fmoc-ISV) carrying (2) the IR780 chromophore as a phasor-FLIM reporter for intracellular imaging of the aggregation process; (3) the red-shifted coumarin photocage that can be cleaved by 505-nm visible light; and (4) a cell-penetrating peptide comprising five arginine (Arg5) residues, the polarity of which simultaneously prevents assembly and facilitates cellular uptake before irradiation. The design of self-assembling peptide, Fmoc-ISV, is based on short peptide amphiphiles known to assemble into amyloid-like nanostructures27,28. The proposed mechanism involves the initial internalization of the pro-assembling precursors (1 and 2) into cells supported by the Arg5 sequence. In the present study, a co-assembly strategy is essential because 2a, the photolysis product of precursor 2, is unable to self-assemble into nanofibres, even at a high concentration of 100 µM (Supplementary Fig. 24). After exposure to 505-nm light, the photocage is cleaved, leading to the release of the active self-assembling monomers (1a and 2a), which co-assemble into NIR-emitting nanofibres. The irradiation time allows control of the generation of the self-assembling monomers (1a and 2a) and their respective local concentrations. In this way, different assembly states, as well as nanostructure formation, can be regulated within cells.
The synthesis of precursors 1 and 2 involves a combination of solid-phase peptide synthesis (SPPS) and solution-phase methods. The photocage is synthesized in solution through multiple reaction steps (Supplementary Fig. 1a), whereas the peptide components, including Fmoc-ISV and the Arg5 peptide, are synthesized using SPPS (Supplementary Fig. 1b,c). The conjugate of the photocage and Arg5 is synthesized in solution via a copper-catalysed azide–alkyne cycloaddition reaction (Supplementary Fig. 1d), followed by coupling with Fmoc-ISV using diisopropylcarbodiimide and 4-(dimethylamino)pyridine (Supplementary Fig. 1e). Finally, all protecting groups are cleaved in the presence of 95% trifluoroacetic acid to obtain precursors 1 and 2, characterized by liquid chromatography–mass spectrometry (LC–MS) and matrix-assisted laser desorption ionization (MALDI)–MS (Supplementary Figs. 20–23). The synthesis details are included in the supporting information (Supplementary Fig. 1).
The photolysis reaction was optimized by LC–MS (Fig. 2b). In NH4HCO3 buffer, pH 7.4 (20 mM), precursor 1 remained stable for 24 h in the absence of light (Supplementary Fig. 25). On light irradiation at 505 nm, 9.2 mW cm−², the ester bond of 1 (25 µM) was hydrolysed in aqueous buffer (NH4HCO3 buffer, pH 7.4, 20 mM), resulting in the formation of self-assembling peptide 1a and the released photocage-Arg5 3. After 5 min, there was a notable consumption of 1, accompanied by the emergence of two new peaks with retention times (tR) of 6.91 min and 3.52 min, respectively, both exhibiting m/z values consistent with the chemical formula of 1a (m/z = 540.4 for [1a + H]+ and 562.3 for [1a + Na]+) and 3 (m/z = 636.2 for [3 + H]2+ and 1,270.9 for [3 + H]+) (Fig. 2c). Extending the irradiation time to 20 min leads to a 98% conversion from 1 to 1a whereas an irradiation of 30 min resulted in the complete disappearance of 1 (Fig. 2b–d). No further discernible effect on the photolysis process was observed if irradiation times were prolonged to 40 and 50 min (Fig. 2b,d). To demonstrate that precursor 2 can also be cleaved by 505-nm light, the corresponding photolysis reaction kinetics were measured. The results indicated that the ester bond of 2 (2.5 µM) was completely hydrolysed within 10 min of irradiation at 505 nm, resulting in the formation of peptide 2a (Supplementary Fig. 26).
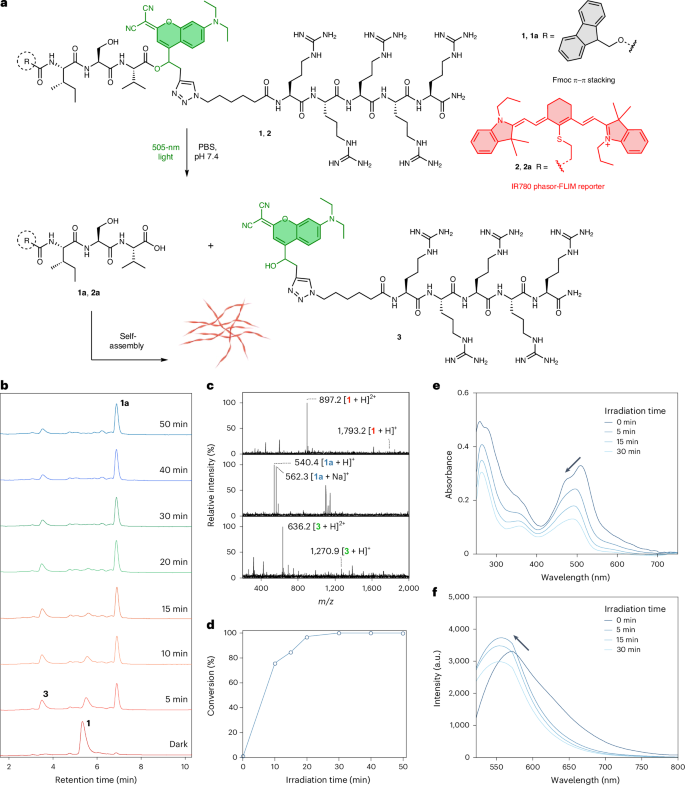
a, Molecular design and reaction scheme for all chemical transformations of photocaged peptides 1 and 2 (25 μM, ratio of 1:2 = 9:1) that assemble into nanofibres (‘optoaggregates’). b, LC–MS kinetic analysis for the photolysis reaction of 1 (25 μM) in NH4HCO3 buffer, pH 7.4 (20 mM) on irradiation with 505-nm visible light. c, Convoluted MS spectra in the LC–MS analysis for compound 1 (tR = 5.12–5.73 min) and corresponding products 1a (tR = 6.73–7.11 min) and 3 (tR = 3.23–3.75 min) after photolysis. d, The correlation between light-irradiation time and conversion. The connecting line is drawn only to aid visualization of the trend. e, The changes of UV/Vis absorption spectra of 1 (25 μM) in PB, pH 7.4 (50 mM) after irradiation for 5, 15 or 30 min. f, Changes in the fluorescence spectra of 1 (25 μM) in PB, pH 7.4 (50 mM) after irradiation for 5, 15 or 30 min.
Source data
The optical properties associated with the photolysis and self-assembly processes were then investigated. Precursor 1 exhibited an absorption band centred at 505 nm, characteristic of the coumarin chromophore. With increasing irradiation time, the absorption of the coumarin chromophore gradually decreased, accompanied by a slight hypsochromic shift (Fig. 2e). This shift can be attributed to the self-assembly behaviour of 1a in solution. The emission of the coumarin chromophore on the peptide initially exhibited a slight increase on irradiation, probably as a result of its release from the peptide29. However, this was followed by a gradual decrease, which can be attributed to the self-assembly of 1a in solution (Fig. 2f).
Light-induced assembly profile and phasor-FLIM calibration
The light-induced self-assembly was initially studied by dynamic light-scattering (DLS) analysis, which featured peptide aggregation over the irradiation times (Fig. 3d). Without irradiation, a 25 µM solution of 1 in phosphate buffer (PB), pH 7.4 (50 mM) remained soluble and exhibited no aggregation (Fig. 3d). After 1 min, nanometre-sized aggregates were already formed that steadily increased and, during the 10 min of irradiation, led to the formation of micrometre-sized aggregates (‘optoaggregates’). The nanostructure and morphology of the optoaggregates were imaged by time-dependent transmission electron microscopy (TEM) using similar irradiation times. Distinct nanofibre structures with increasing fibre densities occurred proportional to the irradiation time. Initially, a small number of fibre fragments were observed after 5 min of irradiation. This was followed by a notable increase in fibre quantity after 15 min of irradiation (Fig. 3a,b). With prolonged irradiation to 30 min, the formation of denser nanofibre networks became apparent. Time-dependent, cryogenic, high-resolution TEM images confirmed the formation of similar nanostructures in solution on light exposure (Fig. 3c). Droplet-type structures that appear at 5 min could possibly hint at the transient presence of liquid–liquid phase separation in the initial stage of assembly30.
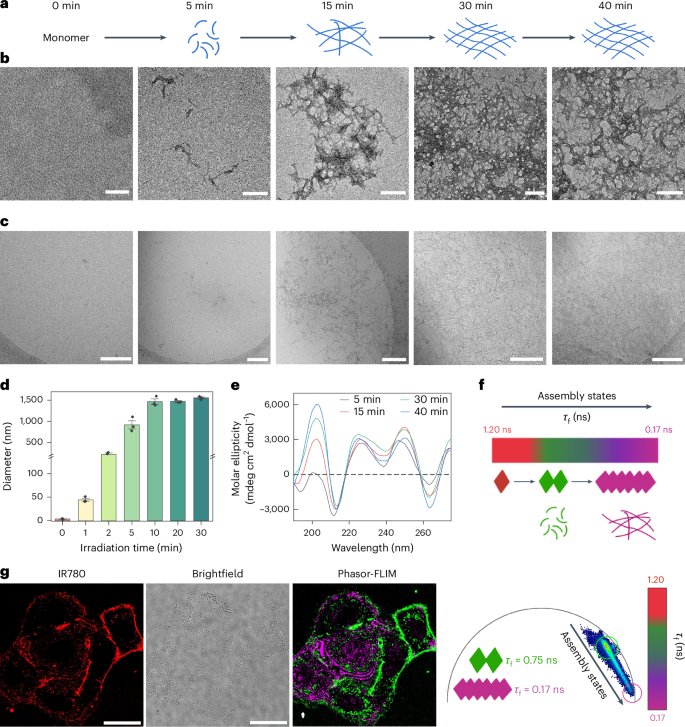
a,b, Scheme of light-induced peptide assembly (a) and corresponding TEM images (b) of co-assembled (25 μM, ratio of 1:2 = 9:1) nanofibres formed at different irradiation times. Scale bar, 200 nm. c, Corresponding, cryogenic, high-resolution TEM images of the co-assembled nanofibres (25 μM) in PB, pH 7.4 (50 mM) over time. Scale bar, 200 nm. d, Dynamic light-scattering kinetics analysis for the light-induced nanostructure formation of 1 (25 μM) in PB, pH 7.4 (50 mM) over time. Changes in diameter were measured. Data are presented as mean values ± s.e.m. (n = 3, independent experiments). e, CD kinetics analysis of 1 in a mixture of PB, pH 7.4 (100 mM) and MeOH (0.5 vol.%) over irradiation time. f, Schematic illustration of the assembly dynamics from monomers to assemblies, leading to decreased fluorescence lifetimes (1.20 ns to 0.75 ns to 0.17 ns) on oligomerization and formation of the optoaggregates. g, Fluorescence lifetime analysis of assembly progression out of A549 cells using phasor analysis. Two major species can be identified showing τf values of 0.75 ns (oligomers) and 0.17 ns (larger assemblies, optoaggregates)
Source data
Time-dependent circular dichroism (CD) analysis revealed an increasing signal at 203 nm (Fig. 3e), indicating the formation of ordered β-sheet secondary structures, which increased during irradiation. In addition, the characteristic ππ* transition of the Fmoc group at 265 and 274 nm correlated positively with irradiation time, suggesting that the Fmoc group participates in the assembly. However, in the absence of irradiation, precursor 1 showed no obvious signal between 180 nm and 280 nm (Supplementary Fig. 27). To validate the co-assembly behaviour, co-assembled nanofibres (1a + 2a, mol. ratio = 9:1) were prepared in Dulbecco’s modified Eagle’s medium (DMEM) and imaged using confocal laser-scanning microscopy (CLSM), revealing the presence of NIR-emitting fibres, confirming the successful co-assembly process (Supplementary Fig. 28). To calibrate the fluorescence lifetime profile under physiological conditions, the nanofibres were assembled in DMEM and transferred on to a culture of A549 lung adenocarcinoma cells. Herein, 0.1 equiv. of peptide 2 with an IR780 dye as a phasor-FLIM reporter was used for co-assembly. The free molecule control was accomplished using non-irradiated 1 + 2 (mol. ratio = 9:1) in A549 cells. Phasor-FLIM analysis revealed that free molecules exhibited a fluorescence lifetime (τf) of 1.20 ns before irradiation (Supplementary Fig. 29), whereas the assembled nanofibres revealed a τf ranging from 0.75 ns to 0.17 ns, representing different assembly states (Fig. 3f,g).
Visualization of intracellular nanofibre formation
The Arg5-induced endocytosis into A549 lung alveolar adenocarcinoma cells was visualized using CLSM (Supplementary Fig. 30). Different incubation times with 25 µM 1 + 2 (mol. ratio = 9:1), ranging from 2 h to 6 h, were tested to determine the optimal conditions for cellular uptake. After 4 h of incubation, peak cellular uptake was observed, as evidenced by both the green fluorescence from the coumarin dye and the NIR emission of IR780 (Supplementary Fig. 30). To acquire an understanding of the assembly progression, we performed corresponding imaging using phasor-FLIM. Cells were pre-treated with 1 + 2 for 4 h, followed by washing off the excess extracellular precursors. Subsequently, the cells were subjected to irradiation (505 nm, 9.2 mW cm−2) for 5, 10, 15, 30 and 40 min, followed by immediate phasor-FLIM imaging (Fig. 4d–i).
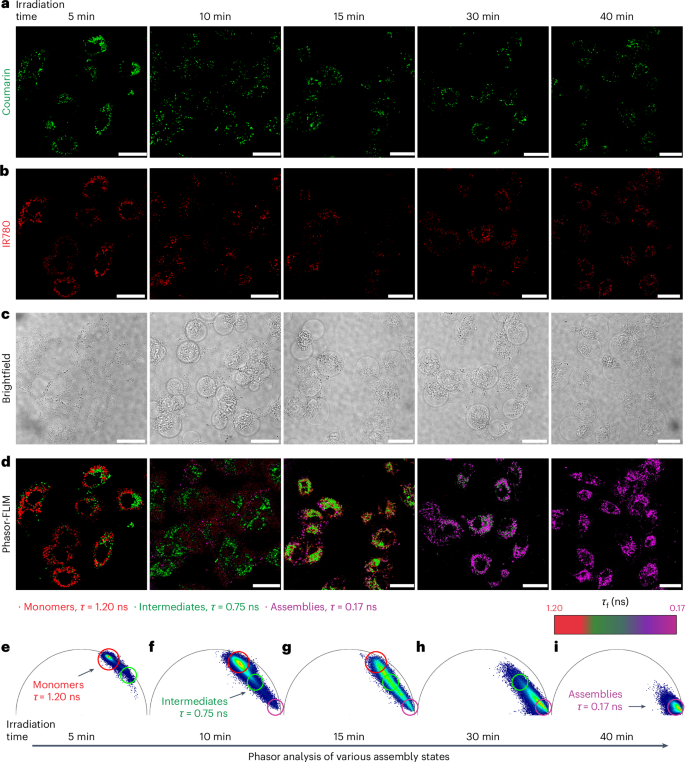
a–d, Time-dependent fluorescence of coumarin (a) and IR780 (b), brightfield (c) and phasor-FLIM images (d) of A549 cells treated with 1 and 2 (25 μM, ratio of 1:2 = 9:1). e–i, Phasor maps of A549 cells treated with 1 and 2 (25 μM, ratio of 1:2 = 9:1) on different irradiation times, including 5 (e), 10 (f), 15 (g), 30 (h) and 40 min (i). Arrows indicate that the irradiation results in chemical photolysis and the nanostructure formation and growth with a concomitant change in the phasor-FLIM. Scale bars, 25 μm.
Source data
The progression of aggregation over time can be tracked by the shifting of photon populations between two characteristic phasors on the phasor plot, representing monomers and assemblies (Fig. 4e–i). In the absence of light, the precursors exhibited a homogeneous, single-component fluorescence decay with τf = 1.20 ns (Supplementary Fig. 31). On irradiation, the photocaged peptides (1 and 2) generated the corresponding active monomers (1a and 2a), which subsequently self-assembled into nanofibres exhibiting a decreased τf. After 5 min of irradiation, the phasor analysis showed intracellular photons exhibiting fluorescence lifetimes of 1.20 ns > τf > 0.75 ns, indicating that the major component was still monomers and the first traces of assembled species were observed (Fig. 4e). Supported by TEM and cryo-TEM images, after 5 min of irradiation, only monomers were produced at a low concentration and the formation of oligomers occurred, but no further progression into mature nanofibres was observed (Fig. 3b,c). When increasing the irradiation time to 10 min, morphological changes of the cells were detected (Fig. 4c) along with the emergence of a new photon population with τf = 0.17 ns, indicative of the formation of nanofibres (Fig. 4f). Extending the irradiation time to 15 min led to a further consumption of the generated monomers and the concomitant formation of oligomers and assemblies (Fig. 4g). On 30 min of irradiation, the pool of intracellular precursors was fully consumed and the corresponding population of photons shifting to τf = 0.17 ns increased considerably, implying the progression of most supramolecular species into assemblies (Fig. 4h). Finally, irradiation for 40 min resulted in the complete transformation of the photocaged peptides into assemblies (Fig. 4i). With 50% irradiation intensity (4.6 mW cm−2), phasor-FLIM analysis indicated a slower assembly kinetics (Supplementary Fig. 33), where the onset of assembly was shown to require at least 30 min of irradiation. The complete consumption of monomers was observed only after 40 min of irradiation. This observation demonstrated the versatility of the photoresponsive system to regulate the intracellular assembly processes. By correlating IR780 fluorescence to electron microscopy via CLEM, the presence of nanofibres was detected at 15 min of irradiation (505 nm, 9.2 mW cm−2) (Fig. 5 and Supplementary Fig. 39). These nanofibres were found within cytosol and vesicular structures resembling endosomes (Fig. 5b–g), which are in line with the endocytosis process induced by the cell-penetrating peptide31.
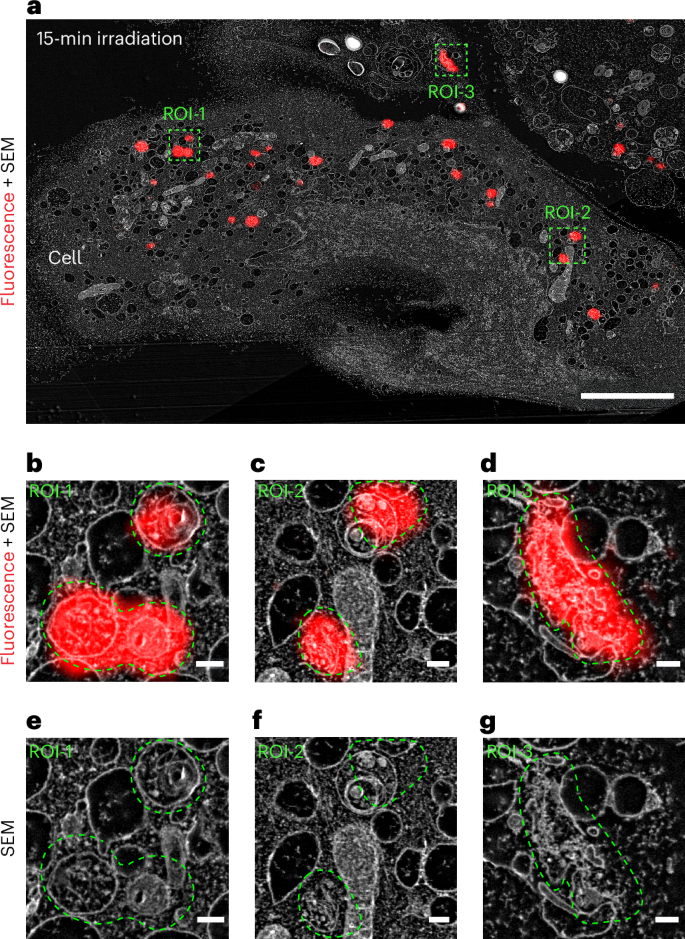
a, CLEM–SEM (scanning electron microscopy) micrographs of A549 cells treated for 4 h with 1 + 2 (25 μM, 9:1) after 15 min of irradiation, showing the nanostructures of the fibres. Scale bars, 5 μm. b,c,d, Magnified CLEM–SEM micrographs corresponding to region of interest (ROI)-1 (b) (scale bar, 200 nm), ROI-2 (c) (scale bar, 200 nm) and ROI-3 (d) (scale bar, 200 nm). e,f,g, Magnified SEM micrographs corresponding to ROI-1 (e) (scale bar, 200 nm), ROI-2 (f) (scale bar, 200 nm) and ROI-3 (g) (scale bar, 200 nm).
Source data
As irradiation time increased, notable morphological changes in the cells were observed (Fig. 4c). Therefore, a time-dependent cell viability assay was conducted, revealing that 30 min of irradiation in the presence of 1 and 2 reduced cell viability to approximately 37% under these conditions (Supplementary Fig. 32). This suggests that the assembly formation needs to reach a critical point to induce notable cytotoxicity. To rule out the possibility that the cytotoxicity observed was the result of the phototoxicity of 505-nm light, the phototoxic effect of IR780 dye or the byproduct of photolysis, 3, pertinent experiments were conducted. Initially, phototoxicity from the light source was assessed by conducting cell viability assays and confocal imaging on untreated cells (Supplementary Figs. 34 and 37), revealing that light (505-nm wavelengths, 9.2 mW cm−2) induced minimal toxicity to A549 cells. Furthermore, to investigate the potential cytotoxic effects induced by both the phototoxic effect of IR780 dye and 3, cell viability was studied on A549 cells treated with 2 at a concentration of 2.5 μM used for co-assembly and 3 at 25 μM (Supplementary Fig. 37), with and without 30-min irradiation. In addition, confocal imaging was performed for each corresponding treatment (Supplementary Figs. 35 and 36). The results clearly indicated that both compounds did not induce damage to A549 cells (Supplementary Figs. 35–37). Therefore, it can be concluded that the observed cytotoxicity solely resulted from the formation of nanostructures induced by light26,32,33.
Temporal analysis of intracellular nanofibre formation
In contrast to endogenous, stimulus-responsive, self-assembling systems, the light-triggered assembly offers a unique opportunity to control the assembly kinetics within cells by modulating the intracellular concentration of the active monomers. The kinetics involved consist of two distinct phases: the molecular photolysis phase, generating the ‘active’ self-assembling monomers, and the supramolecular assembly phase, during which nuclei are formed that progress to oligomers and mature fibres34. At the molecular level, the photolysis reaction regulates the generation and local concentration of the active monomers that proceed into the self-assembly phase. During assembly, active monomers are consumed relative to their local concentration, which determines the nanostructure formation process. When the local concentration is below the critical aggregation concentration (CAC), assembly does not start and no nanostructures are formed. Conversely, when the concentration of active monomers exceeds the CAC, the production and consumption rates determine the extent of nanostructure formation. If the photolysis production rate of active monomers exceeds their assembly consumption rate, the excess of the active monomers will continue to undergo assembly even after the light has been switched off, causing a loss in temporal precision of the supramolecular polymerization process. To demonstrate these limits, we conducted an extensive analysis of assembly processes and subsequent biological effects on A549 cells (Fig. 6). After identical 4-h peak internalization, the cells were exposed to light for 5, 10, 15 and 30 min, respectively, corresponding to the photolysis conversion of the photocaged precursors (1 and 2) in cell-free conditions (Fig. 2d), to control the amount of active monomers that then progressed into the subsequent assembly process. This was followed by a dark incubation period of 1–4 h, during which we examined the assembly progression and the associated biological effects using phasor analysis and cell viability assays (Fig. 6a–h).
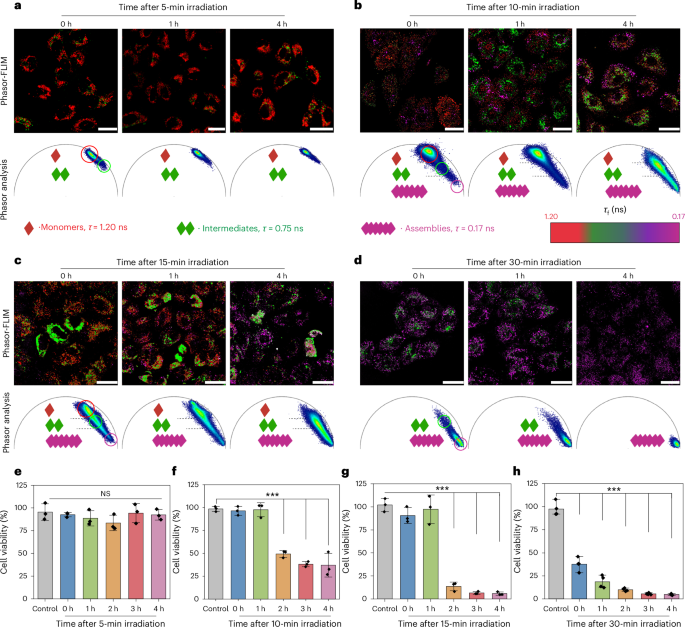
a–d, Phasor-FLIM analysis of A549 cells for 1- to 4-h incubation after irradiation for 5 (a), 10 (b), 15 (c) and 30 min (d). e–h, Cell viability study for A549 cells for 1- to 4-h incubation after irradiation for 5 (e), 10 (f), 15 (g) and 30 min (h) (n = 3, independent experiments (e), n = 3, independent experiments (f); scale bars, 25 μm; ***P < 0.001 versus control (2 h, P = 1.2 × 10⁻⁸); n = 3, independent experiments (g); ***P < 0.001 versus control (2 h, P = 2.9 × 10⁻⁷, 3 h, P = 1.8 × 10⁻⁷, 4 h, P = 1.7 × 10⁻⁷); and n = 4,independent experiments (h); ***P < 0.001 versus control (0 h, P = 1.8 × 10⁻⁷, 1 h, P = 6.5 × 10⁻⁴, 2 h, P = 6.2 × 10⁻⁶, 3 h, P = 6.8 × 10⁻⁷, 4 h, P = 5 × 10⁻⁷)). NS, not significant. All data are presented as mean ± s.e.m. Statistical significance was calculated by one-sided ANOVA with Tukey’s post hoc test: *P < 0.05, **P < 0.01, ***P < 0.001.
Source data
With an irradiation time of 5 min, subsequent incubation in the dark for 1–4 h did not show further progression on the phasor plot (Fig. 6a and Supplementary Fig. 40). Phasor analysis revealed that the population of photons remained 1.20 ns > τf > 0.75 ns, indicating that the concentration of active monomers surpassed the CAC, therefore leading to nucleation. However, it did not reach a critical concentration threshold for propagation. After irradiation for 10 min, 1-h incubation in the dark led to an increase in nucleation (Fig. 6b), whereas, after 4 h, most monomers were consumed (Fig. 6b and Supplementary Fig. 41). The results indicated that 10 min of irradiation is sufficient to produce the active monomers in excess which continued to fuel the assembly process even during the dark phase when the light was switched off. Extending the irradiation to 15 min yielded even more noteworthy changes of phasor plots (Fig. 6c and Supplementary Fig. 42). Incubation for 4 h resulted in the increase of the population of photons shifting to 0.75 ns > τf > 0.17 ns, indicative of a higher consumption of monomers, further progression into oligomers and the subsequent propagation into a larger number of assemblies compared with the 10-min irradiation experiment (Supplementary Fig. 42). Compared with 10-min irradiation, 15-min irradiation generated a considerably higher light-induced uncaging, producing higher monomer concentrations, which further promoted the supramolecular nucleation process and subsequently propagated to nanofibres within the same timeframe.
Furthermore, 30-min irradiation led to complete consumption of the active monomers, with photon populations of 0.75 ns >τf > 0.17 ns, corresponding to the formation of a substantial number of assemblies and the presence of a small number of oligomers. Then, 2 h of incubation led to a remarkable increase in assembly propagation and 3-h incubation resulted in the complete transformation of the active monomers and oligomers into assemblies (Fig. 6d and Supplementary Fig. 43). The observation indicated that the formation of a substantial amount of assemblies facilitated the propagation of all remaining oligomers, thereby driving the assembly process to completion. Overall, these findings demonstrated that, during assembly, when the photolysis production rate of monomers exceeds their assembly consumption rate, the excess monomers or unconsumed oligomers continue to contribute toward the assembly process even after the cessation of light exposure. In total, our strategy enables effective governance of the molecular photolysis phase to generate accurate concentrations of active monomers that contribute toward the self-assembly phase, which remains unattainable with assembly systems induced by endogenous stimuli. In addition, the photocaged pro-assembling peptides offer a unique opportunity to visualize and unravel supramolecular assembly processes inside living cells, which will be crucial for the formation of artificial nanostructures, compartments or synthetic organelles, an area of emerging importance.
Inspired by the finding that the assembly phase would be continuously fuelled by the overproduction of active monomers, even after the light has been switched off, we hypothesized that associated cytotoxicity caused by the accumulation of oligomers will see a delayed response. To investigate whether the species that were dynamically formed during supramolecular assembly correlate with the corresponding biological effects, cell viability was examined as a function of post-illumination assembly. It is interesting that 5 min of irradiation did not result in toxicity toward A549 cells even after 4 h of incubation (Fig. 6e). However, 10 min of irradiation did not induce toxicity within the first hour of incubation, but resulted in an approximately 50% decrease in cell viability between 2 h and 4 h (Fig. 6f). In addition, 15 min of irradiation resulted in higher toxicity, reducing cell viability to 10% after 2 h (Fig. 6g). After 30 min of light exposure, cell viability immediately decreased to approximately 37%, ultimately dropping to <5% after 4 h (Fig. 6h). By integrating the observed cellular effects with the phasor analysis of the supramolecular assembly processes, it is evident that, during the early stages of assembly, the formation of oligomers does not induce cytotoxicity. However, as these oligomers accumulated and further propagated into larger assemblies, notable cytotoxic effects emerged. These effects are correlated with the quantity of assemblies: specifically, greater numbers of assembles result in more pronounced cellular toxicity.
Conclusion
We presented photocaged pro-assembling peptides to control and image visible light-induced supramolecular assembly inside complex cellular environments. In combination with imaging technologies, precise control over the generation of diverse assembly states and real-time imaging of these processes was achieved. By integrating imaging and relevant biological assays, we discovered that, during the initial stage of peptide assembly, the formation of oligomers did not lead to observable cytotoxic effects. Notable cytotoxicity was observed only on the formation of sufficient quantities of the supramolecular assemblies. Furthermore, by performing phasor analysis on A549 cells post-irradiation, we elucidated the intricate dynamics of assembly in greater detail in cells. The observation highlighted that the concentration, production rate and consumption rate of monomers substantially influence assembly dynamics inside cells. Although precise control over the molecular phase of photolysis is achievable, managing the supramolecular phase becomes challenging when the production rates of monomers exceed their consumption rates. Time-dependent cell viability analysis revealed that the cytotoxic effects are closely correlated with the quantities of nanostructures formed intracellularly. Our study facilitated precise control over supramolecular events at discrete time points and the imaging technologies offered insights into the dynamic assembly processes with native cells. Our results will pave the way to address challenges in supramolecular drug discovery and relevant biomedical research.
Methods
Chemicals and reagents
Reagents and solvents were purchased from Sigma-Aldrich, TCI and were used without further purification. Peptide synthesis-grade reagents were used for synthesizing the peptides. High-performance liquid chromatography (HPLC) was performed using CH3CN in HPLC grade (containing 0.1% CF3COOH) and H2O for HPLC (containing 0.1% CF3COOH) and reactions were obtained from a Millipore purification system.
NMR spectroscopy
Nuclear magnetic resonance (NMR) spectra for all compounds and intermediates were recorded on a Bruker Avance III 700-MHz NMR spectrometer. Temperature control was achieved using a VTU (BCU II; variable temperature unit) with an accuracy of ±0.1K. The samples were stabilized at the desired temperature for 20 min before the measurements. For 1H spectra, the chemical shifts were reported in parts per million (ppm) from high to low frequency, using the residual solvent peak as the internal reference (D2O δ = 4.79 ppm and dimethyl sulfoxide-d6 = 2.50 ppm). All 1H resonances are reported to the nearest 0.01 ppm. The multiplicity of 1H signals is indicated as: s, singlet; d, doublet; t, triplet; q, quartet; p, pentet; m, multiplet; br, broad; or combinations thereof. Coupling constants (J) were quoted in hertz and reported to the nearest 0.1 Hz. Where appropriate, averages of the signals from peaks displaying multiplicity were used to calculate the value of the coupling constant. Chemical shifts for protons of the compounds were assigned on the basis of COSY and HSQC correlations. The data were processed in MestReNova.
Preparative HPLC
The compounds were purified by preparative HPLC using a setup by Shimadzu. For purification either a ZORBAX Eclipse XDB-C18 HPLC column (9.4 × 250 mm2, 5 μm) was used at a flow rate of 4 ml min−1 or a Phenomenex Gemini 5-μm NX-C18 110 Å (11 nm), 150 × 30 mm2 was used at a flow rate of 25 ml min−1. Experiments were performed using CH3CN in HPLC grade (containing 0.1% CF3COOH) and Milli-Q water (containing 0.1% CF3COOH).
Analytical HPLC
The samples were analysed by analytical HPLC using a setup my Shimadzu. An Atlantis T4 column (4.6 × 100 mm2, 5 μm) was used at a flow rate of 1 ml min−1. Experiments were performed using CH3CN in HPLC grade (containing 0.1% CF3COOH) and Milli-Q water (containing 0.1% CF3COOH). The solvent gradient started with 100% water, then the CH3CN content was linearly increased to 100% in 20 min. The molar ratio of the compounds was calculated using peak areas at 254 nm. Data were processed in LabSolutions and Origin.
MALDI-TOF–MS
All MALDI-time of flight (MALDI-TOF) spectra were recorded on either a rapifleX MALDI-TOF/TOF from Bruker or MALDI Synapt G2-SI from Waters. Samples were mixed with a saturated solution of the matrix S7 α-cyano-4-hydroxycinnamic acid in NH4HCO3 buffer (20 mM):CH3CN 1:1. Data processing was performed in mMass.
Spectroscopy
The ultraviolet or visible (UV/Vis) absorption spectra for the solutions of the compounds were recorded on a Thermo Fisher Scientific NanoDrop 2000/2000c spectrophotometer in a Hellma high-precision quartz cell, with a 10× 10-mm light path. The luminescence emission spectra for the solutions of the compounds were recorded on a Cary Eclipse fluorescence/luminescence spectrophotometer in a Hellma high-precision quartz cell, with a 10× 10-mm light path. For the CAC analysis using Nile Red, the luminescence spectra were recorded using a Tecan Spark 20M microplate reader. CD spectra were recorded on a JASCO J-1500 spectrometer in a Hellma high-precision cell with a 1-mm light path. Data were processed in Spectra Analysis by JASCO and Excel.
Dynamic light scattering
Single-angle DLS measurements were performed at 25 °C using a Malvern ZetaSizer Nano S purchased from Malvern Instruments Ltd with a He/Ne laser (λ = 633 nm) at a fixed scattering angle of 173°. All measurements were performed in triplicate. The obtained data were processed by cumulant fitting for Dh or CONTIN fitting for intensity-weighted particle-size distribution. Samples were prepared at 25 μM. Dust was removed before each measurement by filtration through GHP syringe filters (0.2-μm pore size, Acrodisc).
Transmission electron microscopy
TEM images of the conjugate solutions were taken on a JEOL 1400 transmission electron microscope at a voltage of 120 kV. Samples were prepared on Formvar- or carbon-film coated copper grids (300 mesh) by Plano GmbH. To prepare the TEM grids, 4 μl of the sample solution was put on freshly glow discharged (30 s at 40 W in a 6:1 oxygen:hydrogen plasma), Formvar-coated copper grids. After 5 min, the solution was removed using a filter paper and grids were stained with 4% uranyl acetate for 2.5 min. The grids were washed 3× with Milli-Q water and dried before measuring. TEM images were processed in ImageJ.
Cryogenic TEM
For cryo-TEM examination, the samples were vitrified using a Vitrobot Mark V (Thermo Fisher Scientific) plunging device. Then, 3 µl of the sample dispersion was applied to a Quantifoil or a lacey, carbon-coated TEM grid that had been glow discharged in a 6:1 oxygen:hydrogen plasma (Diener Nano, Diener electronic) shortly before. After removing excess sample solution with a filter paper, the grid was immediately plunged into liquid ethane. For the subsequent examination the specimen is transferred to a transmission electron microscope (FEI Titan Krios G4), retaining the cryogenic conditions.
Conventional TEM imaging was done using an acceleration voltage of 300 kV. Micrographs were acquired with a 4,000 Direct Electron Detection Camera (Gatan K3) under low-dose conditions.
Cell culture
MDA-MB-231 cells were cultured at 37 °C and 5% CO2 in DMEM (high glucose), supplemented with 10% fetal bovine serum. Both cell lines were cultured in a T75 culture flask and subcultivated 2–3× per week.
Luminescence detection of cell viability
After performing the CellTiter-Glo Luminescent Cell Viability Assay in a half-area, white, 96-well plate, luminescence intensity was measured on a Promega GloMax-Multi Detection System using the protocol for the CellTiter-Glo Luminescent Cell Viability Assay preinstalled on the instrument. Data were processed in Excel and graphs were generated in Origin.
CLSM and FLIM
CLSM–FLIM imaging was performed on a STELLARIS 8 Leica DMi8 microscope (Leica Microsystems, S/N, 8300000313).
Cells were cultured in an IBIDI 8-well glass-bottomed chamber at a density of 25,000 cells per well in DMEM and allowed to adhere overnight at 37 °C and 5% CO2. The medium was aspirated and samples pre-dissolved in DMEM at the respective concentrations were introduced into each well. Incubation was performed at 37 °C and 5% CO2.
Samples were excited using an 80-MHz pulsed, white-light laser tuned to 752 nm for both intensity and fluorescence lifetime measurements. Emitted photons were detected using a HyD X (GaAsP hybrid photocathode) detector with a filter window at 763–835 nm.
FLIM was conducted with fixed cells or living cells, with scanning resolution of 1,024 × 1,024 pixels2 at 100 Hz, 2-frame accumulation equipped with adaptive focusing on each frame and well position. Photons were counted based on a FALCON-modified time-correlated single-photon counting method. Each pixel was transformed into a phasor plot according to the following equation:
in which gi,j(ω) and si,j(ω) are the x and y coordinates of the phasor plot, n and ω are the harmonic frequency and the angular frequency of excitation, respectively, and T is the repeat frequency of the acquisition. Frequency domain data acquisition from each pixel can be converted to phasor points using the following transformations:
in which mi,j and ϕi,j are the modulation and phase shift, respectively, of the frequency domain measurement at pixel i,j. The decay from each pixel can hence be translated to a point in the phasor plot.
Phasor components were identified and separated using LAS X software. Photons that lie beyond the defined phasor are excluded from the images.
Reporting summary
Further information on research design is available in the Nature Portfolio Reporting Summary linked to this article.
Responses