Investigation of dynamic regulation of TFEB nuclear shuttling by microfluidics and quantitative modelling

Introduction
Transcription factor EB (TFEB) is a member of the MiT/TFE family of basic helix-loop-helix leucine zipper transcription factors. TFEB is a master regulator of lysosomal biogenesis and autophagy1,2.
Regulation of TFEB activity in response to nutrient status and other stress factors is a dynamic process and it is achieved through precise control of its subcellular localisation by a complex network of regulatory processes3, as schematized in Fig. 1A.

A Schematic representation of the molecular reactions involved in the regulation of TFEB nucleus-cytoplasm shuttling. In nutrient-rich medium, the mTORC1 complex phosphorylates TFEB at rate k1 leading to its retention in the cytoplasm. At the same time, nuclear TFEB is phosphorylated at rate k2 and is exported to the cytoplasm by XPO1 at a rate β2. In the absence of nutrients, mTORC1 is inhibited and TFEB is no longer phosphorylated, while the MCOLN1-mediated calcium release subsequent to mTORC1 inhibition contributes to dephosphorylate TFEB via Calcineurin (CaN) at a rate of k−1. Dephosphorylated TFEB can translocate to the nucleus at a rate of β1. The pharmacological treatments employed in the study and their associated effects are denoted in red. Experiments were performed in a monoclonal HeLa cell line stably expressing the indicated constructs (i.e. nuclear mCherry and TFEB fused to the EGFP). B–G Representative microscopic images of HeLa cells in phase contrast and fluorescence at the indicated conditions. RPMI: nutrient-rich cell culture medium. HBSS: nutrient-deprived Hank’s Balanced Salt Solution. H Experimental platform to measure TFEB-GFP localisation in real-time. A microfluidic chip for cell culture23 is hosted under a time-lapse inverted epifluorescence microscope (Nikon Eclipes Ti-e) to image HeLa cells. The chip is connected to two syringes filled with two different media whose position is controlled by a computer22,48. I Starvation ‘step’ experiment: HeLa cells were grown overnight in the microfluidics chip in RPMI. At the beginning of the experiment, the chip was placed under the microscope and connected to two syringes, one filled with RPMI medium, and the other with HBSS medium. Cells were kept for 30 min in RPMI before being switched to HBSS medium for 6 hours, as indicated by the input (orange). Nuclear TFEB (%): the GFP fluorescence in the nucleus as a percentage of the cell’s total GFP fluorescence. Nuc/Cyto TFEB: the ratio of the GFP fluorescence in the nucleus to that in the cytoplasm. Single-cell traces are shown as thin solid green lines, whereas the average trace is represented by the thick solid green line. J Starvation ‘pulse’ experiment: Cells were kept for 180 min in RPMI, then switched to HBSS medium for 180 min, and switched back to RPMI for 180 min as indicated by the input (orange). K Pharmacological mTOR inhibition ‘step’ experiment: Cells were kept for 30 min in RPMI before being switched to RPMI medium supplemented with AZD8055 (AZD) for 6 hours as indicated by the input (orange). L Pharmacological mTOR inhibition ‘pulse’ experiment: Cells were kept for 180 min in RPMI, then switched to RPMI medium supplemented with AZD8055 (AZD) for 180 min, and switched back to RPMI for 180 min as indicated by the input (orange). A, H were created using BioRender.com.
In its inactive state, TFEB predominantly localises to the cytoplasm; however, in response to specific stimuli such as nutrient deprivation, it rapidly translocates into the nucleus (Fig. 1B–G), where it orchestrates the transcriptional activation of its target genes3,4.
The activity and subcellular location of TFEB are regulated by the phosphorylation of specific serine residues by the mammalian target of rapamycin (mTOR) kinase5,6,7. mTOR is central to the regulation of autophagic activity and senses the energy status by integrating signals from growth factors, amino acids and glucose8. mTOR exists as two structurally and functionally distinct complexes, mTORC1 and mTORC2. mTORC1 is recruited to the lysosomal membrane in nutrient-rich conditions. Amino acid levels are ‘sensed’ in the cyotplasm and lysosomal lumen and promote activation of mTORC1 on the lysosomal surface via the heterodimeric RagA/B-RagC/D GTPases. Once at the lysosome, mTORC1 is activated by the GTP-bound Ras homologue enriched in the brain (Rheb) protein9,10,11. TFEB is a non-canonical substrate of mTORC1 dependent on the nucleotide loading status of the Rags, rather than Rheb12,13.
In the absence of nutrients, mTORC1 detaches from the lysosomal membrane, thus preventing TFEB phosphorylation. Starvation simultaneously causes the release of lysosomal calcium through the mucolipin 1 channel (MCOLN1, aka TRPLM1) located on the membranes of lysosomes, contributing to the dephosphorylation of TFEB by the calcium-dependent phosphatase Calcineurin and leading to its nuclear translocation14,15. Detachment from chaperon 14-3-3 and the conformational shift caused by TFEB dephosphorylation enable the NLS signal to be exposed6,7, facilitating its nuclear translocation via importin IPO7 or IPO8 through the Nuclear Pore Complex16,17.
Following refeeding, TFEB nuclear export is promoted by hierarchical phosphorylation of S138 and S142 residues4,18. Due to their proximity to the TFEB nuclear export signal (NES), serine residues S142 and S138 are believed to play a role in TFEB nuclear export by controlling how exportin-1 (XPO1), aka chromosomal maintenance 1 (CRM1), interacts with its hydrophobic export signal, leading to nuclear export4,18,19,20.
Many other stimuli have been shown to promote TFEB translocation in addition to lysosomal stress and starvation, including infection, bacterial phagocytosis, inflammation, physical exercise, mitochondrial damage and ER stress3,21.
Despite detailed knowledge of the different mechanisms contributing to the control of TFEB localisation, the question of whether these mechanisms fully account for its dynamic behaviour and the precise contribution of each remains to be investigated.
Here, we investigated how TFEB nucleocytoplasmic shuttling is dynamically regulated in individual cells by manipulating the activity of key regulators, such as mTOR and XPO1, by means of starvation and pharmacological treatments, as schematised in Fig. 1A. To ensure comparability, all experiments were performed in HeLa cells engineered to express the fusion protein TFEB-GFP to enable real-time imaging of its localisation, and a nuclear mCherry protein to facilitate image processing and analysis (Fig. 1A–G)22.
The experiments involve real-time single-cell imaging by means of a state-of-the-art technological platform based on a microfluidic device to host cells and connected to a time-lapse microscope (as shown in Fig. 1H). Additionally, two syringes connected to step motors are used to switch cells between two different medium over time. The entire setup is controlled by a computer, ensuring accurate and reproducible experimental conditions22.
Our work is the first quantitative model of TFEB nuclear shuttling dynamics that integrates recent insights on TFEB regulation from the literature with real-time experiments on TFEB nuclear shuttling following physiological and pharmacological treatments to reveal novel insights into the regulatory mechanisms of its translocation.
Results
TFEB nuclear shuttling dynamics upon starvation and mTOR inhibition
To measure the translocation dynamics of TFEB, we engineered HeLa cells to stably express TFEB fused to a fluorescent tag (GFP), in addition to a nuclear red fluorescent protein (mCherry)22, as shown in Fig. 1A–G. These cells were loaded in a microfluidics device23 hosted in an inverted fluorescence time-lapse microscope with temperature and CO2 controlled environment, as illustrated in Fig. 1H. The microfluidic device hosts 33 cell chambers connected to a common channel where growth medium is provided through capillary tubes connected to two automated syringes. The relative height between the two syringes is automatically adjusted by electric motors to provide cells with one of the two mediums contained in the syringes, or a combination thereof. The entire setup is controlled by a computer, ensuring accurate and reproducible experimental conditions22,24,25,26.
Microfluidics provides precise spatio-temporal control over the cellular microenvironment and enables automated medium exchange while cells are continuously imaged under an inverted epifluorescence microscope. Unlike conventional methods, this technology eliminates the need of using pipettes to manipulate cells for media changes, a process that could stress cells, interrupt data acquisition and result in the loss of fast dynamic events. Using microfluidics, we were thus able to accurately capture fast TFEB nuclear-cytoplasmic shuttling dynamics in response to changes in growth medium and drug treatment22,23,25,26.
TFEB localisation was quantified in each cell by automated image processing and reported as the ratio of GFP fluorescence in the nucleus to that in the cytoplasm (Nuc/Cyto ratio) or as the GFP fluorescence in the nucleus as a percentage of the cell’s total GFP fluorescence (Nuclear TFEB %). Both quantities are commonly used in the literature.
We performed two experiments whose results are reported in Figs. 1I, J and 2A, B: one by shifting cells from nutrient-rich to nutrient-deprived medium (step experiment), and the other one by sequentially alternating between nutrient-rich and nutrient-deprived medium (pulse experiment). Both experiments exhibit similar characteristics: when the nutrient-rich medium is supplied to the cells, TFEB is mostly, but not exclusively, cytoplasmic; when switching from the nutrient-rich medium to the saline solution (HBSS), TFEB quickly accumulates in the nucleus in about 30 minutes. Interestingly, following this early response, nuclear fluorescence gradually drops with a distinct ‘overshoot’, indicating a partial cytoplasmic relocalisation of TFEB. A similar observation was recently reported27,28, and it has been suggested to be caused by a rapid rheostatic response mediated by mTOR reactivation, which allows cells to quickly adapt to metabolic changes27. In the pulse experiment, upon refeeding, TFEB nuclear level quickly drops but then slightly increases generating a small but distinct ‘undershoot’, as shown in Fig. 1J. The observed overshoot and undershoot dynamics are an example of adaptation to environmental changes29.
To better quantify the nuclear shuttling dynamics of TFEB, we define a set of five features to characterise its behaviour in response to nutrient deprivation or chemical treatments, as illustrated in Fig. 2A, B:
-
F1 : The maximum amount of nuclear TFEB in response to treatment, defined as the maximum intensity of nuclear fluorescence.
-
F2 : The amount of nuclear TFEB at steady-state (i.e., when transient dynamics have vanished).
-
F3 : The extent of overshoot in nuclear TFEB, defined as the difference between F1 and F2.
-
F4 : The rise time in nuclear TFEB following treatment, defined as the time needed for nuclear fluorescence to rise from 10% to 90% of its maximum level.
-
F5 : The fall time in nuclear TFEB following treatment removal, defined as the time needed for nuclear fluorescence to decrease from 90% to 10% of its initial level.
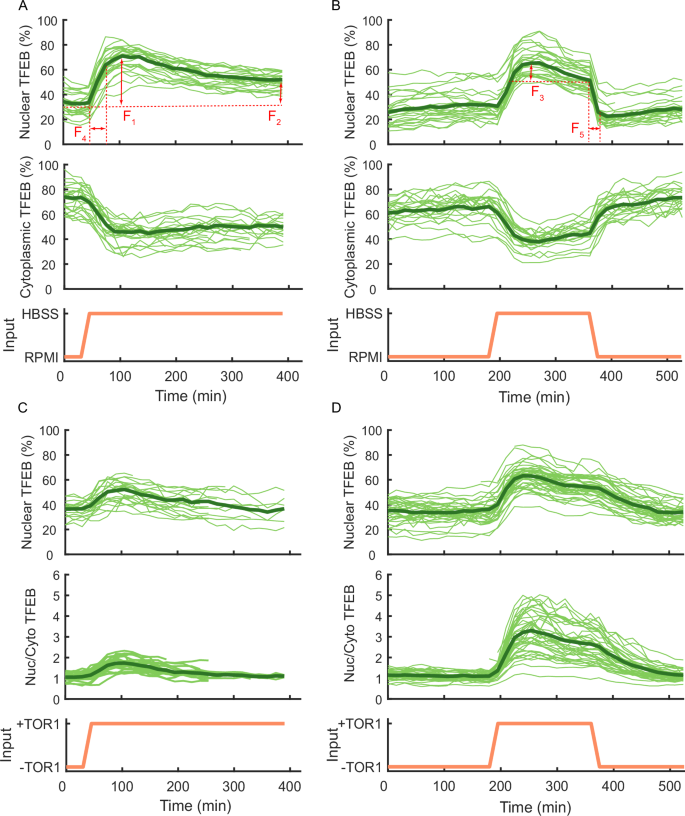
A Starvation ‘step’ experiment: Cells were kept for 30 min in RPMI before being switched to HBSS medium for 6 h as indicated by the input (orange). Here, the experimental features F1–F5 have been represented with red arrows. Nuclear TFEB (%): the GFP fluorescence in the nucleus as a percentage of the cell’s total GFP fluorescence. Cytoplasmic TFEB (%): the GFP fluorescence in the cytoplasm as a percentage of the cell’s total GFP fluorescence. Nuc/Cyto TFEB: the ratio of the GFP fluorescence in the nucleus to that in the cytoplasm. Single-cell traces are shown as thin solid green lines, whereas the average trace is represented by the thick solid green line. B Starvation ‘pulse’ experiment: Cells were kept for 180 min in RPMI, then switched to HBSS medium for 180 min, and switched back to RPMI for 180 min as indicated by the input (orange). C Pharmacological mTOR inhibition ‘step’ experiment: Cells were kept for 30 min in RPMI before being switched to RPMI medium supplemented with Torin 1 (TOR1) for 6 h as indicated by the input (orange). D Pharmacological mTOR inhibition ‘pulse’ experiment: Cells were kept for 180 min in RPMI, then switched to RPMI medium supplemented with Torin 1 (TOR1) medium for 180 min, and switched back to RPMI for 180 min as indicated by the input (orange).
The values of the features for all the experiments are reported in Supplementary Table S1.
As TFEB localisation is regulated by the mTORC1 complex, we set out to investigate TFEB shuttling dynamics in cells grown in nutrient-rich medium supplied with an ATP-competitive inhibitor of the mTOR kinase (AZD8055)3,4,18,30. As shown in Fig. 1K, L, TFEB translocates into the nucleus upon administration of AZD8055, as expected, while the overshoot in TFEB nuclear shuttling dynamics is still present despite mTOR inhibition. This behaviour is in contrast to the previous hypothesis27 postulating a role for mTOR reactivation in this adaptation mechanism. To validate this finding, we performed the same experiment, but this time using Torin 1, another ATP-competitive inhibitor of mTOR kinase3,4,18,30. The results are reported in Fig. 2C, D.
As quantified in Supplementary Table S1, drug treatments (AZD8055 and Torin 1) and starvation induce similar translocation dynamics, except for feature F5, i.e. the fall time in the nuclear fluorescence upon refeeding, which is longer following Torin 1 treatment. We reasoned that this may be due to the specific pharmacokinetic properties of this drug.
Collectively, these experiments demonstrate that mTOR inhibition is the main driver of TFEB nuclear shuttling dynamics, but the overshoot is not caused by its reactivation25.
TFEB nuclear shuttling dynamics following Exportin 1 inhibition
We then set to investigate the role of Exportin 1 (XPO1 aka CRM1) in shaping the TFEB nuclear shuttling dynamics. Exportin 1 is the main chaperone that facilitates the nuclear export of phopshorylated TFEB4,19. We thus performed a set of experiments by inhibiting Exportin 1 with the specific pharmacological inhibitor Leptomycin B.
As shown in Fig. 3A and Supplementary Fig. S1B, when Leptomycin B is administered to cells grown in nutrient-rich medium, there is an increase in TFEB nuclear concentration within 30 min but without any overshoot. Interestingly, the rise time in TFEB nuclear localisation is very similar to that induced by mTOR inhibition (feature F4 in Supplementary Table S1). These findings are consistent with previous literature where Leptomycin B treatment in nutrient-rich medium was sufficient to cause a partial relocalisation of TFEB to the nucleus4,18.
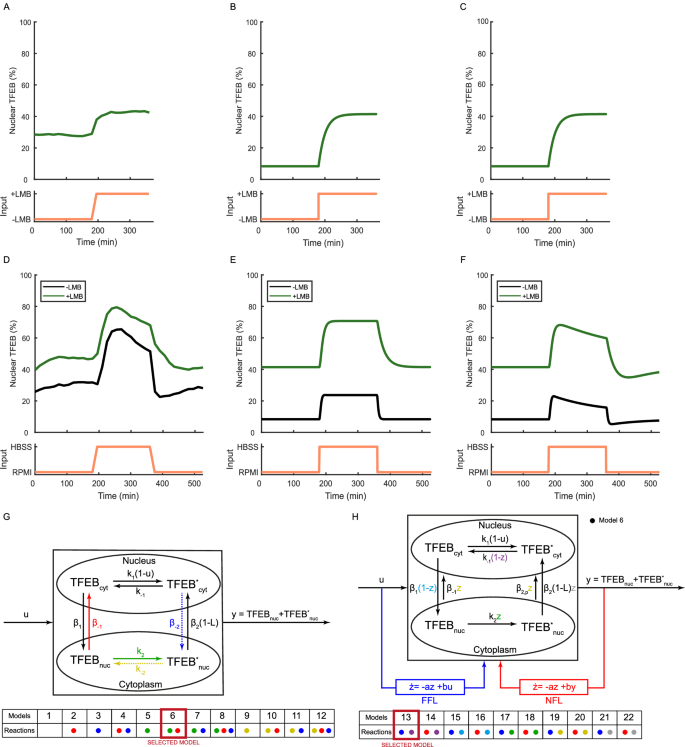
A Exportin 1 inhibition ‘step’ experiment: HeLa cells were kept for 180 min in RPMI, then switched to RPMI medium supplemented with Leptomycin B (LMB) for 180 min as indicated by the input (orange). The average TFEB nuclear fluorescence computed from single cell traces is shown as a solid green line. B Numerical simulation of Model 6 replicating the experiment in (A). C Numerical simulation of Model 13 replicating the experiment in (A). D Starvation ‘pulse’ experiment with Exportin 1 inhibition: Cells were kept for 180 min in RPMI (black line) or RPMI supplemented with Leptomycin B (LMB) (green line) and then switched either to HBSS medium (black line) or HBSS medium supplemented with Leptomycin B (LMB) for 180 min (green line), and switched back to RPMI (black line) or RPMI supplemented with Leptomycin B (LMB) (green line) for 180 min as indicated by the input (orange). The average TFEB nuclear fluorescence computed from single cell traces is shown as a solid line (green or black). E Numerical simulation of Model 6 replicating the experiments in (D). F Numerical simulation of Model 13 replicating the experiments in (D). G Schematic representation of the mathematical models of TFEB nuclear shuttling. Biochemical reactions are represented as arrows, with dashed lines indicating reactions not reported in the literature. The coloured dots indicate the reactions of the corresponding colour that are included in each of the 12 alternative models. The black reactions are included in all of the models. For example, model 6 includes the red and green reactions and all the black reactions. TFEBcyt: cytoplasmic TFEB; TFEBnuc: nuclear TFEB; (TFE{B}_{cyt}^{* }) and (TFE{B}_{nuc}^{* }) are the respective phosphorylated species; ki: phosphorylation rates; k−i: dephosphorylation rates; βi: transport rates. The input u represents mTORC1 inhibition, with u = 0 for active mTORC1 and u = 1 for inhibited mTORC1. The input L represent the effect of the treatment with Leptomycin B (L = 1 in its presence or L = 0 in its absence); The output of the system y is the total nuclear concentration of TFEB. H Schematic representation of Model 6 (black arrows) and of ten different versions of the model augmented with either a Feed Forward Loop (FFL in blue) or a Negative Feedback Loop (NFL in red) regulation. The variable z represents an unknown biological process that is either directly controlled by mTORC1 inhibition (FFL) or by nuclear TFEB (NFL). The ten alternative versions of model 6 are indicated by coloured dots depending on whether they include the FFL (blue dot) or the NFL (red dot) motif and which of the reactions is affected by z. For example, model 13 includes the FFL motif, where z is regulated directly by mTOR inhibtion (blue dot) and affects the cytoplasmic dephosphorylation reaction (purple dot).
To assess whether inhibition of Exportin 1 would alter TFEB nuclear translocation dynamics induced by starvation, cells were grown in the microfluidics device in nutrient-rich medium supplemented with Leptomycin B and then switched to nutrient-deficient medium again supplemented with Leptomycin B for three hours, as shown in Fig. 3D (green) and Supplementary Fig. S1C and quantified in Supplementary Table S1. The overshoot in TFEB nuclear translocation dynamics is still present, thus excluding Exportin 1 as its driving mechanism. By comparing the starvation pulse with (Fig. 3D, green) and without (Fig. 3D, black) Leptomycin B treatment, it appears that the effect of Exportin 1 inhibition is additive to that of starvation, uniformly increasing TFEB nuclear localisation. Interestingly, upon refeeding in the presence of Leptomcycin B, TFEB relocates to the cytoplasm with slower kinetics governed by a four-fold longer fall time (feature F5 in Supplementary Table S1), in line with the active role of Exportin 1 in TFEB nuclear export. By taking into account the specificity and effectiveness of Leptomycin B in blocking Exportin 131,32, these data suggest that other mechanisms contribute to TFEB nuclear export in addition to XPO1, as TFEB is still exported in the presence of Letpomycin B, albeit at a much slower rate.
Quantitative modelling of TFEB shuttling dynamics
To elucidate the contribution of the different mechanisms governing TFEB shuttling dynamics, we set out to derive a simplified mathematical model as a tool for selecting among alternative hypotheses and identifying the minimal set of reactions, consistent with existing literature, that are necessary to reproduce the observed behaviours. Our approach emphasises qualitatively capturing TFEB nuclear shuttling dynamics over attempting to perfectly fit the experimental data. This distinction is critical, as a quantitative model would necessitate parameter selection and the inclusion of additional reactions, making the model unnecessarily complex and preventing analytical solutions.
We generated and compared twelve different models and systematically assessed their performance against the experimental data, aiming to select the one with the highest degree of accuracy. Each model has the same structure, as shown in Fig. 3G, comprising two compartments, nucleus and cytoplasm33, through which TFEB shuttles thanks to transport reactions4. Within each compartment, (de)phosphorylation reactions are also present. Each model includes a different combination of reactions to test alternative hypotheses on the mechanisms driving TFEB nuclear shuttling. We assumed first-order kinetics for all the reactions34. Overall, there are four different TFEB species: (i) nuclear dephosphorylated (TFEBnuc), (ii) nuclear phosphorylated ((TFE{B}_{nuc}^{* })), (iii) cytoplasmic dephosphorylated (TFEBcyt), (iv) cytoplasmic phosphorylated ((TFE{B}_{cyt}^{* })). The models include one input u representing mTORC1 inhibition. Its value can be either u = 1 (mTORC1 is fully inhibited) or u = 0 (mTORC1 is fully activated); even though mTORC1 has been shown to act as a rheostat27,28, we used a binary input to simplify the analysis. We also included an additional input L to model the effect of Leptomycin B administration on Exportin 1 inhibition. The Ordinary Differential Equations describing the models, together with their analytical analyses, are reported in Methods.
To effectively evaluate the models and their proficiency in qualitatively mirroring experimental outcomes, we identified four properties that a successful model needs to satisfy based on the analysis of experimental data. The properties are described in terms of the dynamic features as follows: (P1) TFEB is never fully nuclear nor fully cytoplasmic, independently of the treatment (i.e., 0% < F1 < 100% and 0% < F2 < 100%); (P2) Nuclear TFEB levels increase when Exportin 1 is inhibited in both nutrient-rich medium and saline solution (i.e., F1LeptomycinB > F1 and F2LeptomycinB > F2); (P3) Upon refeeding, TFEB cytoplasmic relocalisation is slower when Exportin 1 is inhibited (i.e., F5LeptomycinB > F5); (P4) upon inhibition of mTORC1 either pharmacologically or in starvation, TFEB accumulates in the nucleus with a characteristic overshoot dynamics (i.e., F3 > 0).
For each model in Fig. 3G, we analytically derived the cytoplasmic and nuclear concentrations of TFEB at steady-state for all the experimental conditions, as detailed in Methods.
The analytical results (Supplementary Table S3) show that in Models 1, 3, 9 and 11, TFEB becomes fully nuclear also when mTOR is active. The reason is the presence of one-way reactions that ‘trap’ TFEB in the nucleus, leading to its accumulation and rendering it insensitive to mTOR inhibition. Consequently, these models were excluded from further analysis.
Of the remaining eight models, four (2, 4, 10 and 12) fail to satisfy property P2, as nuclear TFEB is completely insensitive to Leptomycin B treatment (Supplementary Tables S3 and S4), hence these models were removed from further analysis.
The last four models (5, 6, 7 and 8) satisfy property P2 but fail to satisfy property P1 in the presence of Leptomycin B (L = 1), as according to these models, TFEB becomes fully nuclear (Supplementary Table S4). This failure stems from the assumption that Exportin 1 is the only transporter driving phosphorylated TFEB nuclear export; hence, its inhibition by Leptomycin B eventually traps all of TFEB in the nucleus.
Accordingly, we modified these four models by adding a constitutive ‘passive’ nuclear export reaction of phosphorylated TFEB, which is insensitive to Leptomycin B treatment.
Biologically, this reaction may be interpreted in two ways: (i) Leptomycin B is not able to fully block Exportin 1; or (ii) there is really an additional nuclear export mechanism that is independent of Exportin 1 and hence unaffected by Leptomycin B.
The consensus in the literature is that Leptomycin B treatment is specific and efficient31,32, which favours the hypothesis of an additional export mechanism. Interestingly, Napolitano et al.4 described the existence of two distinct nuclear pools of TFEB that are exported from the nucleus at different rates, adding support to the passive export hypothesis.
As a result of incorporating the new export reaction, the four models (5, 6, 7 and 8) are now able to satisfy both properties P1 and P2 (Supplementary Tables S5–S6).
Notably, these models all share the presence of a basal phosphorylation reaction in the nucleus, thus suggesting that it is necessary to recapitulate the experimental data. Interestingly, while this reaction is documented in the literature4,18, it has been associated with multiple kinases, but no clear consensus has emerged yet on which one is the most relevant35.
Among the four models, we selected model 6 because of its consistency with the existing literature. Indeed, models 7 and 8 include a nuclear import reaction for phosphorylated TFEB, which is not supported by the literature, while model 5 is asymmetrical as it considers only the passive nuclear export reaction for phosphorylated TFEB but does not include a corresponding reaction for the unphosphorylated TFEB4.
Figure 3 H (black arrows) provides a block scheme that illustrates the structure of augmented model 6. In order to evaluate its consistency with the remaining two properties (P3 and P4), we performed numerical simulations with some simplifying assumptions that effectively reduced the model’s parameters to two, one dictating the phosphorylation and dephosphorylation rates and the other the transport rates (Supplementary Information).
Specifically, we simulated two experiments (Methods): (1) a step treatment with Leptomycin B in nutrient-rich medium, and (2) a pulse treatment with saline solution (HBSS), either in the absence or in the presence of Leptomycin B. The simulations are reported in Fig. 3B, E, and confirm that the model successfully satisfies both properties P1 and P2, but also property P3, i.e., TFEB relocalisation to the cytoplasm upon refeeding is slower when Exportin 1 is inhibited (Supplementary Table S1). However, the model does not satisfy property P4, i.e., the overshoot dynamics at the TFEB nuclear level upon mTOR inhibition.
Hence, we needed to modify the model once again. To this end, we observed that negative feedback loops (NFLs) and feed-forward loops (FFLs) are the two gene network motifs capable of generating overshoots36, hence we modified the structure of model 6 to explore both alternative regulatory motifs. Specifically, we introduced a new variable z, which, however, does not represent a single biochemical species but rather captures the overall effect of an unknown regulatory pathway. We thus built two alternative model structures, as illustrated in Fig. 3H (blue or red arrows): in the FFL structure, z is activated directly by mTOR inhibition (i.e., starvation or pharmacological) with first-order kinetics, whereas in the NFL structure, z is activated by nuclear TFEB following mTOR inhibition. As the hypothesised mechanism by which z affects the system is unknown, we posited that z could potentially influence any one of the reactions within the model. We thus generated 10 alternative models (5 with the FFL structure and 5 with the NFL structure), as summarised in Fig. 3H. To keep the number of alternative models limited, we considered that the effect of z can be either to increase the reaction rate over time or to decrease it. In the former case, the kinetic rate of the affected reaction is multiplied by z, whereas in the latter by 1 − z. For each reaction, we chose either of the two effects depending on which was most likely to induce an overshoot.
Numerical simulations of the ten alternative models revealed that only two satisfy all four properties: model 13, as reported in Fig. 3C, F, and model 15. Interestingly, both models use the FFL structure and impinge on a similar mechanism involving the cytoplasmic and unphosphorylated form of TFEB. In model 13, z affects the rate of cytoplasmic TFEB dephosphorylation, while in model 15, it affects the nuclear import rate.
We thus conducted an extensive literature search to find evidences that could support either one of the models. Whereas limited experimental characterisation exists on TFEB nuclear import, on the contrary, TFEB cytoplasmic dephosphorylation has been extensively studied in vitro. Indeed, as described in the Introduction, inhibition of mTOR also induces transient calcium release from the lysosome through activation of Mucolipin channel 1 (MCOLN1), thus promoting TFEB dephosphorylation through Calcineurin and its nuclear translocation14,15,37,38,39.
TFEB nuclear shuttling dynamics and calcium
Consequently, we set to experimentally probe the role of calcium in shaping TFEB nuclear shuttling dynamics. Cells were grown in nutrient-rich medium and then supplemented with the SERCA (Sarcoplasmic/Endoplasmic Reticulum Ca2+-ATPase) inhibitor Thapsigargin, which leads to a transient increase in cytoplasmic calcium levels40,41,42,43. The experimental results are shown in Fig. 4A (green line) and in Supplementary Fig. S2C and demonstrate that, at least in a subset of cells, TFEB translocates into the nucleus upon Thapsigargin administration, with nuclear accumulation peaking at around seventy minutes after the start of the treatment and then slowly decreasing to give rise to an overshoot with kinetics similar to those observed during starvation.
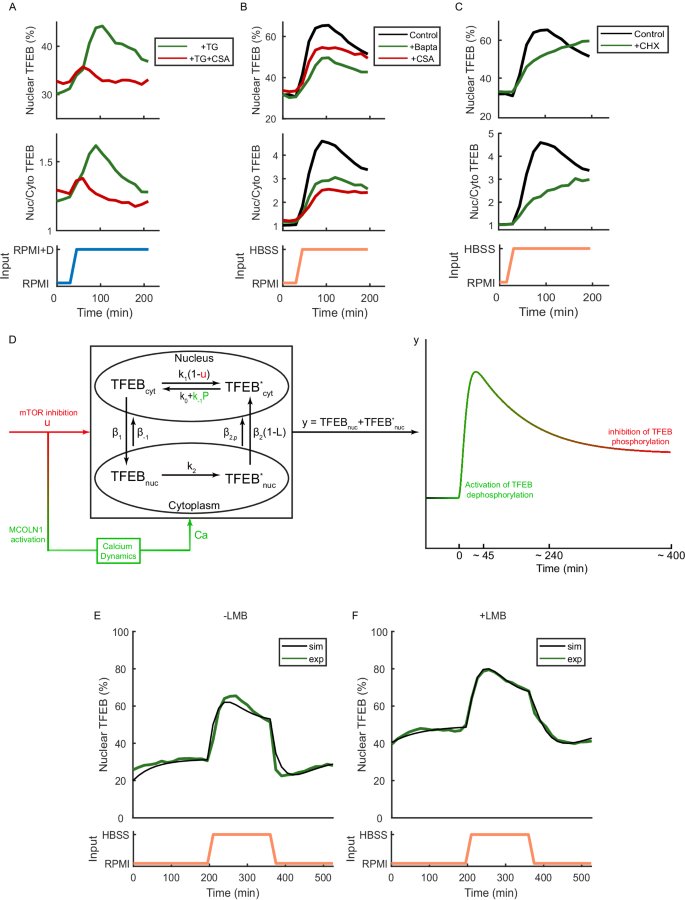
A Thapsigargin ‘step’ experiment: Cells were kept for 30 min in RPMI medium and then switched for 180 min to RPMI medium supplemented with Thapsigargin (TG) (green line), as indicated by the input (blue line). The same experiment has been repeated by concomitantly administering the Calcineurin inhibitor Cyclosporin A (CSA) together with Thapsigargin (red line). The average TFEB nuclear fluorescence computed from single cell traces is shown as a solid line (green or red). For Thapsigargin treatment (green line), the response was observed in 37 out of the 268 single-cell signals analysed, accounting for 13.8% of the cells. B Starvation ‘step’ experiment in the presence of Bapta and Cyclosporin A: cells were kept for 30 min in RPMI medium (black line) or RPMI medium supplemented with Bapta AM (Bapta) (green line) or with Cyclosporin A (CSA) (red line), and then switched for 180 min either to HBSS medium (black line) or HBSS medium supplemented with Bapta AM (Bapta) (green line) or with Cyclosporin A (CSA) (red line), as indicated by the input (orange line). The average TFEB nuclear fluorescence computed from single cell traces is shown as a solid line (red or black). C Starvation ‘step’ experiment in the presence of Cycloheximide: cells were kept for 30 min in RPMI medium (black line) or RPMI medium supplemented with Cycloheximide (CHX) (green line), and then switched for 180 min either to HBSS medium (black line) or HBSS medium supplemented with Cycloheximide (CHX) (green line), as indicated by the input (orange line). The average TFEB nuclear fluorescence computed from single cell traces is shown as a solid line (green or black). D Schematic representation of model 13 integrated with a model of intracellular calcium dynamics. The inhibition of mTOR (u) causes a transient increase in cytosolic calcium (Ca) that transiently increases rate of cytoplasmic TFEB dephosphorylation. Numerical simulations of TFEB nuclear dynamics following a starvation ‘pulse’ experiment (E) and a starvation ‘pulse’ experiment in the presence of Leptomycin B (F). These simulations are compared to the corresponding experimental results reported in Fig. 3D (black lines).
To elucidate the role of Calcineurin following calcium release by Thapsigargin, we concomitantly administered the Calcineurin inhibitor Cyclosporin A together with Thapsigargin. The experimental results are reported in Fig. 4A (red line) and in Supplementary Fig. S2D and show that co-treatment with Cyclosporin A strongly reduces TFEB nuclear translocation as compared to the Thapsigargin treatment alone (green line). These results provide further evidence supporting the role of Calcineurin in contributing to TFEB translocation into the nucleus through dephosphorylation in response to calcium, in agreement with the current literature14,15,37,39.
We also performed two control experiments to exclude the involvement of extracellular calcium and the activation of the ER stress response pathway, as reported in Supplementary Fig. S2F, G. In the first control experiment, cells were grown in nutrient-rich medium for thirty minutes, followed by a switch to nutrient-rich medium supplemented with CaCl2 (Supplementary Fig. S2F) for three hours. In the second control experiment, cells were treated with nutrient-rich medium for thirty minutes, followed by a switch to nutrient-rich medium supplemented with the ER stress inducer Tunicamycin (Supplementary Fig. S2G) for three hours. In both cases, no translocation of TFEB was observed within this time-frame, suggesting that early TFEB translocation induced by Thapsigargin administration is specific to calcium release and not to secondary effects such as ER stress.
To probe the role of calcium and Calcineurin in shaping TFEB nuclear shuttling dynamics during starvation, we performed two ‘step’ experiments. In the first experiment, cells were grown in nutrient-rich medium and then switched to nutrient-deprived medium (HBSS) supplemented with Cyclosporin A (Fig. 4B—red line and Supplementary Fig. S2A). In the second experiment, cells were grown in nutrient-rich medium and then switched to nutrient-deprived medium (HBSS) supplemented with calcium chelator Bapta AM (Fig. 4B—green line and Supplementary Fig. S2B). In both experiments, the overshoot in nuclear TFEB accumulation dynamics in response to nutrient deprivation is strongly reduced, decreasing from a value of 27% in HBSS only to a value of 13% in the presence of Cyclosporin A, and to 14% in the presence of Bapta AM (Table S1, feature F3).
Finally, it has been previously reported that blocking protein synthesis by Cycloheximide completely abolishes the starvation-induced whole-endolysosome current through MCOLN1 while preserving TFEB nuclear translocation39. Hence, we reasoned that a starvation step experiment in the presence of Cycloheximide should show no overshoot during TFEB nuclear translocation. Indeed, this is the case, as shown in Fig. 4C and Supplementary Fig. S2E.
Taken together, these results indicate that the MCOLN1-calcium-Calcineurin axis is involved in shaping the TFEB nuclear shuttling dynamics and suggest that the characteristic overshoot is directly related to calcium release through MCOLN1 activation downstream of mTOR inhibition, leading to TFEB dephosphorylation through the calcium-dependent phosphatase Calcineurin14,39.
We thus set out to derive a final model of TFEB translocation dynamics to incorporate in model 13 the role of Calcineurin activation and calcium release. To this end, we took advantage of a previously published model of calcium dynamics34 and modified it to integrate it with model 13, resulting in the final model reported in Fig. 4D and detailed in Methods. Briefly, mTOR inhibition (u) induces a transient release of calcium via MCOLN1 activation, which in turn causes a transient increase in the cytoplasmic TFEB dephosphorylation rate by Calcineurin (P)14, thus leading to the characteristic overshoot. We performed numerical simulations of the model in response to a starvation pulse either in the absence or in the presence of Leptomycin B by choosing parameters that best fit the data (Methods), as shown in Fig. 4E, F. The model is able to quantitatively replicate the experiments, including the overshoot and undershoot dynamics, thus linking the mTOR-MCOLN1-calcium-Calcineurin axis to the overshoot and undershoot dynamics observed during TFEB nuclear shuttling in response to mTOR inhibition.
Non-canonical TFEB nuclear shuttling dynamics
Our work focused primarily on studying and modelling the canonical pathways of TFEB activation via mTOR. We asked whether TFEB shuttling dynamics changes when activation occurs through a non-canonical pathway. Recent studies have shown that the conjugation of ATG8 family proteins to membranes, a process known as CASM (conjugation of ATG8s to single membranes) mediates TFEB activation via GABARAP, a member of the ATG8 family, independently of mTORC115,44.
We thus performed an additional experiment as follows: cells were grown in nutrient-rich medium (RPMI) for 1 hour and then switched to nutrient-rich medium supplemented with the ionophore Monensin, a known inducer of CASM15. The result of this experiment are reported in Supplementary Fig. S2H.
Following Monensin treatment, TFEB translocates to the nucleus but without any overshoot dynamics, suggesting this phenomenon is unique to the canonical translocation pathway mediated by mTORC1 inhibition. The first-order dynamics observed in this experiment can be replicated by Model 6 in Fig. 3G, whose translocation dynamics are reported in Fig. 3E. Model 6 lacks the FFL that in our final model represents Calcineurin activation. This observation suggests that in this scenario, Calcineurin is not active and thus the main driver of TFEB dynamics is the inhibition of phosphorylation, rather than the activation of desphosphrylation. Interestingly, it has been proposed that CASM-mediated TFEB activation is independent of calcineurin and lysosomal calcium release, but that the key mechanism involves GABARAP, FLCN/FNIP and the disruption of mTOR-dependent TFEB phosphorylation15,44.
Discussion
In this study, we investigated the relative contribution of the known biological mechanisms in controlling TFEB nuclear shuttling upon nutrient deprivation. To achieve this objective, we combined single-cell real-time imaging in individual cells cultured on an automated microfluidics platform with quantitative mathematical modelling. This integrated methodology allowed us to probe alternative hypotheses on the mechanisms driving TFEB dynamic shuttling beyond the capabilities of prior investigations.
We developed a comprehensive mathematical model that integrates all the known molecular events involved in TFEB regulation. In particular, we explored different configurations incorporating well-established dephosphorylation and transport reactions across the nucleus and cytoplasm, while also assessing the impact of reactions for which a clear consensus has not yet emerged in the literature. In so doing, the results of the modelling revealed the necessity of a nuclear phosphorylation reaction in the nucleus and of a passive transport reaction out of the nucleus; both reactions have been suggested in the literature, but they have not been fully proven yet4,18. These results are in line with the literature, where it has been shown that phospho-mutants of TFEB at sites S138A and S142A result in TFEB translocating to the nucleus under normal growth medium conditions, with a significantly impaired nuclear export4.
Through an integrated analysis of modelling and experimental results, we have elucidated the relative contributions of mTORC1, calcium dynamics via mucolipin-1 and calcineurin and exportin 1 in shaping TFEB nuclear shuttling dynamics during starvation and refeeding.
Specifically, we have established that two phases can be distinguished in cells upon starvation, as schematised in Fig. 4D: the first one characterised by a rapid but transient ‘overshoot’ which we attribute to the transient calcium release mediated by MCOLN1 activation leading to TFEB dephosphorylation mediated by Calcineurin; and a second slower phase driven by inhibition of mTORC1-dependent phosphorylation of TFEB. Crucially, in this second phase, for TFEB to shuttle to the nucleous there must be a constant minimal rate of TFEB dephosphorylation in the cytoplasm that does not depend on Calcineurin (represented by the parameter k0 in the model). It is worth noting that, although the roles of calcium-calcineurin signalling and mTORC1 in TFEB regulation have been individually described in previous studies, the discovery that these processes occur sequentially and together contribute to an ‘overshoot’ in TFEB nuclear localisation is novel. Interestingly, the overshoot dynamics in TFEB translocation has been previously observed also in cell lines such as MCF727, an epithelial breast cancer cell lines and in MFC10A28, a breast derived non-cancer cell line, supporting the generality of our findings.
In support of our results, it has been recently shown that MCOLN1 activation is not strictly necessary for TFEB nuclear translocation upon mTOR inhibition15,39, a finding that agrees with our observation on the necessity of MCOLN1 activation only for the first phase of TFEB nuclear shuttling dynamics (i.e. the overshoot).
According to our modelling and experimentally results, upon mTOR inhibition, the effect of calcium release is to transiently increase the dephosphorylation rate of TFEB in the cytoplasm, which occurs through the activation of calcium-dependent phosphatases including Calcineurin14,37,45.
We cannot rule out that the increase in dephosphorylation rate following calcium release in response to mTOR inhibition may occur independently of MCOLN1, as Cycloheximide blocks de novo protein synthesis and it is not specific to MCOLN1. However, MCOLN1 role in controlling activation of Calcineurin is well-established in the literature14,37,45.
Finally, while the physiological implications of the overshoot have yet to be established, it could serve as a sensitive indicator of Calcineurin activation to assess the biological impacts of pharmacological agents targeting this pathway.
Our study highlights the power of combining experimental biology with computational modelling to unravel the intricate dynamics of cellular signalling pathways. By providing a predictive framework, our model not only explains current observations, but also extends beyond what is currently confirmed in the literature, proposing testable hypotheses for future experimental investigations. These predictions extend beyond what is currently confirmed in the literature, pointing to new directions for future investigation. It is our hope that this integrated approach will facilitate the discovery of previously unrecognised regulatory mechanisms and contribute to a more comprehensive understanding of cellular homoeostasis and pathology.
Methods
Statistics and reproducibility
The experimental single cells data were obtained using HeLa cells stably expressing TFEB tagged with GFP and tagged with a nuclear H2B::mCherry. The cells were loaded into the microfluidic device, and the specific treatment was delivered through tubes connected to two automated syringes. The relative height between the two syringes was automatically adjusted by electric motors to expose the cells to one of the two media contained in the syringes or a combination of both. The entire setup was controlled by a computer. During the treatment, images were acquired in phase contrast and red and green fluorescence by an inverted fluorescence microscope. Subsequently, TFEB localisation was quantified in each cell through automated image processing.
Details regarding cell culture, treatments, the microfluidic device, the experimental platform, imaging systems and image analysis are provided in the following sections.
Cell culture
Cell lines used in this study were HeLa stably expressing TFEB tagged with a GFP (TFEB-GFP) and a nuclear marker H2B::m-Cherry5,22. The parental cell line was acquired from ATCC and then modified as reported in our previous study22. The cells were grown in RPMI 1640 (EuroClone) supplemented with 10% foetal bovine serum, 1% Penicillin/Streptomycin (EuroClone), 1% Glutamine (EuroClone) and 1mg/mL G418 (Sigma-Aldrich Co.). Cells were seeded on average at 15000 cells/cm2 and cultured in a humidified incubator at 37 ∘C and 5% CO2 98% humidity.
Cells treatments
For experiments involving complete starvation, Hank’s Balanced Salt Solution (HBSS) from Gibco was used as the starvation medium and complete RPMI (supplemented as indicated in Cell culture section) was used as growth medium.
In pharmacological mTOR inhibition experiments, cells were treated with 300 nM AZD8055 (Cat#S1555 Selleck Chemicals) and 300 nM Torin1 (Cat#S2827 Selleck Chemicals).
The XPO1 inhibition experiments were performed by using the inhibitor Leptomycin B 500 nM (cat#L2913 Sigma).
To study the TFEB shuttling dynamics following Calcineurin and calcium perturbations, the Calcineurin inhibitor Cyclosporin A 10 μM (Cat#C3662 Sigma) and the calcium chelator Bapta AM 20 μM (Cat#B1205 Thermo Fisher Scientific) were used. To further investigate the role of calcium in TFEB translocation, the cells were treated with the sarco/endoplasmic reticulum Ca ATPase (SERCA) inhibitor Thapsigargin 300 nM (Cat#T9033 Sigma) for three hours. Thapsigargin treatments were performed in the presence of sulfinpyrazone (used at 500 μM) and CaCl2 (used at 2 mM), that were kindly supplied by Professor Luis Galietta, Tigem. In order to exclude ER stress in TFEB translocation following Thapsigargin administration, cells were treated with the ER stress inducer Tunicamycin 0.5 μg/mL (Cat#T7765 Sigma) for 3 h. Finally, the protein synthesis was inhibited by using Cycloheximide 50 μg/mL (Cat#01810 Sigma), and the GABARAP-CASM pathway was activated with the ionophore Monensin 2 μM (Cat#M5273 Sigma).
Microfluidic device for dynamic input experiments
All the experiments with a dynamic input were performed using the microfluidic device for mammalian cells designed by Kolnik and colleagues23. The device, shown in Fig. 1H, allows cells to grow in a temperature- and CO2-controlled environment and to administer external input precisely and automatically via a complex topology of channels connecting inlets and cell chambers.
Microfluidic device for dynamic input experiments fabrication protocol
The fabrication protocol was adapted from23. A replica moulding technique was used to obtain polydimethylsiloxane (PDMS) replicas of the microfluidic device by using a master mould. Before the fabrication of the microfluidic devices, the master was exposed to chlorotrimethyl-silane (Sigma-Aldrich Co.) vapours for 10 minutes in order to create an anti-sticking silane layer for PDMS. PDMS was prepared by mixing Sylgard 184 Elastomer curing agent and base (DOW corning) in a 1:10 ratio. PDMS was poured onto the master mould, degassed for 30 min, cured for 1 hour at 80 ∘C, allowed to cool to room temperature, and then peeled from the wafer. PDMS was then autoclaved for 30 min at 121 ∘C. Holes for the 7 ports were punched using a 24-gauge blunt needle in order to create fluidic ports for the access of cells and liquid substances. The PDMS devices obtained were rinsed in isopropyl alcohol and distilled water to remove debris. For each PDMS piece containing microchannels, a thin glass slide (150 microns) was cleaned in methanol and 70% ethyl alcohol. Finally, the PDMS layers and glass slides were exposed to air plasma in the Plasma Cleaner machine (ZEPTO version B, Diener Electronic GmbH) for 30 seconds, forming a strong irreversible bond between the two surfaces. As a last step, all devices were checked for faults inside and outside the channels.
Microfluidic device for dynamic input experiments cells loading protocol
In accordance with Postiglione et al.22, for device loading, cells were rinsed with sterile Phosphate-Buffered Saline (PBS, Gibco), detached from the culture dishes by exposing them to 0.25 % Trypsin EDTA for 1 min, and then centrifuged to form a pellet. Next, to achieve a seeding density of 5-7 cells per chamber, the cell pellet was re-suspended in complete media (RPMI 1640) at a density of 0.064 cells per mm2. The channels of the device were then completely filled with fluid (excluding the culture chambers). This was done by applying complete media first through port 5 and then through port 2 once it was filled with fluid. The cell suspension was loaded into the main channel of the device from port 2. A vacuum was applied in the channel adjacent to the culture chambers (ports 3 and 4) to remove air and replace the chamber volume with fluid-containing cells. Any remaining untrapped cells in the main channel were washed away at a high flow rate without disturbing the cells inside the traps. Fluidic connections from the ports of the device to syringes containing growth medium were then established using 24 gauge PTFE tubing (Cole-Parmer Inc.). Once cells were loaded into the microfluidic device, they were allowed to culture in an incubator for 24 hours under perfusion conditions. This involved providing fresh medium to the cells in chambers through a syringe connected to port 5 and washing away waste medium through port 1. Meanwhile, all the other ports (2, 6 and 7) were plugged: port 2 was plugged with a node, and ports 6 and 7 were connected through a bridge to balance the pressure.
Actuation system
The platform based on a microfluidic device designed by Kolnik and colleagues23 was chosen for dynamic input experiments because it is based on the DAW junction. The process was controlled by vertically mounted linear actuators, each driven by a stepper motor and controlled by electronic drivers. This setup allowed precise and rapid modulation of compound concentrations for experimental purposes24.
Experimental protocol
For all experiments, the microfluidic device was secured on the microscope stage within an environmental chamber maintained at 37 ∘C with humidified 5% CO2.
For dynamic input experiments, 60 mL syringes were connected to its ports and hanged at different heights in order to regulate the flow from the inlets to the outlets according to hydrostatic pressure. The syringes connected to the outlet ports (1, 2 and 5) contained 10 mL of standard complete culture medium, and they served as waste tanks. The syringes connected to the inlets port (6 and 7) were filled as indicated in each experiment and secured on the linear actuator.
Fluorescence microscopy
The platform employed an inverted fluorescence Nikon-TI Eclipse microscope equipped with a digital camera (Andor iXON Ultra897) and an incubation chamber (H201-OP R2, Okolab) for imaging cells within the microfluidic device. To address focus drift caused by cell growth and lengthy experiments, the microscope was equipped with the Nikon Perfect Focus System (PFS) to dynamically compensate for axial focus fluctuations during extended imaging sessions. The microscope was programmed to capture phase contrast images (PhC) and fluorescence images in green and red spectra. Both PhC and fluorescence images were acquired with the same objective (Obj. PlanFluor DLL 40X Ph2 Nikon, NA 0:63) at a 15-min interval. An automated shutter was used to finely control the exposure times for each type of image acquired, that are set to 286 ms for PhC and 2 s for green spectrum with Nikon GFP BP HYQ filter (Ex 490–510 nm, Em 520–550 nm), to 2 s for red spectrum, with a Nikon TRITC HYQ filter (Ex 530–560 nm, Em 590–650 nm). The chosen exposure times and 15-min interval were carefully selected to prevent harm to cells from excessive light exposure and the fading of fluorescent proteins. During long-term imaging, temperature was maintained constantly at 37 ∘C, and CO2 concentration was set to 5% of the total air volume injected in the incubation chamber to provide an optimal growth environment for the cells.
Image analysis
The microscopy system captures both fluorescence and phase-contrast images, which require processing to quantify the level of nuclear TFEB-GFP. This was achieved by using an algorithm that employs a combination of a deep learning-based segmentation method, called Cellpose46, together with a MATLAB (Mathworks Matlab R2022b) script for precise segmentation, tracking and measurement of the HeLa TFEB-GFP monoclonal cell line. The level of TFEB-GFP shown in all panels of this study was obtained by normalising the fluorescence of the cell nuclei either in relation to the overall cell fluorescence (Nuclear TFEB (%)) or to the fluorescence within the cytoplasm (Nuc/Cyto TFEB).
Modelling
All modelling and model analyses were performed using MathWorks MATLAB R2022b. To develop a model that accurately represents the observed behaviour and is consistent with the literature, the following considerations were incorporated:
-
Under growth conditions, the mTOR complex is active and phosphorylates TFEB in the cytoplasm, while under starvation or drug treatment (AZD8055, Torin 1), the mTOR complex is inhibited, thus preventing TFEB phosphorylation5.
-
The release of lysosomal calcium through mucolipin 1 following mTOR inhibtion contributes to TFEB dephosphorylation in the cytoplasm via the calcium-dependent phosphatase Calcineurin14,15.
-
Importin IPO7 or IPO8 facilitates the nuclear import of TFEB16,17.
-
TFEB undergoes phosphorylation in the nucleus by various kinases, including CDK4/6, mTOR, ERK2 and GSK3β4,18,47.
-
The exportin XPO1 mediates the export of TFEB from the nucleus4,19.
Modelling of the nucleocytoplasmic shuttling process
Let xC and xN be, respectively, cytoplasmic and nuclear TFEB concentrations, and ({x}_{C}^{* }) and ({x}_{N}^{* }) their phosphorylated counterparts. We postulated a supplementary assumption, namely that the conservation of total TFEB protein remains constant. This assumption is reasonably valid, as the processes of TFEB dephosphorylation and transport occur much more rapidly than changes in TFEB protein concentration. This leads us to introduce the conservation rule as follows: ({x}_{C}+{x}_{N}+{x}_{C}^{* }+{x}_{N}^{* }=1), thus reducing the model to a system of three ODEs:
A block scheme of the general model equations is presented in Fig. 3G. This general model includes all of the possible de/phosphorylation and transport rates. From the general model, we derived the twelve different models in Fig. 3G by including in each model just a subset of the reactions in the general model, as described in the legend. Furthermore, as Leptomycin B affects the export of phosphorylated TFEB mediated by XPO1, we hypothesised that the input L modelling Leptomycin B treatment directly influences the nuclear export reaction rate β2.
The twelve models can be divided in three subclasses:
-
Models 1–4 share the absence of nuclear de/phosphorylation reactions.
-
Models 5–8 include only the nuclear phosphorylation reaction.
-
Models 9–12 includes only the nuclear dephosphorylation reaction.
Steady state analysis of the models
We assessed the capability of each model to satisfy the properties P1 and P2. We thus evaluated the cytoplasmic and nuclear concentrations at equilibrium in the form ({left[begin{array}{c}{bar{x}}_{C}+{bar{x}}_{C}^{* },{bar{x}}_{N}+{bar{x}}_{N}^{* }end{array}right]}^{T}) under growth and starvation treatments, both in the presence and absence of Leptomycin B. Here, active mTOR (growth condition) is simulated by setting the input u = 0, while mTOR inhibition is obtained by setting u = 1; similarly, Leptomycin B treatment is obtained by setting the parameter L = 1. The study involved the evaluation of for varying values of the input u = 0 and u = 1, considering both L = 0 and L = 1.
To satisfy the properties P1 and P2, the equilibria must satisfy the following inequalities:
-
P1: (0 , < ,{bar{x}}_{C}+{bar{x}}_{C}^{* }, < ,1) and (0 , < ,{bar{x}}_{N}+{bar{x}}_{N}^{* }, < ,1).
-
P2: (({bar{x}}_{N}+{bar{x}}_{N}^{* })) when (L=1 , > ,({bar{x}}_{N}+{bar{x}}_{N}^{* })) when L = 0.
The equilibria of the twelve models when mTOR is active (u = 0) or inhibited (u = 1) are reported in Table S3, where it can be observed that models 1, 3, 9 and 11 fail to satisfy P1 and were thus removed from further analyses.
We thus computed the equilibria for the remaining eight models during Leptomycin treatment (L = 1) as reported in Table S4. Models 10 and 12 were excluded from further analyses as their equilibria are insesitive to the input L. However, all of the remaining six models fail to satisfy properties P1 and P2 in this condition. Hence, as argued in the Results, we modified the models by introducing a ‘passive’ export rate β2,p, so that the new export rate for nuclear phosphorylated TFEB is β2,tot = β2(1 − L) +β2,p. We then recomputed the equilibria for the remaining models, as reported in Table S5, and we observed that only models 5, 6, 7 and 8 are now able to satisfy both propterties P1 and P2.
Consequently, the general model equations, which comprise models 5, 6, 7 and 8, can be rewritten as:
To reduce the number of independent parameters, we set the de/phosphorylation rates all equal to a parameter denoted as k, while the transport rates β1 and β2 were set to β and (frac{9beta }{10}), respectively. The two ‘passive’ exports β−1 and β2,p, as well as the transport rate β−2, were set to (frac{beta }{10}), as they were considered slower compared to the ‘preferential’ transports, β1 and β2. Specifically, the values of β2 and β2,p were chosen such that the total export of nuclear phosphorylated TFEB was β2,tot = β2 + β2,p = β. Consequently, the system parameters were effectively reduced to two. The equilibria for the four models with the reduced parameter set are reported in Supplementary Table S6.
Out of the the four models, we focused on model 6, which can be considered the most suitable minimal model due to its consistency with the existing literature. Indeed, unlike the other three models (5, 7 and 8), it exclusively incorporates the presence of both ‘passive’ exports, β−1 and β2,p, without considering the import reaction β−2, whose existence has not been reported in the literature. Moreover, it successfully satisfies P2 for any values of k and β (Supplementary Table S6).
Analysis of dynamics
We then checked whether model 6 was able to satisfy the remaining two properties, P3 and P4, as defined in the main text: (P3) upon refeeding, TFEB cytoplasmic relocalysation is slower when Exportin 1 is inhibited (i.e. F5LeptomycinB > F5); (P4) upon inhibition of mTORC1 either pharmacologically or in starvation, TFEB accumulates in the nucleus with a characteristic overshoot dynamics (i.e. F3 > 0).
We thus numerically simulated two experiments: (1) a pulse of mTOR inhibition, either in the absence or in the presence of Leptomycin B, and (2) a step treatment with Leptomycin B in nutrient-rich medium. The values of these parameters were inferred from the literature and set as follows: (k=frac{1}{70}=1.5cdot 1{0}^{-2}{s}^{-1}), (beta =frac{1}{216}=5cdot 1{0}^{-3}{s}^{-1}) (ref. 4). We then evaluated features F5 and F3 in both simulated experiments. The simulation results for Model 6, depicted in Fig. 3B, E provide compelling evidence that the model successfully satisfies P1, P2 and P3, but not P4. This led us to introduce the new variable z and test 10 new alternative models (5 with the FFL structure and 5 with the NFL structure), as discussed in the Results.
By introducing z, Model 6 can be modified by adding to the equations (2a)-(2c) (with k−2 = 0 and β−2 = 0) a fourth equation to describe the dynamics of the new variable z.
For the NFL models, the equation is:
Instead, for the FFL model, the equation is:
A block scheme of the general model equations is presented in Fig. 3H. In both cases, a and b are respectively the degradation and production rates of z. Parameter a was set according to the experimental overshoot dynamics (in the order of three hours). Parameter b was set according to the experimental equilibrium reached by the system (60% of nuclear TFEB, as shown in Fig. 1I). Therefore, the parameters were set equal to: a = 1.5 ⋅ 10−4 s−1, b = 8.8 ⋅ 10−5 s−1.
In order to maintain the generality and robustness of our analysis, we considered that z could potentially influence any one of the reactions within the model, including the cytoplasmic dephosphorylation rate k−1, the cytoplasmic dephosphorylated TFEB import rate β1, the nuclear phosphorylation rate k2, or the ‘passive’ exports β−1 and β2,p. However, it is evident that z cannot exert an influence on cytoplasmic phosphorylation k1, as indicated by the experimental evidence presented in Figs. 1K, L and 2C, D. Furthermore, based on the observations in Fig. 3A, D and Supplementary Fig. S1B, C, it is clear that z does not impact the XPO1-dependent nuclear export β2, as the overshoot dynamics persist even during starvation and Leptomycin B treatment. Nonetheless, we included this latter case in our study as a negative control.
We thus obtained ten additional models, five with the FFL structure and five with the NFL structure, as shown in Fig. 3H. The dynamics of the new models were analysed using the same approach as described before. Notably, among the generated models, only models 13 and 15 successfully satisfy all properties.
Model 13 integrated with calcium-mediated dephosphorylation activation
The calcium-mediated dephosphorylation activation model34 includes three species: calcium concentration in the cytoplasm, CaC; calcium concentration in the endoplasmic reticulum, CaER; and active phosphatase concentration, P. The model equations are the following:
The parameters were set to: C10 = 0.05μM/min, C1a = 0.5μM/min, C2 = 1 min−1, C3 = 1 min−1, C40 = 0.001 min−1, C4a = 0.2 min−1, ({K}_{I{P}_{3}}={K}_{Ca}={K}_{P}=0.5mu M), ρ = 10, ({k}_{P}^{+}={k}_{P}^{-}=5mi{n}^{-1}), Ptotal = 25, while IP3 is the input stimulus to the model and its concentration can be switched between 0 and 1μM. More details are discussed in ref. 34. It is worth noting that in the original model, the dephosphorylation pathway under consideration is that of NFAT, which is primarily regulated by Calcineurin, activated through the release of calcium from CRAC channels34. In our case, the model has been utilised to characterise the dephosphorylation of TFEB by Calcineurin (here indicated as P) through the MCOLN1-mediated calcium release pathway14,15. We thus incorporated these equations in model 13 in order to account for calcium dynamics and its effect on TFEB nucleocytoplasmic shuttling. The final model is the following:
In Equation (6a), the term k0 + k−1P takes into account that the phosphatase transiently enhances the dephosphorylation of cytoplasmic TFEB over its basal level k0. Additionally, we set IP3 = u, thus hypothesising that mTOR inhibition causes an increase in cytoplasmic calcium14,37,39. A block scheme of the final model is presented in Fig. 4D.
In order to validate the new model, we fitted its parameters on the experimental data. Especially, we focused on the starvation pulses in absence or presence of Leptomycin B (Fig. 3D). To fit the model, we used the Matlab function fminbnd, optimising the model parameters while they were constrained to be positive. Additionally, we used a linear transformation function ({{{mathcal{F}}}}) able to scale model simulation on the experimental data: ({{{mathcal{F}}}}=frac{{y}_{sim}-min({y}_{sim})}{max({y}_{sim})-min({y}_{sim})}delta +gamma), where ({y}_{sim}={y}_{sim,{x}_{N}}+{y}_{sim,{x}_{N}^{* }}) is the output of the simulation and δ and γ the two scaling parameters. The objective ({{{mathcal{Y}}}}) function to minimise was defined as: ({{{mathcal{Y}}}}=mathop{sum }_{{t}_{i} = {t}_{0}}^{{t}_{end}}{({y}_{exp,{t}_{i}}-{y}_{sim,{t}_{i}})}^{2}), where yexp is the experimental data and ti the i-th time point. The optimisation process was iterated until error convergence. The fitting was performed on all the parameters of the model: k, β, C10, C1a, C2, C3, C40, C4a, ({K}_{I{P}_{3}}), KCa, KP, ρ, ({k}_{P}^{+}), ({k}_{P}^{-}), Ptotal. The initial value of the parameters were set as follows:
-
k and β were scaled by a factor 1/2 with respect to their nominal values ((k=frac{1}{70}=1.5cdot 1{0}^{-2}), (beta =frac{1}{216}=5cdot 1{0}^{-3})4).
-
C10, C1a, C2, C3, C40, C4a, ({k}_{P}^{+}), ({k}_{P}^{-}) were scaled by a factor of 1/5 with respect to their nominal values34.
-
We set Ptotal = 2.
-
All the other parameters were set as previously described.
-
We set δ = 0.42 and γ = 0.2 for the starvation pulse experiment, and δ = 0.4 and γ = 0.4 for the starvation supplemented with Lemptomycin pulse experiment.
The results of the fitting were presented in Fig. 4E, F. The objective function was reduced from ({{{{mathcal{Y}}}}}_{0}=0.216) to ({{{{mathcal{Y}}}}}_{min}=0.033) for the starvation pulse experiment, and from ({{{{mathcal{Y}}}}}_{0}=0.138) to ({{{{mathcal{Y}}}}}_{min}=0.005) for the starvation supplemented with Lemptomycin pulse experiment.
Reporting summary
Further information on research design is available in the Nature Portfolio Reporting Summary linked to this article.


Responses