Ion dipole interaction and directional alignment enabled high piezoelectric property polyvinylidene fluoride for flexible electronics

Introduction
Piezoelectric materials, renowned for their ability to directly convert mechanical energy into electrical signal/energy, have emerged as key components in the development of sensors, actuators, and energy harvesters1,2. While ceramic-based piezoelectric materials have been extensively studied and demonstrated high performance, their intrinsic brittleness and lack of flexibility limit their integration into lightweight and flexible devices. This limitation has driven efforts toward the development of more adaptable materials, particularly flexible organic piezoelectric polymers and composites, that aim to combine mechanical flexibility with efficient piezoelectric effects and energy harvesting capabilities3. Due to the intriguing attributes of light weight, flexibility, biocompatibility and easy processability, polyvinylidene fluoride (PVDF) and its copolymers have been extensively explored in the fields of high energy density capacitors4,5,6, sensors7,8,9, wearable electronics10, energy harvestors11,12,13, water filtering14,15, and biomedical devices16,17.
As a piezoelectric polymer, PVDF has five distinct crystallite polymorphs (α, β, γ, δ, and ε). The piezoelectricity of PVDF polymer is mainly determined by the crystalline phases and spontaneous polarization. The α phase has TGTG′ (T-trans, Gauche+, G’-gauche-) dihedral conformation with a dihedral angle of ±60°, while the β phase has all-trans (TTTT) conformation with a dihedral angle of 180° and the γ phase has kinked conformation of TTTGTTG′18. Among these, the β phase is the most electroactive polar phase, exhibiting excellent piezoelectric, pyroelectric and ferroelectric properties and is extensively studied for piezoelectric sensors, actuators and nanogenerators. Accordingly, obtaining the β phase is essential for improving the piezoelectricity of fluoropolymers. To this end, various processing methods were utilized to induce dipole alignment for increasing the electroactive β phase content including freeze drying19, electric poling20, and thermal annealing21. Consequently, several endeavors have been undertaken, involving the incorporation of metal nanowires22 or carbon nanotubes23 into the ferroelectric polymers. These aimed to enhance the surface potential and charge trapping capability of PVDF, consequently significantly improving the performance of PVDF-based triboelectric nanogenerators (TENG). Qi et al. used PANI-MoS2 to stabilize interfacial polarization in PVDF. By leveraging the alignments between Mo-S dipoles in MoS2, π electron clouds in PANI, and -CH2 dipoles in PVDF, they achieved a specific alignment of the -CH2 dipoles24. Furthermore, the introduction of graphene25 and nanomaterials such as Ag nanowires22, ZnO26,27, ZnSnO328, and BaTi2O5 nanoparticles into PVDF has proven highly beneficial as these additions have been demonstrated to promote the preferential crystallization of the β-phase in PVDF, resulting in significantly enhanced piezoelectric and triboelectric properties29.
Despite the potential of nanofillers to enhance β-phase formation and improve piezoelectric properties of PVDF polymers, several critical challenges persist. These include nanofiller agglomeration, the formation of discontinuous interfaces, limited availability of functional groups, and the difficulty in achieving large-scale domain alignment within the polymer matrix. Additionally, poor compatibility between nanofillers and the PVDF matrix often leads to interfacial discontinuities, which degrades device performance and reduces durability of the devices under repeated strain. These issues collectively hinder the establishment of homogeneous, long-range molecular alignments with PVDF chains. As a result, the dipole polarization process is significantly disrupted, preventing the formation of the desired all-trans conformation in the PVDF composites.
In this study, we investigate the effects of ionic doping on the piezoelectric properties of PVDF polymer, focusing on ion-dipole interaction and directional alignment (IDI-DA) of dipoles induced by an electric field at an elevated temperature. We successfully fabricated a homogeneous IDI-DA PVDF film, achieving an impressive β-phase concentration of 92.78% and a piezoelectric coefficient (d33) of 29.26 pm/V. The enhanced piezoelectric property in PVDF is primarily attributed to the strong interaction between Ca2+ ions and CF2 dipoles and subsequent directional alignment of the dipoles, as verified by Molecular Dynamics (MD) simulations and multiple material characterization techniques. The IDI-DA PVDF was used to fabricate piezoelectric transducers, that demonstrated exceptional performance, delivering a peak output voltage exceeding 12 V under mechanical stress and a peak output power of 23 μW, while maintaining excellent long-term stability over 60,000 cycles. Furthermore, the transducer, integrated with an LC resonant circuit, serves as a wireless wearable sensor for instantaneous monitoring of various physical activities of the wearer. This study introduces a scalable and innovative approach to enhancing piezoelectric performance of polymer material by harnessing the combined effects of ionic doping and thermal annealing under an electric field. The insights gained pave the way for further optimization of ionic polymer-based transducers, broadening their potential applications in fields such as biomedical devices, environmental monitoring, and flexible electronics.
Results
Molecular dynamics simulation of PVDF chains with anhydrous CaCl2 doping
Figure 1a presents a schematic illustration of the interaction between Ca2+ ions and the PVDF chains when CaCl2 is incorporated within the polymer matrix. In the absence of thermal energy and electric field, the Ca2+ ions are randomly distributed within the film, resulting in random ion-dipole interaction (R-IDI) with no directional orientation of the ion-dipoles. However, when a 1 kV/10 μm external electric field and a temperature of 155 °C are simultaneously applied, the Ca2+ ions migrate within the film along the direction of the electric field via an ion hopping mechanism30, as shown in Fig. 1b. This process leads to the formation of a directional ion-dipole alignment. Figure 1c, a magnified view, schematically represents the ion-dipole interaction between Ca2+ ions and F atoms and directional alignment of the dipoles, which induces an all-trans conformation (i.e., the polar β-phase) in the PVDF matrix, thereby enhancing piezoelectricity in the fluoropolymer composite. The introduction of CaCl2 into the PVDF matrix initiates a transition from the twisted to trans conformations, underscoring the critical role of directional Ca2+-F bonds in aligning polymer chains and promoting the all-trans configuration. This mechanism is further corroborated by X-ray Photoelectron Spectroscopy (XPS) and other material characterization techniques as shown later, which validates the IDI-DA and its impact on the piezoelectric properties.

a Schematic representation of the random ion dipole alignment between PVDF polymer chains and Ca2+ ions in the absence of heat and electric field. b Ion-dipole interaction between PVDF polymer chains and Ca2+ ions and directional alignment of the dipoles in the presence of heat and electric field and (c) A zoom in view schematically represents the ion-dipole interaction between Ca2+ ions and F atoms, which induces an all-trans conformation and directional alignment of the dipoles. d Molecular dynamic simulation model using PVDF ‘mer’ chains and CaCl2. e RDF results of Ca2+-F bonds with different CaCl2 concentrations (0.5, 1.0, 2.0, and 4.0 wt.%). f RDF results of Ca and Cl bonds with H and F atoms, respectively, in PVDF chains with a CaCl2 concentration of 1.0 wt.%. g Dihedral angles distribution of the PVDF chains ranging from 0° to 180°. Dihedral angles distribution of the PVDF chains near the (h) 60° (Gauche) and (i) 180° (Trans), respectively.
To explore the interplay between CaCl2 and PVDF polymer chains, molecular dynamics (MD) simulations were conducted using a set number of 80 PVDF “mer” chains and varying concentrations of CaCl2, as illustrated in Fig. 1d. The Radial Distribution Function (RDF), a commonly employed tool for characterizing extended molecular structures, was utilized to evaluate the likelihood of finding a pair of atoms at a distance ‘r’ relative to a fully random distribution within a specified volume. The resulting RDF profiles for Ca2+-F bonding across different concentrations of CaCl2 additions (0.5, 1.0, 2.0, and 4.0 wt.%) were studied, as depicted in Fig. 1e. Noteworthy peaks within the 2.5–3.5 Å range distinctly point to bonding interaction between Ca2+ and F atoms within the PVDF chains. Particularly striking is the discernible Ca2+-F peak at a concentration of 1.0 wt.% of CaCl2, signifying the most robust bonding interaction between calcium ions and fluorine atoms.
In Fig. 1f, the RDF results display the intricate relationships among Ca2+ and Cl− ions and H, F atoms within PVDF chains, particularly with the incorporation of 1.0 wt.% of CaCl2. Notably, the intra-molecular RDF peak corresponding to Ca2+-F bonding stands out, surpassing the RDF peaks associated with Ca2+-H, Cl−-H and Cl−-F bindings. This remarkable prominence of the Ca2+-F peak is attributed to the particularly stronger bonding force between Ca2+ and F atoms compared to other atomic pairs. The interatomic distance between Ca2+ and F atoms within PVDF is 2.9 Å, underscoring a robust alignment facilitated by the compelling Ca2+-F bonding between anhydrous CaCl2 and PVDF chains.
The distinct manifestation of phase transition is elucidated through the discernible fluctuations in dihedral angles, governing the bond conformation within the PVDF chains. The optimal torsional bond arrangement is characterized by substituents positioned at 180° (trans or T) relative to each other, in contrast to the ± 60° (gauche or G) configuration. In the α-phase of PVDF, a continuous arrangement of four main carbon atoms results in a trans-gauche-trans-gauche (TGTG) conformation, featuring dihedral angles of 180° (T) and 60° (G). Conversely, in the β-phase of PVDF, all dihedral angles for the main carbon atoms are trans (TTTT), each measuring 180°. Consequently, a higher proportion of local trans structures within the membrane correlates with a greater prevalence of the β crystalline form. Figure 1g illustrates the comprehensive distribution of PVDF chains’ dihedral angles, spanning the full spectrum from 0° to 180°. With CaCl2 doping, PVDF chains exhibit diminished proportion of torsional bond conformations near 60° (Fig. 1h), whereas simultaneously displaying an increased proportion of torsional bond conformations near 180° (Fig. 1i). The method for MD simulation is discussed in Supplementary Note 1.
Crystal structures and piezoelectric properties of IDI-DA PVDF composite
X-Ray Diffraction (XRD) was employed to characterize the IDI-DA PVDF films with varying CaCl2 concentrations, as depicted in Fig. 2a. In a typical XRD spectrum of pristine PVDF, diffraction peaks at 2θ = 17.7° ((100)), 18.3° ((020)), and 2θ = 19.9° are indicative of the α-phase, while peaks at 2θ = 18.5°, 19.2°, and 20.0° signify the presence of the γ-phase. The peak at 20.7° are associated with the (200) plane of the β-phase31,32. Upon the introduction of CaCl2, a gradual augmentation in the peak at 20.7° is noticed. At 1.0 wt.%, a prominent peak emerges at 20.7°, and there is a progressive diminution in the intensity of the peak at 20.7° with increasing concentrations beyond 1.0 wt.%. However, when the content of CaCl2 exceeds 1.0 wt.%, there is a rapid decrease in the peak intensity of PVDF at 20.7°. This indicates the strong aggregation effect of CaCl2 above this composition33,34. The absence of CaCl2 crystalline peaks in the XRD spectrum of the PVDF composites indicates that the anhydrous CaCl2 is molecularly dispersed within the polymer matrix. As the CaCl2 is uniformly distributed, it does not form crystalline domains that would produce characteristic XRD peaks. This observation supports the effective and homogeneous doping of CaCl2 in the PVDF matrix, which enhances the electroactive properties of the composite.
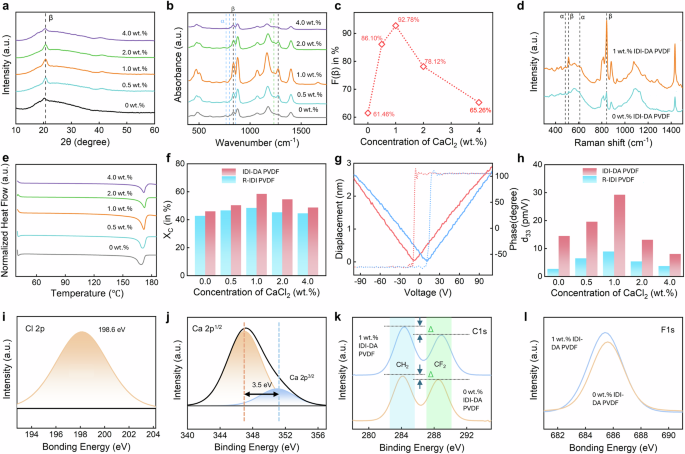
a XRD spectra, b FTIR spectra (the α-phase is represented by light blue lines, the β-phase by black lines, and the γ-phase by green lines), c F(β) value as a function of CaCl2 concentration, d Raman spectra and e DSC thermograms of IDI-DA PVDF prepared at different concentrations of CaCl2 in wt.%, f crystallinity of the R-IDI and IDI-DA PVDF polymers as a function of the concentration of CaCl2. g Displacement (solid line) and phase (dotted line) curves of the piezoelectric response of the IDI-DA PVDF composite film with a CaCl2 concentration of 1.0 wt.% under sweeping voltage. h Piezoelectric constant d33 of the R-IDI and IDI-DA PVDF polymers with varying CaCl2 concentrations. High-resolution XPS spectrum for (i) Cl 2p region, (j) Ca 2p region, (k) C 1 s and l F1s, respectively.
Fourier Transform Infrared Spectroscopy (FTIR) was used to analyze molecular band structures, phases and substance content of materials. The vibrational bands for the α phase are located at 530, 615, 763, 853, and 797 cm−1, while the β phase exhibits vibrational bands at 510 and 1275 cm−1. The corresponding spectral bands for the γ phase are found at 431, 776, 812, 833, and 1233 cm−1 32,35. The vibrational band at 840 cm−1 is the superposition of both β and γ phases and this overlap highlights the need for careful interpretation of FTIR spectra when analyzing the β and γ crystalline phases of PVDF. According to previous research32, when the 1275 cm−1 band is present and the 1233 cm−1 band is absent, the 840 cm−1 band is attributed to the β-phase. Conversely, if the 1233 cm−1 band is present, then the same band (840 cm−1) is associated with the γ-phase. For our samples, the absence of the 1233 cm−1 band and the presence of the 1275 cm−1 band, along with prominent peaks at 840 cm−1 and 510 cm−1, lead us to conclude that our samples are β phase dominant. As shown in Fig. 2b, as the concentration of CaCl2 increases from zero, the significant enhancement in the peak 840 cm−1 can be noticed, while the peak at 1233 cm−1 shows no noticeable improvement. For more clarity, we have included a zoomed-in image in Supplementary Fig. 1 in the Supplementary Information (SI), where the α-phase is represented by the light blue lines, the β-phase by the black lines, and the γ-phase by the green lines. The β-phase content can be calculated by the Gregorio’s formula36:
Here, Aα and Aβ represent the mass fractions of α and β phases, the absorption bands located at approximately 766 cm−1 and 840 cm−1 are denoted as α and β respectively, and the absorption coefficients are represented by Kα and Kβ at specific wavenumbers, whose values are 7.7 × 10⁴ and 6.1 × 104 cm2 mol−1, respectively. The neat PVDF film mainly consists of α-phase exhibiting a strong peak at 763 cm−1 in FTIR. The calculated β-phase content of the neat PVDF is 61.46% (Fig. 2c), within the typical range of pristine PVDF polymers. Upon adding a small amount of CaCl2, the β-phase content in IDI-DA PVDF dramatically rises. As shown in Fig. 2b, the α-phase peak (763 cm−1) greatly decreases, while the β-phase peaks (840 and 1275 cm−1) oppositely increase. The β-phase content increases from 67.36% to 92.78% which is consistent with the results obtained from the MD simulations, when the concentration of CaCl2 increases from 0 to 1.0 wt.%. If the concentration of CaCl2 > 1.0 wt.%, however, the β-phase content in PVDF rather declines (Fig. 2c). This is mainly due to the aggregation of CaCl2 in the PVDF matrix which results in the reduction of F(β). It is worth noting that, the absence of observable γ-phase peaks in the FTIR spectra led us to assume the presence of only α and β phases in the PVDF samples. The electroactive phase content was attributed solely to the β phase, and the β-phase fraction was calculated accordingly. Additionally, the α-phase fraction was determined using the equation32 and presented in Supplementary Table 1 of SI:
where, FEA represents the electroactive phase content which is the β-phase in our case.
Additionally, we conducted Raman spectroscopy to investigate the structural changes in various phases of PVDF films. The analysis involves comparison of 0 wt.% CaCl2 IDI-DA PVDF with a 1.0 wt.% CaCl2 IDI-DA PVDF film which has the highest concentration of F(β) as determined from the FTIR data (Fig. 2c). Figure 2d illustrates the outcomes of this investigation. In the Raman spectra, peaks at 484 and 610 cm−1 are indicative of the α-phase, while peaks at 512 and 840 cm−1 are attributed to the β-phase37. Notably, the α-phase peaks (484 cm−1 and 610 cm−1) experience a reduction, whereas the β-phase peaks (512 cm−1 and 840 cm−1) exhibit a significant increase for the IDI-DA PVDF film. This result agrees well with the results derived from the MD simulations. The correlation among the experimental XRD, FTIR, Raman spectroscopy and MD simulations strengthens our understanding of the structural transformations within PVDF when doped with CaCl2 at various concentrations, highlighting the pronounced shift from α to β phases with an increase in F(β) concentration.
Differential scanning calorimeter (DSC) analyses were performed on the samples to calculate the total crystallinity of the samples (Fig. 2e, f). Usually, the similarity between the melting temperature of PVDF films in α or β phases makes it difficult to unequivocally distinguish between these phases using the DSC data37,38. Nevertheless, DSC data can be used to determine the formation of α, β, and γ phases, within the melting temperature ranges of 160–172 °C and 179–180 °C, respectively39. The endothermic peaks obtained in the heating curves at 167–172 °C confirm the existence of either α or β phase. The DSC data demonstrated the formation of the β-phase in all IDI-DA PVDF composites, as evidenced by melting peaks within the 167–172 °C range (Fig. 2e). The absence of any significant peaks in the 179–180 °C range confirms the lack of γ-phase in the composites. This conclusion is supported by XRD, FTIR, and Raman spectroscopy results, which consistently indicate that the films are β-phase dominant. Additionally, the piezoelectricity of the films further confirms that the β-phase is the predominant phase in the measured samples as shown later. Together, these results substantiate that the melting degree observed in the DSC data from 167–172 °C corresponds to the β-phase in PVDF composites. Using DSC data, the degree of crystallinity of the samples is calculated using the following equation40
Here ΔHm is the melting enthalpy of the sample and ΔH0 is the melting enthalpy of a 100% crystalline PVDF film, equal to 103.4 J/g40, when considering a 100% β phase PVDF film. The DSC thermograms of IDI-DA PVDF films prepared at different concentrations of CaCl2 and the calculated values of χc for both the R-IDI and IDI-DA samples are shown in Fig. 2e, f respectively. χc is low for the neat PVDF (χc = 42.8%), which is consistent with other reports16; however, χc of the neat PVDF with an annealing temperature and electric field showed slightly higher crystallinity of 46%. As the concentration of CaCl2 increases, the crystallinity of both the R-IDI and IDI-DA films gradually rises, reaching a peak of 57.46% for the 1.0 wt.% IDI-DA sample, which is comparable with that of commercially available mechanically drawn PVDF films (χc = 50∼60%)41. Beyond this optimal concentration, further increases in CaCl2 lead to a significant decline in crystallinity. These findings suggest that the addition of small amounts of CaCl2 can enhance the crystallinity of PVDF, particularly when processed with the IDI-DA technique.
Piezo-response force microscopy (PFM) was employed to investigate the piezoelectric coupling coefficient (d33) of the R-IDI and IDI-DA PVDF films. For this purpose, films with a thickness of 10 μm were spin-coated onto a conductive silicon wafer, and an external electrostatic field of 1.0 kV/10 μm, which is twice the coercive field (50 MV/m) of neat PVDF, was applied during the thermal annealing process. Figure 2g illustrates the displacement and phase curves for the IDI-DA PVDF composite film with a 1.0 wt.% CaCl2. The PFM phase diagram, represented by the dotted line, consistently displays a 180° phase shift during voltage sweeps in both directions, confirming the stable piezoelectric behavior. Additionally, the solid line in Fig. 2g shows a complete butterfly-shaped curve upon reversal of the bias voltage, further affirming the piezoelectric nature of the film. The d33 is calculated from the slope of the displacement-voltage curve, providing a quantitative measure of the piezoelectric response. For the optimal concentration of 1.0 wt.% IDI-DA PVDF, the measured d33 value is 29.26 pm/V, comparable or higher than those of commercial products and those obtained by mechanical stretching and subsequent poling42,43. The piezoelectric butterfly loops for IDI-DA PVDF films with varying concentration of CaCl2 are shown in Supplementary Fig. 2 in the SI.
As illustrated in Fig. 2h, we evaluated the d33 values of the R-IDI and IDI-DA PVDF films with varying concentrations of CaCl2. When subjected to polarization, the piezoelectric coefficient of the IDI-DA films exhibits a notable increase, starting at 14.2 pm/V with no CaCl2 and reaching 29.26 pm/V at a 1.0 wt.% CaCl2 concentration. However, as the concentration of CaCl2 further increases, the d33 value experiences a subsequent decline, reaching 7.06 pm/V at a 4.0 wt.% composition. This observed trend is attributed to the agglomeration effect of ions within the composite film. In stark contrast, the R-IDI PVDF composite films display significantly lower piezoelectric coefficients compared to those fabricated by IDI-DA method, with the highest recorded d33 value being a mere 7.2 pm/V at a 1.0 wt.% CaCl2 concentration. These results highlight the significance of the directional ion-dipole alignment in enhancing the piezoelectric properties of PVDF films, achieving notably higher d33 values than the random alignment method.
To understand the hypothesis of the interaction between the anhydrous CaCl2 and the polymer, a study was carried out using XPS. In the survey XPS spectra, a peak Cl 2p region (Fig. 2i) with a binding energy of 198.6 eV and the two peaks in the Ca 2p region (Fig. 2j) with binding energies of 346.8 eV and 350.3 eV are in perfect agreement with the characteristics of Cl 2p, Ca 2p1/2, and Ca 2p3/2 44. The high-resolution C1s core-level XPS spectra of the 1 wt.% CaCl2 IDI-DA PVDF film (Fig. 2k) reveal distinct peaks at 284.7 eV and 289 eV, that correspond to the CH2 and CF2 carbon species, respectively. Furthermore, it is possible to understand whether polarization and reorientation occur during the interfacial interaction of Ca with PVDF by analyzing the peak changes (Δ) of two characteristic regions, for CF2 and CH2 dipoles. For 0 wt.% CaCl2 IDI-DA PVDF, from the peaks, it can be seen that the Δ is smaller, while for the 1.0 wt.% CaCl2 IDI-DA PVDF film, the Δ is significantly larger. Thus, it can be concluded that the addition of ions leads to a decrease in the content on the surface CF2 groups. This is in good agreement with the FTIR data, where it has been shown that the addition of CaCl2 ions leads to an increase in the fraction of the β-phase of PVDF.
Figure 2l compares the F1s spectra of the films, where the 1 wt.% CaCl2 IDI-DA PVDF film exhibits a notably more broadening peak compared to that of the 0 wt.% CaCl2 IDI-DA PVDF. Analyzing the electronegativity ratios45 between atoms in the C-F (δ− = 0.85) and C-H (δ+ = 0.11) dipoles reveals a significantly larger dipole moment for CF2 compared to CH2. This discrepancy suggests that the CF2 dipoles possess a much larger dipole moment. Consequently, ion-dipole interface alignments can occur between negatively charged ions and CH2 dipoles in the PVDF structure, as well as between positively charged ions and CF2 dipoles. Notably, the substantial dipole moment of CF2 implies a predominant occurrence of ion-dipole interface alignment through them as well as from the MD data, we can see that CF2 dipole has more tendency to react with Ca2+. Drawing insights from previous research46, which demonstrated the transformation of the non-polar phase into a polar one only when PVDF interacts with positively charged ions, and considering our aforementioned data, we can infer that the interfacial alignment between positively charged Ca2+ ions and CF2 dipoles with partial negative polarity, along with the applied electric field during thermal annealing leads to a specific ordering of polymer chains. This transition involves the polymer chains shifting from the α-PVDF TGTG conformation to the β-PVDF with the TTTT conformation.
Morphologies and elemental analysis of IDI-DA PVDF films
We fabricated PVDF films doped with various concentrations of CaCl2. The films were annealed at 155 °C for 3 h with an applied electric field of 1 kV/10 μm simultaneously for various characterization. The changes in surface structures and morphologies of the PVDF films were analyzed by scanning electron microscopy (SEM). Figure 3a–c represent the surface morphologies of the IDI-DA films with concentration of CaCl2 increasing from zero to 1.0 wt.%, while those for the IDI-DA films with CaCl2 concentration of 2 wt.% and 4 wt.% are shown in Supplementary Fig. 3 in the SI. The surface planar views of the IDI-DA PVDF films prepared with different CaCl2 concentrations exhibit vastly different morphologies, confirming that the addition of CaCl2 and an elevated temperature have a significant impact on the surface morphology of the IDI-DA PVDF composite films. The porous structure observed in the undoped PVDF matrix is attributed to rapid solvent evaporation during spin-coating, consistent with prior studies on pure PVDF films fabricated using similar techniques47,48,49. As the concentration increases from 0 wt.%, the IDI-DA PVDF composites show a dense structure as shown in the zoomed-in SEM images provided in Supplementary Fig. 4a–e in the SI. As the CaCl2 concentration increases further, aggregation becomes apparent33, as shown in in Supplementary Figs. 4d, e. The cross-sectional images of the 1.0 wt.% IDI-DA PVDF film is shown in Fig. 3d, which indicates that the film is dense and homogenous without observable pores. Atomic Force Microscopy (AFM) measurements showed that although the film has a relatively smooth surface, the surface roughness is still large in the range of 1.13 μm (Fig. 3e) and the corresponding 3D image is shown in Fig. 3f.

SEM images of the film’s surfaces with varying concentrations of CaCl2: (a) 0 wt.%, (b) 0.5 wt.%, and (c) 1.0 wt.%. d Cross-section image of the 1.0 wt.% CaCl2 IDI-DA PVDF film. e 2D and (f) 3D Surface roughness images of the IDI-DA PVDF film with a 1.0 wt.% CaCl2 concentration. g, h are pore size distributions of IDI-DA PVDF films with 0 and 0.5 wt.% CaCl2. i Element concentrations, obtained from the EDS analysis of the composite film with 1.0 wt.% CaCl2.
Furthermore, the pore size distribution of the IDI-DA composite films with CaCl2 concentration of 0.0 wt.% and 0.5 wt.% were analyzed to understand the impact of CaCl2 doping on the microstructure. As shown in the histograms, the 0.0 wt.% IDI-DA PVDF film exhibits an average pore size of 2.25 ± 0.141 μm (Fig. 3g, blue histogram), while the 0.5 wt.% IDI-DA PVDF composite shows a significantly reduced average pore size of 125 ± 10 nm (0.125 ± 0.010 μm) as shown in Fig. 3h (green histogram). With further doping to 1.0 wt.% IDI-DA PVDF, the film transitions into a dense structure, as observed in the SEM images (Fig. 3d and Supplementary Fig. 4c). This drastic reduction in pore size upon doping with CaCl2 can be attributed to the strong ionic interaction between the Ca2+ ions and the PVDF dipoles as proven by MD simulations and XPS analysis, which enhances polymer chain packing and results in a denser microstructure with smaller voids. Additionally, the presence of CaCl2 influences the solvent evaporation dynamics during the spin-coating process, leading to a more uniform film formation and the suppression of larger pores. The Gaussian fit curves in the histograms further emphasize the narrowing and shifting of the pore size distribution, indicating greater uniformity in the 0.5 wt.% IDI-DA PVDF composite. SEM images (Fig. 3a and Supplementary Fig. 4b for 0 wt.% and 0.5 wt.% CaCl2, respectively) validate these findings, showing a porous structure in the 0.0 wt.% IDI-DA PVDF and a significantly denser morphology in the 0.5 wt.% doped film. The Energy-Dispersive Spectrometer (EDS) mappings of Carbon (C), Fluorine (F), Calcium (C) and Chlorine (Cl) elements in the IDI-DA PVDF film with a concentration of 1.0 wt.% CaCl2 are shown in Supplementary Fig. 5 of the SI, showing uniform distribution of the elements within the matrix. Figure 3i presents the EDS spectrum of all elements in the composite film. The analysis shows a fairly good uniform distribution of Ca, Cl, C, and F elements in the composite film, with atomic percentages of 0.3, 0.8, 67.8, and 30.3% respectively.
Performance of the IDI-DA PVDF piezoelectric transducer
The IDI-DA PVDF membranes exhibited a pronounced piezoelectric effect. This characteristic makes the material well-suited for the fabrication of piezoelectric transducers that can be used as sensors and a piezoelectric nanogenerator (PENG) for energy harvesting (for convenience, we use transducer to represent both in the following sections). The device structure of the IDI-DA PVDF-based transducer is illustrated in Fig. 4a. It consists of an IDI-DA PVDF membrane (20 × 20 mm2) sandwiched between aluminum (Al) tapes that serve as the top and bottom electrodes, as shown in Fig. 4b. The IDI-DA PVDF membrane has a thickness of approximately 10 μm, with the CaCl2 concentration of 1.0 wt.%. Figure 4c provides an optical image of a human finger applying stress to the transducer. The working mechanism of the transducer is depicted in Fig. 4d. When the piezoelectric device is subjected to stress, the piezoelectric material deforms, generating polarization charges that create an internal electric field. This electric field either attracts or repels electrons on the external electrode surfaces, thereby generating a polarization current in the external circuit. When the force is withdrawn, the electric field from the polarization charges disappears, causing the accumulated electrons at both the electrode surfaces to flow in the opposite direction, resulting in a reverse current.

a A 3D schematic illustration and (b) an optical image of the transducer with a dimension of 2 × 2 cm2. c An optical image of a human finger applying stress on the transducer device (d) Schematic diagrams of the operation mechanism of the IDI-DA PVDF transducer. Output (e) voltage and (f) current upon applying repeated force by a finger. g Output of the transducer with respect to applied force. h Peak power of the transducer as a function of load resistance.
The output performance directly reflects the electrical signal generation capability of the transducer. The electrodes of the transducer were connected to an oscilloscope and a picoammeter, and the device was continuously compressed by hand, producing varying stress. The oscilloscope and the picoammeter measured a peak output voltage of approximately 4 V and an excellent current output of 1.5 μA, as shown in Fig. 4e, f. Due to the inherent variability in human finger pressure, including inconsistencies in magnitude, duration, angle, and contact time, the generated piezoelectric output exhibits non-uniform peak heights, as observed in the output waveforms in Fig. 4e, f.
To assess the relationship between output voltage and applied force under controlled conditions, the transducer was subjected to gradually increasing forces ranging from 10 to 150 N using a dynamic fatigue testing system, which controls the working frequency and applies consistent strain. As the applied force increases, the amplitude of the output voltage correspondingly rises. At the lowest force level (10 N), the voltage peaks are around 5 V, while at the highest force level (150 N), the peaks exceed 12 V, as illustrated in Fig. 4g. The waveforms remain consistent and uniform across all the force levels tested, highlighting the precision of the dynamic fatigue testing system in controlling the applied force. This uniformity ensures that the output is directly correlated with the applied force, minimizing variability from external factors.
Supplementary Figs. 6 and 7 in the SI illustrate the open-circuit voltage and short-circuit current of the transducer, respectively, under varying operating frequencies (1–5 Hz) with a fixed force of 50 N. The peak voltage notably increases with frequency, reaching up to 12 V at 4 Hz, and then remains saturated with further increase in frequency. Similarly, Supplementary Fig. 7 shows the short-circuit current also rises with frequency, achieving a maximum of approximately 8 µA at 5 Hz. The observed increase in voltage and current outputs with frequency can be attributed to the inherent properties of the piezoelectric material used in the transducer. At higher operating frequencies, the rate of mechanical deformation (bending and release) of the piezoelectric material increases. When the transducer operates under a fixed deformation amplitude, the strain-induced polarization within the piezoelectric material generates charges with nearly consistent density. However, the higher frequency of mechanical deformation shortens the time interval for each deformation cycle. Consequently, the same number of induced charges is transferred more rapidly, leading to higher voltage and current outputs. The device was also tested under various load resistances, the corresponding voltage outputs are summarized in Fig. 4h. The instantaneous power output of the transducer when regarded as a PENG was evaluated as a function of load resistance, with the power calculated using the following formula,
The maximum peak power reaches 23 µW at an optimal load resistance of approximately 750 kΩ. Although the harvested energy is small, it is sufficient for self-powered wearable sensing application as demonstrated below. Furthermore, the piezoelectric performance of all the composites and pristine PVDF films was evaluated under under various load resistances. The 1.0 wt.% composite exhibited the highest output voltage, which can be attributed to its superior β-phase content compared to other samples. This result further confirms the critical role of the β-phase in determining the piezoelectric performance of PVDF-based transducers. The maximum output voltages for each transducer have been presented in Supplementary Fig. 8 of the SI. In addition, the mechanical stability of the transducer was tested over 60,000 continuous impact/release cycles at a frequency of 5 Hz under a 50 N contact force. As shown in Supplementary Fig. 9, the output remains stable at 10 ± 1.5 V with no visible degradation over the tested period, demonstrating the excellent durability and long-term reliability of the transducer. This is attributed to the homogenous and dense structure of the IDI-DA PVDF films with no voids and weak interfaces like those between nanofillers and PVDF polymer matrix for nanofiller incorporated PVDF materials.
The output performance of the fabricated nanogenerator was compared with recent works reported in the literature. The detailed comparison is provided in Supplementary Table 2 of the SI. Despite the compact active area of only 2 × 2 cm², the IDI-DA PVDF composite nanogenerator exhibited superior piezoelectric performance compared to several previously reported systems.
Wearable applications of the IDI-DA PVDF transducer
To explore the possibility of the transducer as a candidate for biomechanical energy-based self-powered sensing, the optimal IDI-DA PVDF transducer was applied to sense physical activities of a wearer. As illustrated in Fig. 5, the device was tested in different motion scenarios involving finger bending, arm movement, hand clapping at different intensities (soft and loud), walking, and running. Each activity generates distinct voltage signals, indicating that the transducer can effectively capture and convert mechanical energy into electrical output under varying motion intensities.

a The flexible IDI-DA PVDF based transducer attached to the human body in various positions (finger, arm, wrist, elbow, knee, palm and shoes) for activity monitoring. By differentiating the output signals, the device attached on (b) finger and (c) arm can identify the degree of their curvature. Output voltage signals of the device mounted (d) on the wrist, e on the elbow, f on the knee, g in the palm with clapping softly and loudly and h on the heel of the shoe-pad with walking and running.
Figure 5b shows the electrical signal outputs in response to varying bending angles of a finger. The output voltage proportionally increases, reaching about 5.6 V with increased bending, indicating the transducer’s capability to convert mechanical stress into electrical signals in response to simple bending actions. The distinct peaks in the output voltage suggest the device’s sensitivity to small-scale motions, making it suitable for monitoring fine finger movements. When placed on the arm, the transducer records large motions, generating up to 8 V in response to repeated arm bending and releasing (Fig. 5c), highlighting its potential for monitoring joint movements and physical rehabilitation exercises. Similarly, wrist bending produced around 6 V (Fig. 5d), while elbow swinging generates just over 7 V (Fig. 5e). When being placed on the knee, the device reached an output of up to 9 V (Fig. 5f). Figure 5g illustrates the resultant output voltage generated by hand activity, which achieves approximately 5 V for clapping gently and over 10 V for clapping forcefully. The device also performed well in larger, more dynamic activities such as walking and running (Fig. 5h). The higher voltage signals during running compared to walking highlight its capability to harvest energy from high-intensity motions, making it a viable energy harvester for self-powered wearable electronics. This multi-functionality, demonstrated through various human motions, establishes the transducer as a promising tool for real-time motion monitoring in wearable technologies. Its application can be extended to fitness tracking, rehabilitation monitoring, and potentially powering small wearable or implantable medical devices using harvested energy from daily human activities.
Furthermore, we developed a self-powered instantaneous wearable wireless sensing system using this IDI-DA PVDF-based transducer that utilizes shift in resonant frequency or amplitude of the received resonant signals as the sensing variable43. The sensor system was then applied to monitor strain and bending of the wear’s physical activities. Figure 6a, b illustrate the schematic structure of the self-powered wireless sensor system and its equivalent circuit. The system consists of two main components: the transmitting module and the receiving module. The transmitting module includes the IDI-DA PVDF transducer, an ionic polyvinyl alcohol (PVA) variable capacitive (VC) pressure sensor with a capacitance of Cv, a switch and an inductor coil transmitter (L1), as shown in Fig. 6b. PVA was employed to fabricate the iontronic capacitive sensor in this wireless sensing system due to its widely recognized ability to enhance capacitance sensitivity50,51. The film’s rough surface, characterized by microstructures (Supplementary Fig. 10), could significantly improve its responsiveness to mechanical deformation, enabling very large capacitance changes even under minute strains. Furthermore, PVA is biocompatible, particularly suitable for wearable and biomedical applications. By integrating the piezoelectric transducer with an RLC sensing circuit, it enables the spontaneous generation of oscillating signals that encode sensing information. The resonant frequency of the RLC tank can be calculated from the following formula52:

a Schematic. b Schematic diagram of the frequency-based sensing system. c oscillating signals and (d) FFT spectra of the frequency-based sensing system under pressure levels. e Schematic diagram of the Amplitude-based sensing system. f Oscillating signals of the sensing system under different pressure levels. g FFT spectra of the amplitude-based sensing system under different pressure levels. All the experiments were conducted with the circuit parameters being summarized in Supplementary Table 3.
Here C is the capacitance of either the sensor Cv or the fixed capacitor C1, and L1 is the inductance of the coil transmitter. The receiving module comprises an inductor coil (L2) with the output displayed on an oscilloscope. The resonant frequency and sensing information of the received signals can be extracted by using fast Fourier transform (FFT) spectral analysis as the change of capacitance of the sensor will vary the resonant frequency of the sensor systems. The left inset of Fig. 6a provides the whole structure of the IDI-DA transducer side where the terminal ab is the output terminal while the terminal cd is the output terminal of the PVA variable capacitive pressure sensor. The IDI-DA transducer and the VC sensor were encapsulated before attaching to the arm. The structure and working principle of the ionic film-based pressure sensor are discussed in Supplementary Note 2, and the encapsulation process is discussed in the Methods section.
To address the high internal impedance of the transducer, we implemented a piezoelectric-output-enabled electronic switch (right inset of Fig. 6a) which ensures that the signal’s frequency and amplitude remain exceptionally stable and unaffected by environmental variations53. The switch comprises several key components: a peak detector (D1, Rd, and Cd), a comparator with a PNP transistor (T1), and a switch using an NPN transistor (T2). The terminal ab is the input terminal of the switch where the output of the transducer is being applied. During operation, the peak detector captures the transducer’s peak voltage, turning on the PNP transistor (T1) and subsequently the NPN transistor (T2) once the signal voltage drops below the peak. This enables the energy to be injected into the RLC tank, generating an oscillating signal which decays over time due to parasitic losses and limited energy input. The diodes help to isolate the transistor connections, preventing interference, and ensuring that the switch disconnects once energy transfer is completed, achieving efficient energy transfer without external power. The details of the electronic switch are discussed in Supplementary Note 3. It should be emphasized that the whole sensor system is solely powered by the IDI-DA PVDF transducer without needing any additional power source.
Figure 6b shows a sensing circuit which utilizes frequency shift as a variable for sensing. For this, we attached the sensor to the arm of the volunteer to differentiate various joint movements and to produce stable performance under dynamic movement. Figure 6c depicts the time-domain responses of the sensor received by oscilloscope during an arm bending, while Fig. 6d shows the corresponding FFT spectra. The green curve represents a slight bending, while the light blue curve corresponds to a moderate bending and the grey curve shows a heavy bending. When the sensor is fixed at the joints, the bending of the joints results in sensor deformation, and a consequent rise in capacitance. Applying pressure to the ionic PVA film compresses the electric double layer (EDL) at the electrode interface, increasing the contact area, which leads to a change of the capacitance50,51. The change in capacitance (ΔC) due to different swing intensities results in distinct shifts in the resonant frequencies of the FFT spectra. With the bending angle increase (large bending), the contact area of the VC sensor increases, hence the capacitance increases, resulting in a frequency shift towards the low frequency. This also rises the output of the transducer, hence the increased amplitude of the resonant signal. The significant difference in amplitude between slight and large swings also demonstrates the sensor’s ability to detect varying degrees of motion. Additionally, the wireless nature of the system enables remote monitoring without the constraints of wired connections, enhancing mobility and ease of use.
We further demonstrated signal amplitude change as a variable for sensing using the same wireless sensor system. Unlike previous configuration, this circuit (Fig. 6e) relies on the amplitude of the resonant signals for detection. The sensing process works as follows: different pressure levels applied to the IDI-DA PVDF transducer generate varying output voltages, which in turn cause different amounts of energy to be coupled into the RLC tank circuit. This energy is then transferred to the receiver via the inductive coil coupling. The variation in energy levels at the transducer alters the resonance amplitude of the RLC circuit, allowing for accurate detection and differentiation of pressure levels.
In this case, the sensor variable capacitive sensor was replaced with a fixed capacitance C1 and another tuning capacitor (C2) connected in series with the inductor L2 at the receiver part. In this scenario, both the capacitances and inductances in the RLC tanks are fixed, allowing the shift in amplitude to be utilized for sensing purposes. The resonant frequency of the sensor side can be calculated using Eq. (4), with parameters C1 = 470 pF and L2 = 2.2 mH (as detailed in Supplementary Table 3). This results in a calculated resonant frequency of 156.6 kHz. Figure 6f, g present the experimentally obtained oscillating voltage signals and the corresponding FFT spectra from the receiver module respectively. The amplitude of the FFT spectra increases with increasing force, while the resonant frequency remains stable at approximately 156.2 kHz, matching the theoretically calculated resonant frequency. This confirms the system’s capability to detect strain by monitoring variations in the amplitude of the resonant signal.
This versatility makes the wearable sensor suitable for comprehensive activity monitoring in fitness and health tracking devices, particularly beneficial for athletes and rehabilitation patients. The wireless transmission capability further allows for seamless data collection and analysis, facilitating continuous and real-time monitoring in dynamic environments. It should be emphasized that oscilloscope is used to show the received signals for the demonstration in this work. The transmitted wireless sensing signals can be simply received by a mobile phone etc. for wearable application. To be mentioned, details of the capacitors, inductive coils, and resistors can be found in Supplementary Table 3.
Discussion
In summary, we demonstrated the successful incorporation of anhydrous CaCl2 into PVDF polymer, significantly enhancing the piezoelectric properties of the resulting PVDF composite and sensing capability of the flexible piezoelectric transducers. The directional interaction between ions and dipoles facilitated by the Ca2+ ions was shown to promote the alignment of PVDF polymer chains into the electroactive β-phase, achieving a high β-phase content of 92.78% and a piezoelectric coefficient of 29.26 pm/V. This enhancement was validated through molecular dynamics simulations, XPS, FTIR, and other advanced characterization techniques, highlighting the crucial role of Ca2+ ions in improving dipole alignment. The fabricated IDI-DA PVDF transducer exhibited excellent performance, generating a peak output voltage of over 12 V under a mechanical force and showing reliable long-term stability over 60,000 cycles. This performance indicates that the transducer is highly effective for sensing and energy harvesting applications, particularly in wearable electronic systems. This work presents a novel and scalable approach to improving the performance of piezoelectric materials by leveraging the synergistic effects of ionic doping and thermal annealing under an electric field. The findings pave the way for further optimization of ionic-polymer-based piezoelectric transducers and extend their applications to diverse fields such as biomedical devices, environmental monitoring, and flexible electronics. However, certain limitations should be acknowledged. Scalability remains a challenge, as the laboratory-scale fabrication process requires optimization for industrial applications. Cost implications of materials and processing also need to be addressed to improve commercial viability. Additionally, while the device demonstrated reliable performance over 60,000 cycles, prolonged long-term durability is crucial for practical implementation, therefore it is necessary to investigate the cyclic tests for much longer duration. Addressing these challenges through material innovation and process optimization will be essential to translating this research into commercially viable technologies.
Methods
Materials
PVDF resin (Molecule weight ~625000) was supplied by Beijing Epsilon Technology Co., Ltd. Calcium chloride anhydrous (CaCl2, ≥ 96.0%) were purchased from Sinopharm Chemical Reagent Co., Ltd. (China). Analytical reagent-grade N, N-dimethylformamide (DMF) and formic acid were obtained from Sinopharm Chemical Reagent Co., Ltd. Polyimide (Kapton) and conductive Al tapes were purchased from Shenzhen Changdasheng Electronics Co., Ltd. PVA was purchased from PVA, MW ~ 145,000; Aladdin Industrial Corporation and PDMS prepolymer and cross-linker agent (184 Silicone Elastomer) were purchased from Dow Corning. All the materials were used as received without further treatment.
Fabrication of annealed IDI-DA PVDF composite films
For the fabrication of IDI-DA PVDF composite membranes, the preparation process is shown in Supplementary Fig. 11. First, anhydrous CaCl2 was dissolved in a 10 mL N, N-dimethylformamide (DMF) solvent by magnetic stir for 12 h at 25 °C to obtain a homogeneous solution. Second, 1.2 g PVDF powder and the salt solution were mixed together with a weight ratio varied from 0 to 4.0 wt.%. Third, the mixture was stirred and sonicated for 2 h to disperse CaCl2 sufficiently, and then was stirred at 60 °C for 4 h. Then, the transparent solution was transferred into a silicon wafer for spin coating process, the spin-coating process contains two steps: a rotation speed of 500 rpm (rotations per minute) for 10 s, followed by 500–3000 rpm for 30 s to control the thickness of PVDF composite membranes in a range of 5–30 μm and dried in air for 12 h at 60 °C to evaporate the solvent. Then, a thermal annealing process was applied where the films were heated to 155 °C for 3 h, while a voltage of 1 kV/10 μm was simultaneously applied with the films being sandwiched between two copper electrodes. The annealing temperature which is slightly higher than the boiling point of DMF (~ 153 °C) has three effects: (1) Removing residual DMF in the films; (2) The elevated temperature under the influence of the external electric field assisted in the alignment of Ca-F dipoles; (3) Removal of pores from the films while making it dense in the process.
Fabrication of IDI-DA PVDF transducer devices
The IDI-DA PVDF composite films were cut into 2 × 2 cm2 square pieces. Two pieces of aluminum tapes (30 µm) were then applied to both sides of the composite film, serving as electrodes to fabricate a sandwich-like configuration. To complete the device fabrication, two layers of polyimide (PI) film (50 µm) were attached on each side of the device and compressed. This packaging approach effectively minimizes any interference from triboelectric effects between different layers, ensuring the piezoelectric performance remains unaffected, while also providing protection from harmful environmental conditions.
Fabrication of the ionic PVA film
First, 2 g PVA was dissolved in 18 g of deionized (DI) water while stirring magnetically at 90 °C for 2 h. Once the solution cooled to room temperature, 1.15 mL phosphoric acid (H3PO4, GR, ≥ 85% in H2O; Shanghai Macklin Biochemical Co., Ltd.) was added, and the mixture was stirred at 22 °C for an additional 4 h. The PVA/H3PO4 solution was then poured onto a 7000-mesh sandpaper and spin-coated for 60 s at 200 rpm using a spin coater. Finally, the coated film was allowed to dry at room temperature for approximately 12 h, enabling the water to evaporate and forming an ionic film on the sandpaper.
Fabrication of electrodes for the PVA variable capacitive sensor
Al foils (30 µm) with polyimide film (PI, thickness: 50 µm) cover were used as flexible electrodes. The electrodes and the prepared PVA/H3PO4 film were then cut into certain size (1 cm × 1 cm). Then, the ionic PVA film was sandwiched between the two flexible electrodes. Finally, the flexible electronic pressure sensor was edge-encapsulated using 3 M tape to ensure durability and stability.
Integration of the IDI-DA transducer and PVA sensor
First, The IDI-DA PVDF transducer encapsulated in PDMS, with electrodes extending from the encapsulated structure. The encapsulation process involves several steps. First, a PDMS mixture was prepared by combining the base and curing agent in a 10:1 ratio, followed by degassing to eliminate air bubbles. The degassed PDMS was then poured over the IDI-DA PVDF transducer and spread evenly to ensure complete coverage. The encapsulated device was cured in an oven at 60 °C for 3 h and allowed to cool to room temperature. Finally, copper wires were attached to the positive and negative terminals of the transducer. Second, the PVA variable capacitive sensor encapsulated with a 3 M tape was placed on top of the PDMS coated IDI-DA PVDF transducer to complete the IDI-DA sensing system as shown in the left inset of Fig. 6a.
Material characterization and device measurements
The obtained PVDF composite films with different concentrations were characterized by various techniques. The morphology of surface and cross section was measured by field-emission scanning electron microscopy (FE-SEM) (Hitachi SU5000) after coating Au nanoparticles using Ion sputtering instrument (KYKY SBC-12). The XRD patterns of the films was acquired on Multifunctional X-ray Diffractometer (Shimadzu LabX XRD-6100). The piezoelectric charge constant d33 were investigated using commercial AFM (Multimode SPM) (Bruker Co.) with piezo-response force microscopy (PFM) mode. To acquire the Raman Spectrum of PVDF composite films mentioned above, the Raman Spectrometer (Horiba LabRAM Odyssey) was used. Meanwhile, the element distribution of CaCl2 in PVDF films was obtained by the Energy Dispersive Spectrometer (Bruker XFlash6130). The FTIR spectra of PVDF composite films was acquired on Nicolet 5700 (Thermo Electron Scientific Instruments Corp). The surface roughness was tested by atomic force microscope (AFM, Bruker ICON). The XPS Spectrum was tested by X-ray photoelectron spectrometer (ESCALAB). The crystallinity of the PVDF composite films was investigated by the differential scanning calorimeter (DSC-7, Perkin Elmer, America) with a temperature range of 40–200 °C at a heating and cooling rate of 10 °C/min in nitrogen atmosphere. To evaluate the performance of the transducer, we used a dynamic fatigue testing system (Popwil Model YPS-1) to control the different stresses applied. Besides, the environment humidity was maintained below 40%. Output voltage and short-circuit current of transducer were measured by an oscilloscope (Tektronix MDO3032) with an internal load resistance of 100 MΩ and a picoammeter (Keysight B2981A), respectively.


Responses