IoT integrated and deep learning assisted electrochemical sensor for multiplexed heavy metal sensing in water samples

Introduction
Access to clean water, a fundamental necessity, is increasingly becoming a challenge in our times and is projected to worsen in the future. Factors such as mining, rapid industrialization, irresponsible resource utilization, chemical spills, sewage sludges, urban runoff, and unregulated small-scale industries significantly contribute to the contamination of natural water sources1. Among the various water pollutants, heavy metals are particularly concerning because of their profound and persistent impacts on human health. These toxic elements can accumulate in biological systems, leading to a myriad of detrimental health effects. Heavy metal toxicity promotes the generation of free radicals, which damage DNA and may cause cancer, renal damage, skin ailments, nervous system abnormalities, kidney complications, and other problems2,3. The associated adverse health effects highlight the need to take remedial measures. While prevention and treatment are essential factors in achieving portable water devoid of unacceptable levels of these contaminants, effective monitoring is the first step in taking remedial action. There is significant interest in the global community in improving accessibility to clean water, and the importance of addressing this challenge is further emphasized even by the United Nations as a sustainable development goal #6, which focuses on Clean Water & Sanitation. Thus, developing technologies for water monitoring and solutions to safeguard our most vital resources is crucial.
Inductively coupled plasma-mass spectrometry (ICP-MS)4, High-performance liquid chromatography (HPLC)5, Atomic absorption spectroscopy (AAS)6, Inductively coupled plasma optical emission spectrometry (ICP-OES)7 and isotope dilution mass spectrometry8 are commonly used by regulatory bodies to ascertain the presence of heavy metals for the benefit of public welfare9. However, these techniques are expensive as they rely on laboratories with sophisticated instruments and require skilled operators. These factors limit accessibility to resource-limited regions where their assistance is most vital.
Electrochemical sensing is an approach that can significantly reduce the associated costs and resource-intensive needs in water quality assessment10,11,12. The ability to miniaturize an electrochemical sensing system allows convenient point-of-source testing with simplified sample preparation and reduces costs. Although miniaturized electrochemical sensors may exhibit reduced sensitivity, previous studies have demonstrated that their detection range for heavy metals in water remains within practical limits13,14,15.
Fabricating custom-built electrochemical sensors offers notable advantages; however, the intricate output signals frequently result in misinterpretation, posing a significant barrier to the accurate comprehension of data by individuals lacking specialized technical expertise. In this context, deep learning algorithms can process and interpret complex electrochemical data patterns that traditional methods might overlook, enabling more accurate detection, classification, and quantification of analytes16,17,18. Furthermore, incorporating the Internet of Things (IoT) elevates the user experience by offering a more accessible and understandable data interface. This synergy combines advanced sensor technology with real-time data analysis and enhanced decision-making capabilities, offering a robust approach to addressing environmental safety and implementing effective water pollution management strategies19,20.
Several researchers have made significant efforts to quantify multiple heavy metals simultaneously21,22. Dinu et al.23 developed a sensor via screen-printing with carbon nanofibers (CNFs) modified with Fe3O4 nanoparticles and multilayer carbon nanotubes (MWCNTs) modified with Fe3O4 nanoparticles to simultaneously detect Cd²⁺, Pb²⁺, Cu²⁺, and Hg²⁺ions. Both the SPE modifications were compared in terms of the limit of detection, where the SPE/Fe3O4-CNF sensor showed better results. Wang et al.24 have synthesized a composite material comprising a ferrocene carboxylic acid-functionalized metal-organic framework (Fc-NH₂-UiO-66) and thermally reduced graphene oxide (trGNO) for the simultaneous detection of Cd²⁺, Pb²⁺, and Cu²⁺ ions. Zhang et al.25 used screen-printed electrodes for sensing Cd2+, Zn2+, and Cu2+ and quantified them via square-wave voltammetry. Additionally, a CNN-based system was developed to detect heavy metal ion types and concentrations. Data from 1200 samples was collected, and 99.99% classification accuracy and 8.85% mean relative error were achieved in concentration detection across 12 sets of solutions with varying ionic species and concentrations. Liu et al.26 used square-wave anodic stripping voltammetry (SWASV) to detect Cd²⁺ and Pb²⁺ ions. For enhanced accuracy, the interactive interferences of Cu²⁺ and Zn²⁺ were analyzed via two-dimensional correlation spectroscopy (2D-COS). The extracted features were processed using different machine learning models, specifically feature random forest (feature RF) and feature support vector regression (feature SVR), which significantly improved the detection accuracy. A comparison of several other studies is shown in Table 1. Despite significant efforts by multiple research teams, there remains considerable potential for improvement in simplifying and reducing the steps involved in material synthesis, sensor fabrication, and developing deep learning algorithms for interpreting complex mixed analyte signals while enhancing the user experience and remote data monitoring capabilities. Improving these aspects can significantly contribute to more efficient and reliable heavy metal sensing.
This work demonstrates the fabrication of an electrochemical sensor capable of simultaneously quantifying cadmium, lead, copper, and mercury. The simultaneous sensing capabilities of the sensor for these heavy metal ions were optimized for water quality assessment. The discarded plastic waste bottles served as the base substrate for placing the 3-electrode system. The reported method supports multiplexed heavy metal sensing, quick fabrication, the use of carbon threads, and the reuse of discarded plastic. The AuNPs were electrochemically deposited on the surface of the working electrode thread surface, and the reference electrode was modified with Ag/AgCl ink. The sensor was characterized via DPV for all four heavy metal ions, offering an advance in the removal of the pre-concentration step. The experiments were carried out with all possible single, double, three, and four metal combinations to understand the sensor capabilities. The sensor underwent extensive testing to assess its performance under various conditions, including its response to different pH values, its ability to function in the presence of other heavy metals, and its effectiveness in analyzing real water samples from various lakes. The fabricated sensor was collated with neural networks, enabling it to interpret complex electrochemical signals accurately and provide qualitative heavy metal contamination in water samples to users. Furthermore, the entire model was deployed on the cloud to facilitate remote access to results and seamless user interpretation and experience. To summarize, the presented device is designed to quantify the concentrations of cadmium, lead, copper, and mercury in water samples. The data obtained from the device are processed via a convolutional neural network (CNN) for accurate quantification of these heavy metals. The quantified results were then displayed on an IoT-enabled user interface.
Results
SEM analysis
SEM was employed to analyze the morphology of the surface of the working electrode to examine the changes before and after gold nanoparticles were electrochemically deposited. Figure 1(a) and (c) show scanning electron microscopy images of the carbon thread at scales of 10 µm and 1 µm, which depict smooth and well-aligned fibers. Figure 1(b) and (d) show SEM images of the AuNP-deposited carbon thread at scales of 10 µm and 1 µm, respectively. Energy-dispersive X-ray spectroscopy (EDX) analysis further validated the compositional changes resulting from gold modification. The plain carbon thread consisted of 92.27 wt% carbon and 7.73 wt% oxygen, and the gold-modified thread demonstrated a composition of 90.77 wt% carbon, 3.64 wt% oxygen, and 5.56 wt% gold. This notable increase in the Au content, coupled with the observation of nearly spherical nanoparticle-like structures, confirms the successful functionalization and surface modification with gold nanoparticles (AuNPs). Figure 1(e) and (f) illustrated the elemental mapping of unmodified and modified carbon threads where the unmodified threads contained only carbon and oxygen, and the modified threads contained clear, concentrated spots of AuNPs across the fiber surfaces along with carbon and oxygen. Further information on the EDX spectrum and individual element mapping for the plain carbon thread and AuNP-modified carbon thread is included in supplementary figs. 2 and 3. This indicates a distribution of gold nanoparticles across the fiber surfaces, indicating successful deposition.

a Plain thread at a scale of 10 µm, b AuNPs deposited thread at a scale of 10 µm, c plain thread at a scale of 1 µm, d AuNPs deposited thread at a scale of 1 µm, e elemental mapping and composition of plain thread, f elemental mapping and composition of AuNPs deposited thread.
Electrochemical Sensing of Cadmium, Lead, Copper, Mercury
Solutions containing the heavy metal ions Cd2+, Pb2+, Cu2+, and Hg2+ at various concentrations ranging from 1 µM to 100 µM were prepared using HCl-KCl buffer solution (pH-2), which is clearly explained in section 2.3. All the experiments and solution preparation were performed at 1 atm pressure and a temperature of 25 °C. Furthermore, DPV was conducted using the fabricated sensor with a voltage range of -1V to 1 V, a scan rate of 15 mV/s, a pulse amplitude of 90 mV, and a pulse time of 25 ms to enhance redox reactions and minimize capacitive currents. Initially, the sensor was subjected to each metal ion individually at the prepared concentrations, as shown in Fig. 2(a) cadmium ions, (b) lead ions, (c) copper ions, and (d) mercury ions. The peak potentials of the heavy metals, Cd2+, Pb2+, Cu2+, and Hg2+, were observed at approximately -0.85 V, -0.60 V, -0.20 V, and 0.20 V, respectively, with sharp oxidation peaks for each metal ion. Then, electrochemical detection was carried out with all four metals detected simultaneously from a concentration range of 1 µM to 100 µM. Figure 2(e) shows the concentration effects of Cd2+, Pb2+, Cu2+, and Hg2+ when tested simultaneously. As the concentration of the heavy metals increased, the peak current of each individual metal increased, indicating a linear relationship between the metal concentration and peak current. Regression parameters were evaluated to obtain insights into linearity. The coefficients of determination (R²) for the metal ion sensing plots were 0.9773, 0.9908, 0.9572, and 0.9877, respectively, demonstrating a nearly perfect linear fit. The calibration curves are shown in Fig. 2(f), and the limits of detection (LoDs)27 were calculated for Cd2+, Pb2+, Cu2+, and Hg2+ as 0.99 µM, 0.62 µM, 1.38 µM and 0.72 µM respectively. Furthermore, the limit of quantification (LoQ) was calculated to be 3 µM for Cd2+, 1.88 µM for Pb2+, 4.18 µM for Cu2+, and 2.18 µM for Hg2+ ions.

a Cadmium ions, b lead ions, c copper ions, d mercury ions, and e all four metal ions ranging from 1 µM to 100 µM in HCl-KCl buffer f linear relationship graph of simultaneously tested metal ions.
pH effect
To study the influence of varying pH levels on the proposed heavy metal sensor, experiments were conducted across different pH environments—acidic, neutral, and basic. The HCl-KCl buffer used in all the experiments was acidic and had a pH of 2. NaOH was added to this buffer to achieve pH 7 and pH 10. Heavy metal solutions of each 100 µM concentration were prepared with pH 2, pH 7, and pH 10 solutions and were tested with the proposed sensor, as illustrated in Fig. 3. The results indicated no electrochemical activity of the heavy metals at neutral and basic pH values, providing strong evidence that the proposed reaction in this work was effective only under acidic conditions. Heavy metal ion sensing can also occur at various acidic pH values, as the acidic environment in buffers keeps metal ions soluble and reactive28,29.

Influence of solution pH (acidic, neutral, and basic conditions) on the sensing performance of the heavy metal sensor, evaluated with 100 µM concentrations of each heavy metal ion.
Interference effect
The interference test evaluated the ability of the proposed sensor to distinguish the target metal ions accurately from other pollutants or contaminants present in the water sample. To analyze the selectivity of the fabricated sensor, 0.1 µM solutions of common interfering agents such as chromium, zinc, molybdenum, nickel, nitrate, nitrite, and hydrazine were prepared using HCl-KCl buffer. These agents were added sequentially to a 1 µM heavy metal solution containing cadmium, lead, copper, and mercury. The DPV tests were conducted after adding each interfering agent to the 1 µM all-metal ion solution, and the peak currents were recorded. The readings are presented as a bar graph in Fig. 4, which shows peak current values for each interfering agent at the oxidation potential of the respective metal ions. The maximum deviation of the peak currents was observed to be 6.3% for Cd2+, 3.01% for Pb2+, 4.2% for Cu2+, and 15.3% for Hg2+ ions. Although the deviation for mercury ions was relatively high when detected simultaneously with other metal ions, this could be improved in future work by enhancing surface modification and incorporating selective membranes. Overall, the results indicated that the proposed sensor maintained acceptable selectivity in detecting these metal ions.
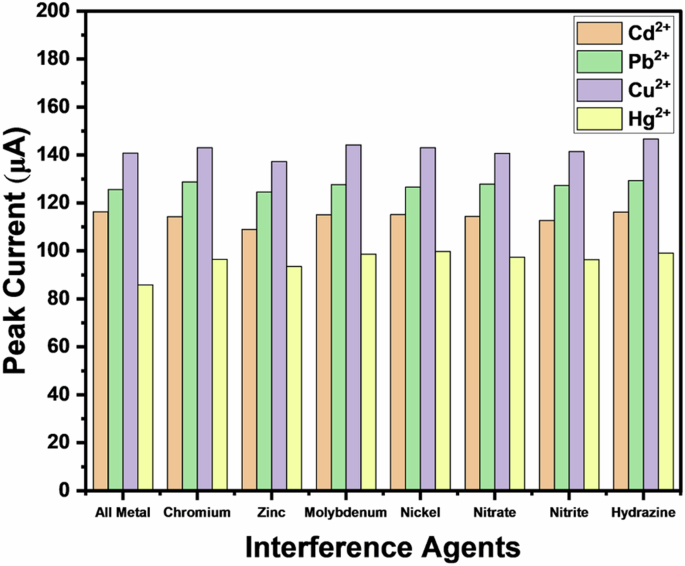
Bar plot showing the peak current values of interfering metal ions (0.1 µM each) when sequentially added to 1 µM solutions of Cd²⁺, Pb²⁺, Cu²⁺, and Hg²⁺, as detected by the developed heavy metal sensor.
Repeatability and Reproducibility Study
The repeatability of the fabricated sensor was calculated by performing DPV experiments using the same sensor on a 1 µM solution of Cd²⁺, Pb²⁺, Cu²⁺, and Hg²⁺ ion solutions. The experiments were conducted three times, and the outcomes were presented in Fig. 5(a). The relative standard deviations (RSDs) recorded were 4.03% for Cd²⁺, 3.59% for Pb²⁺, 8.52% for Cu²⁺, and 3.02% for Hg²⁺, respectively, signaling excellent repeatability. Multiple sensors were fabricated following the same procedure and tested on the same heavy metal ion solutions to assess reproducibility. Figure 5(b) presents the peak current values from three different sensors. The RSD values for the reproducibility tests were 7.75%, 9.94%, 8.44%, and 8.27% for Cd²⁺, Pb²⁺, Cu²⁺, and Hg²⁺, respectively. These results demonstrated that the sensor was highly repeatable and reproducible.

a Repeatability and b reproducibility.
Real Sample Testing
The established sensor was tested on real water samples collected from Hussain Sagar, Kapra, and Shamirpet Lakes in the vicinity of Hyderabad City (Telangana, India) to evaluate its ability to quantify heavy metals in natural water bodies. The collected water samples were first diluted by mixing equal amounts of lake water with HCl-KCl buffer, resulting in a 1:1 dilution ratio. Then, to the prepared samples, 1 µM and 10 µM of each metal ion solution were added and tested using DPV. Table 2 shows the concentration values inferred from the recovery percentages.
Metal ion Classification using a CNN for Qualitative Analysis
In this work, the qualitative prediction of Cd²⁺, Pb²⁺, Cu²⁺, and Hg²⁺ ions were achieved by training four individual models with identical input data but different outputs. Each model identifies the metal ion for which it was trained. Finally, the binary results from each model were combined to produce a 1 × 4 vector, which was then ensembled. The validation split was set to 20% to prevent overfitting. Figure 6 displays the confusion matrices illustrating the classification efficacy for the four heavy metal ions by the proposed model. The matrices indicated minimal false positives and false negatives, reflecting a low incidence of Type I and Type II errors. Furthermore, the accuracy, precision, recall, and F1 scores were calculated and tabulated in Table 3 using Eqs. 1–4, where TP is a true positive, TN is a true negative, FP is a false positive, and FN is a false negative.

Confusion matrices indicating the performance of the model in the identification of heavy metal ions.
The model achieved near-perfect accuracy scores in both the training and validation sets, with precision and recall values that were consistently close to 1.0. This suggests that the model is highly accurate in detecting these metals, with minimal false positives and false negatives. Therefore, the model makes minimal inaccurate positive predictions and rarely misses true positive occurrences. This suggested that the model efficiently handled both Type I and Type II errors, which is crucial in scenarios requiring accurate and reliable estimation of metal ions, and was suitable for deployment. Furthermore, this model can be extended for qualitative analysis.
IoT implementation
The IoT framework was designed to ensure seamless data acquisition, processing, and reporting through an interactive web interface. The trained model for the qualitative detection of four heavy metals was deployed on a Streamlit Cloud, which allowed for continuous integration and deployment through GitHub. A user-friendly web interface was designed, enabling users to submit their data files for analysis in .xlsx format, as illustrated in Fig. 7a. The interface also displays a graphical representation of the DPV data and the qualitative results of heavy metal detection, as shown in Fig. 7b. This system allows users to log in with a username and password, then effortlessly upload or drag-and-drop an Excel sheet containing sample data, and obtain results with a single click, all without needing technical expertise, while also handling multiple user requests simultaneously.

a Web interface (user login page), b graphical representation of quantitative results for metal ion sensing.
Discussion
This study highlights the fabrication and characterization of an electrochemical sensor emphasizing on rapid fabrication with AuNPs deposited carbon thread as a working electrode for the simultaneous measurement of cadmium, lead, copper, and mercury ions in water samples. The electrochemical characterization was carried out by DPV, and the peak potentials were observed at approximately -0.85, -0.60, -0.20, and 0.20 V for Cd2+, Pb2+, Cu2+, and Hg2+, respectively. The developed sensor demonstrated high sensitivity and selectivity while achieving detection limits of 0.99 µM for Cd²⁺, 0.62 µM for Pb²⁺, 1.38 µM for Cu²⁺, and 0.72 µM for Hg²⁺, with a linear range of 1 µM to 100 µM for each ion. The potential for practical use was demonstrated using water samples from three different lakes, which indicated satisfactory levels of recovery percentages. The inherent complexity of electrochemical data was effectively addressed by integrating deep learning through CNNs, which significantly improved the interpretability of the DPV test, yielding high accuracy in metal ion classification. The models achieved near-perfect accuracy, precision, recall, and F1 scores, representing robust performance with minimal false positives and negatives. The IoT framework made the system user-friendly and accessible from any location with internet connectivity. This whole system can eventually be combined with a portable electrochemical measurement system to provide on-site analysis and real-time data monitoring for users.
Methods
Materials, Chemicals, Equipment and Resources
Plastic water bottles were collected from trash bins at the BITS Pilani Hyderabad campus (India). These collected bottles were flattened using a sheet laminating machine (Model 304) from Lincoln, United Kingdom. Herein, carbon threads (ELAT LT 2400 W from a Fuel Cell Store in Texas, USA) were used as electrodes. The construction of the 3-electrode system was facilitated by a laser cutting and engraving machine (VLS 3.60 from Universal Laser Systems, based in Scottsdale, AZ, USA). Ag/AgCl ink was used to modify the reference electrode with a surface resistance of 0.2 Ω/sq/25.4 µm (supplied by ALS, Japan). The cyclic voltammetry (CV) and DPV measurements for calibrating the sensor were performed utilizing a potentiostat (OGF500 from OrigaFlex, Lyon, France). The morphology studies were performed using a scanning electron microscope (SEM) Microscope (Apreo, Thermo Fisher Scientific, USA), and the pH studies were conducted using a portable pH meter (HI98129) from Hanna Instruments, USA. The gold AAS standard solution in 0.5 N HCl was acquired from SR Life Sciences, whereas hydrochloric acid (32%) and potassium chloride (KCl) were procured from AVRA Synthesis Pvt. Ltd. and Himedia, respectively. Deionized (DI) water, purified to 18.2 MΩ.cm by Milli-Q, was used in all the experiments. All the other reagents and chemicals were of analytical grade unless otherwise stated. Samples of water for analysis were obtained from Kapra Lake, Shamirpet Lake, and Hussain Sagar Lake, all of which are located near Hyderabad city, India. In this study, Google Colab, a cloud-based platform, was used to run the deployed model. IoT integration was achieved via Streamlit for interactive user interfaces.
Sensor Fabrication
The discarded plastic bottles were collected, meticulously cleansed with 70% isopropanol solution to sterilize them, eliminate any remaining substances, and subsequently dried. The plastic bottles were then sliced and flattened using a hot roll laminator at a temperature of 100 °C. The substrate design of the heavy metal device was developed in Autodesk Fusion 360 software, then translated into a .dxf file format and uploaded to the laser apparatus. The flattened plastic sheet underwent precision cutting and laser ablation in accordance with the details of the design. The configuration on the plastic sheet consists of two distinct layers: an upper layer and a lower layer. The carbon threads were initially subjected to plasma treatment for one minute for enhanced surface reactivity30. Three carbon thread electrodes of 30 mm were strategically positioned on the lower layer, whereas the upper layer served the purpose of secure encapsulation. Following this arrangement, the upper and lower layers were sealed via a laminator, creating a compact well capable of holding approximately 50 µL of sample. One plain carbon thread was considered as a counter electrode (CE), and the second carbon thread was modified with Ag/AgCl ink and considered as a reference electrode (RE), followed by drying at 60°C for an hour. The well was subsequently filled with standard gold solution to facilitate the deposition of Au nanoparticles onto the third carbon thread, namely the working electrode (WE). The electrochemical deposition was performed using cyclic voltammetry (CV), where the potential was varied from -1 to 1 V at a scan rate of 50 mV/s for 20 cycles, and the CV graph is shown in Supplementary Fig. 1. After the gold nanoparticles were deposited onto the carbon thread, the device was rinsed with deionized (DI) water to eliminate any remaining excess product and then dried in an oven at temperatures between 40 and 50 °C for a period of 10 minutes. The entire fabrication process of the heavy metal sensor is depicted pictorially in Fig. 8.
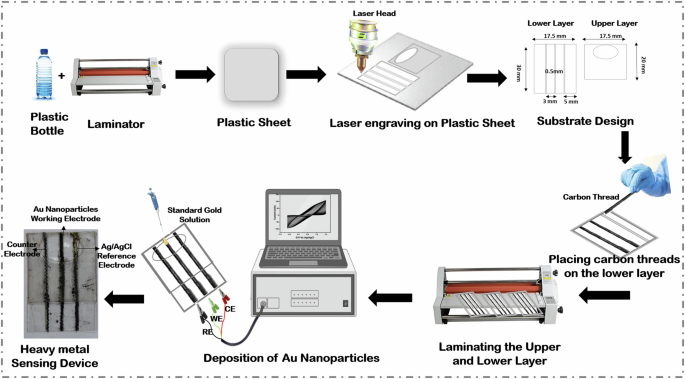
The pictorial representation of the entire fabrication process for the heavy metal sensing device.
Data Acquisition and Preprocessing
The data obtained from DPV analysis were used to create a dataset, which consisted of two parameters at each data point – voltage and current. The experiments were performed with various heavy metal concentrations of 0 µM (HCl -KCl buffer solution), 1, 10, 20, 30, 40, 50, 60, 70, 80, 90, and 100 µM each for cadmium, lead, copper, and mercury, respectively. The same approach was employed for two, three, and four metal combinations, leading to an experimental set of (12 × 15), which produced 180 DPV curve data points, with each DPV file containing approximately 4445 data points of voltages and currents. The total dataset size reached 800100 data points. After the data were acquired, principal component analysis (PCA) was employed for dimensionality reduction, transforming the dataset from a two-dimensional (2D) space to a one-dimensional (1D) space31. This transformation preserved critical patterns that indicated the presence of various heavy metals. Each principal component represents a linear combination of the original variables and is ranked according to the amount of variance it is explained within the dataset. To address the common issue of overfitting and data imbalance in classification models, the synthetic minority oversampling technique (SMOTE)32 was applied to each metal ion dataset before feeding it to each model. SMOTE increases the number of input vectors for the minority class by generating new vectors. These vectors were synthesized by considering a fixed number of nearest neighbors within the minority class. This approach mitigated class imbalance and reduced overfitting during the model training phase. Furthermore, the dataset was split, with 80% allocated for training purposes and the remaining 20% allocated for testing.
Data Modeling
The dataset was modeled using four interconnected one-dimensional convolutional neural network (1D-CNN) models to detect and classify each heavy metal ion. Each model shares a standard input layer, and all the models process the same input data. The CNN employs layers of kernel convolution, where the kernel moves across the array and modifies it according to its values, as represented in Eq. (5)33.
where G [m, n] is the output feature map, f represents the input data, and h represents the convolution kernel. Each metal ion model consisted of two 1D CNN layers, followed by a single artificial neural network (ANN) layer. The overall structure of the model is clearly illustrated in Fig. 9. The output layer features a single node with a sigmoid activation function, as defined by Eq. (6).

The proposed architecture of a fully connected CNN model for the identification of each metal ion.
The sigmoid function S(x) outputs probabilities between 0 and 1, with values ≥ 0.5 indicating the presence of metal ions. This threshold was established by analyzing the area under the curve (AUC) from the receiver operating characteristic (ROC) curve, which helps to optimize decision-making and minimize overconfidence during model training.
IoT integration
The trained models were serialized by pickling, preserving their state and parameters for deployment. These serialized models, along with an intuitive Streamlit interface, were deployed on a cloud server. The Streamlit interface allows users to upload CSV files containing DPV data of heavy metal ions. Once the file was uploaded, the system processed the data via cloud-hosted deep learning models. These models analyse the uploaded DPV curve data, perform qualitative analysis, and generate results for the quantitative assessment of four heavy metals in a given water sample. The reports provided information on specific heavy metals and included visual plots for data interpretation. This system also features secured user authentication, ensuring that only authorized users can access the analysis tools and results, thereby protecting sensitive data and maintaining system integrity. This cloud deployment ensures scalability and accessibility from any internet-enabled location.


Responses