Kdm2a inhibition in skeletal muscle improves metabolic flexibility in obesity
Main
Skeletal muscle constitutes 40–50% of total body mass and accounts for approximately 30% of basal energy expenditure1. In general, skeletal muscle is characterized by flexibility of changes in terms of muscle mass, metabolic characteristics and myofiber type, thereby maintaining the homoeostasis of metabolism2,3, and increasing attention is being directed towards targeting skeletal muscle to optimize systemic metabolism3,4,5,6,7,8. Indeed, there is convincing evidence that obesity is generally manifested by a lower proportion of slow-twitch myofibers (STMs) along with mitochondrial dysfunction, which then predisposes to the development of insulin resistance and other severe metabolic disorders, such as type 2 diabetes, fatty liver and cardiovascular disease9,10,11,12,13,14,15,16,17.
Previous studies, including our own, have demonstrated that epigenetic mechanisms serve as a bridge to link environmental insults to the pathogenesis of metabolic disorders in genetically predisposed subjects18,19,20,21,22,23. Specifically, post-translational modifications (PTMs) of histone proteins are considered to be an important epigenetic factor in regulating the function of skeletal muscle, with rapid responses and a variety of modification characteristics18. Histone acetylation has been demonstrated to have a critical role in the regulation of GLUT4 expression, glucose uptake and insulin-mediated glycogen synthesis24. However, the intricate nature of histone methylation in skeletal muscle and its impact on metabolic homoeostasis have yet to be elucidated.
In the current study, we identified a significant discrepancy in terms of histone H3 dimethylation at lysine (K) 36 (H3K36me2) between STMs and fast-twitch myofibers (FTMs) in both male and female mice. In general, the mitochondria-rich STMs, represented by the soleus, are prone to aerobic metabolism, which uses both glucose and lipids as the main fuel. By contrast, the BAF60c-driven FTMs3, represented by the extensor digitorum longus, are prone to anaerobic metabolism by using glucose as the major energy source. In the majority of experiments, male mice have been used as the representative. We found that lysine (K)-specific demethylase 2A (Kdm2a; https://www.ncbi.nlm.nih.gov/gene/225876), a histone demethylase, regulates the FTM–STM transition. Therefore, deletion or inhibition of Kdm2a promptly shifts the fuel use from glucose under cold challenge to lipid in the obese condition by increasing the proportion of mitochondria-rich STMs, which then enhances the capability of mice against cold insult and protects the mice from high-fat-diet (HFD)-induced obesity and insulin resistance. Mechanistically, Kdm2a promotes histone 3 (H3) demethylation at the Esrrg locus and prevents Mrg15 from splicing Esrrg precursor messenger RNA (pre-mRNA), which inhibits lipid oxidation and the STM transition in skeletal muscle. These findings not only fill a gap in our understanding of the mechanisms underlying skeletal muscle myofiber transition but also suggest that Kdm2a could be a promising target against metabolic stress in clinical settings.
Results
Kdm2a catalyses H3K36me2 demethylation and reduces STM proportion
We fortuitously observed significantly elevated levels of histone lysine-pan-dimethylation in both male and female aerobic STMs along with markedly higher expression of proliferator-activated receptor gamma coactivator 1-alpha (Pgc1a) (Fig. 1a and Supplementary Fig. 1a), a key regulator of energy metabolism and mitochondrial biogenesis25,26,27,28, compared to the anaerobic FTMs. By contrast, no discernible difference in terms of histone lysine-pan-monomethylation and trimethylation was noted (Fig. 1a and Supplementary Fig. 1a). These results prompted us to focus on the enzymes relevant to lysine-pan-dimethylation in both STMs and FTMs. Interestingly, lysine-specific demethylase 2A (Kdm2a), which is known to specifically catalyse the demethylation of H3K36me2, was noted to be selectively highly expressed in FTMs compared to the other lysine-pan-dimethylation enzymes at both mRNA (Extended Data Fig. 1a) and protein levels (Fig. 1b and Supplementary Fig. 1b), which was coupled with a significant decrease in H3K36me2 levels (Fig. 1b and Supplementary Fig. 1b). These findings support a critical role of Kdm2a in the regulation of H3K36me2 levels in skeletal muscle, regardless of gender difference.
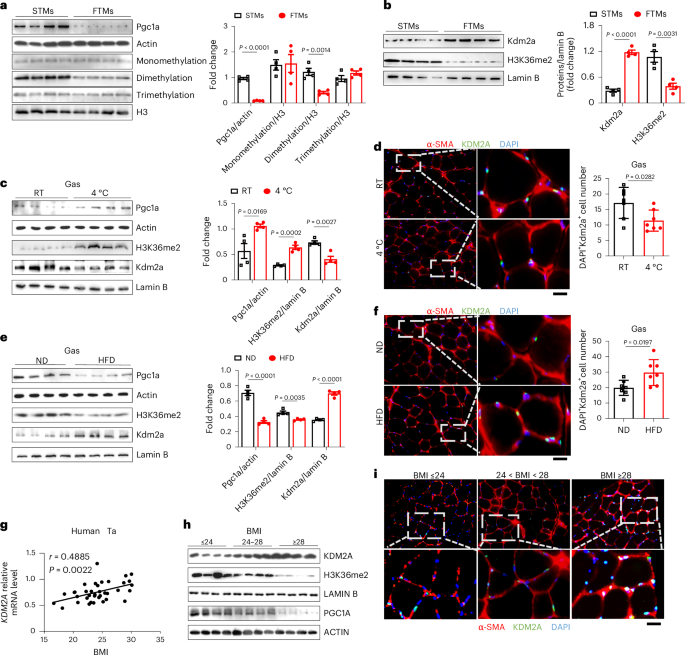
a, Western blot analysis of Pgc1a, monomethylation, dimethylation and trimethylation levels between STMs (soleus) and FTMs (extensor digitorum longus) from male WT mice fed with a normal diet (n = 4); protein quantitative analysis is shown on the right. b, Western blot analysis of Kdm2a and H3K36me2 between STMs and FTMs from male WT mice fed with a normal diet (n = 4); protein quantitative analysis is shown on the right. c, Western blot analysis of Pgc1a, H3K36me2 and Kdm2a from Gas tissues of male WT mice from room temperature (RT) and cold-adapted (4 °C) groups (n = 4 per group); protein quantitative analysis is shown on the right. d, Representative immunostaining of Kdm2a (green), α-SMA (red) and DAPI (blue) in cross sections of Gas tissues from male WT mice from RT and cold-adapted (4 °C) groups. Scale bars, 50 μm. DAPI+Kdm2a+ cell number was counted (right) (n = 7 per group). e, Western blot analysis of Pgc1a, Kdm2a and H3K36me2 from Gas tissues of male mice fed a normal diet (ND) and HFD (n = 4 per group); protein quantitative analysis is shown on the right. f, Representative immunostaining of Kdm2a, α-SMA (red) and DAPI (blue) in cross sections of Gas tissues from ND-fed and HFD-fed male mice. Scale bars, 50 μm. DAPI+Kdm2a+ cell number was counted (right) (n = 7 per group). g, Correlation analysis between BMI and KDM2A levels in human tibialis anterior (Ta) samples (n = 37). h, Western blot showing KDM2A, H3K36me2 and PGC1A expression in Ta tissues of lean subjects (BMI ≤ 24, n = 3), overweight subjects (24 < BMI < 28, n = 3) and obese subjects (BMI ≥ 28, n = 3). i, Representative immunostaining of KDM2A, α-SMA (red) and DAPI (blue) in Ta tissue cross sections from lean subjects (BMI ≤ 24, n = 7), overweight subjects (24 < BMI < 28, n = 7) and obese subjects (BMI ≥ 28, n = 7). Scale bars, 50 μm. Data are represented as mean ± s.e.m. Statistical significance was assessed by unpaired two-sided Student’s t-test (a–f) and two-sided Spearman’s correlation (g).
Source data
To further address the above question, we exposed male mice to cold temperatures, as cold adaptation is a powerful inducer of non-shivering thermogenesis and enhances the metabolic capacity of skeletal muscle by increasing the proportion of STMs29,30,31,32,33. Following 2 weeks of cold adaptation, enhanced Pgc1a expression was detected in the gastrocnemius (Gas), a type of skeletal muscle that contains both STMs and FTMs, with manifestations of a high degree of flexibility in response to different stimuli coupled with a marked increase of H3K36me2 levels and a significant decrease in Kdm2a expression (Fig. 1c and Supplementary Fig. 1c). Immunostaining of Gas sections further validated a conspicuous reduction of Kdm2a expression in myofibers following a sustained cold insult (Fig. 1d). Of note, a similar phenotype was also observed in cold-stimulated C2C12 myotubes (Extended Data Fig. 1b). Unlike cold-induced non-shivering thermogenesis, obesity induced by excessive accumulation of glucose and lipids is commonly associated with decreased STMs along with a reduced capacity to withstand cold challenge15,16,34,35. Therefore, we next challenged the mice to 16 weeks of HFD induction. Indeed, HFD induced a significant reduction of Pgc1a expression, accompanied by decreased H3K36me2 levels and increased Kdm2a expressions in skeletal muscle (Fig. 1e). The increased Kdm2a expression was also confirmed by immunostaining of Gas sections (Fig. 1f). Similarly, we detected increased Kdm2a and decreased H3K36me2 levels in a hyperglycaemia model (Extended Data Fig. 1c). Treatment of C2C12 myotubes with either palmitic acid (0.8 mM) (Extended Data Fig. 1d) or high glucose (30 mM) (Extended Data Fig. 1e) yielded analogous results. We also established female cold-adapted (Supplementary Fig. 1c), HFD-challenged (Supplementary Fig. 1d) and hyperglycemic mouse models (Supplementary Fig. 1e), and similar results were observed.
To validate the above findings in humans, we examined the relationship between body mass index (BMI) and KDM2A expression levels in the human tibialis anterior muscle. Remarkably, a positive correlation was detected between KDM2A expression and BMI (Fig. 1g). Specifically, a BMI-dependent upregulation of KDM2A expression was noted, which was coupled with decreased H3K36me2 levels and attenuated PGC1a expression in the tibialis anterior muscle (Fig. 1h and Extended Data Fig. 1f). Immunostaining of tibialis anterior sections further confirmed the correlation between KDM2A expression in tibialis anterior myofibers and BMI (Fig. 1i and Extended Data Fig. 1g). Collectively, our data support that Kdm2a catalyses H3K36me2 demethylation, thus reducing the proportion of STM in the Gas upon the challenge of metabolic stress.
Enhanced glucose consumption in Kdm2a knockout mice under cold insult
To further address the functional impact of Kdm2a on the metabolic properties of skeletal muscle, an inducible skeletal muscle-specific Kdm2a knockout (KO) mouse model (referred as Kdm2aSKO) was developed by crossing Kdm2afl/fl mice with the ACTA1-rtTA-tetO-Cre mice, and Kdm2a deficiency was induced in 8-week-old mice by tetracycline (Supplementary Fig. 2a). In consideration of mouse reproduction, subsequent experiments were conducted in male mice. The Kdm2aSKO mice and their control littermates were then subjected to a cold challenge. It was noted that the Kdm2aSKO mice showed greater temperature stability following 2 weeks of cold challenge (Fig. 2a) and exhibited a higher random body temperature after completion of the cold challenge (Fig. 2b). A similar phenotype was also observed under the resting state (Supplementary Fig. 2i). However, there was no difference in Ucp1 and mitochondrial-complex-related gene expression in both subcutaneous fat (Supplementary Fig. 2j) and brown fat (Supplementary Fig. 2k), further demonstrating that Kdm2a deficiency specifically promotes skeletal muscle thermogenesis. It is noteworthy that the Kdm2aSKO mice manifested significantly greater weight loss following the cold challenge (Fig. 2c), along with lower fasting blood glucose levels (Fig. 2d), improved glucose tolerance (Fig. 2e) and increased insulin sensitivity (Fig. 2f). Metabolic parameters including daytime thermogenesis (Fig. 2g), oxygen consumption (Fig. 2h) and carbon dioxide emission (Fig. 2i) were higher in Kdm2aSKO mice upon completion of the cold challenge, and no perceptible difference in terms of food and water intake was detected (Extended Data Fig. 2a). Moreover, the Kdm2aSKO mice manifested a higher consumption of glucose as evidenced by the higher respiratory exchange ratios (RERs) both in day and night following the cold challenge (Fig. 2j). Together, these data support that Kdm2a deficiency allows the mice to leverage more glucose to enhance energy production upon a cold challenge.
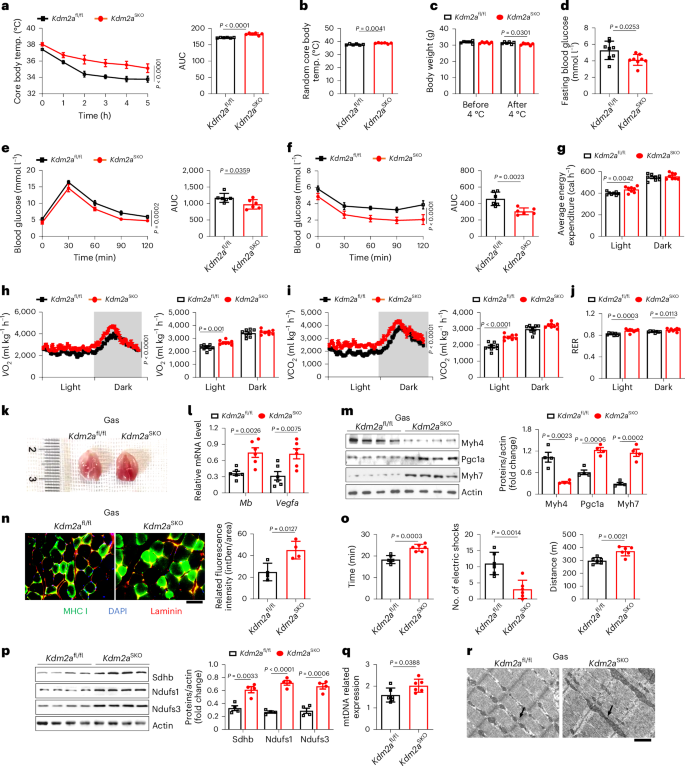
a, Core body temperature monitoring of Kdm2afl/fl and Kdm2aSKO mice at 4 °C after cold adaptation (n = 6 per group). AUC, area under the curve. b, Random core body temperature of Kdm2afl/fl and Kdm2aSKO mice (n = 6 per group). c, Body weight before and after cold adaptation of Kdm2afl/fl and Kdm2aSKO mice (n = 6 per group). d, Fasting blood glucose of cold-adapted Kdm2afl/fl and Kdm2aSKO mice (n = 8 per group). e, Intraperitoneal glucose tolerance test and f, insulin tolerance test of cold-adapted Kdm2afl/fl and Kdm2aSKO mice (n = 6 per group). g–j, Parameters measured in metabolic cages during day and night conditions in Kdm2afl/fl and Kdm2aSKO mice: average energy expenditure (g), oxygen consumption (VO2) (h), Carbon dioxide emission (i) and RER (j) (n = 8 per group). k, Representative image of Gas tissue from Kdm2afl/fl and Kdm2aSKO mice (n = 6 per group). l, RT–qPCR analysis of Mb and vascular endothelial growth factor (Vegfa) expression in Gas tissues from Kdm2afl/fl and Kdm2aSKO mice (n = 6 per group). m, Western blot analysis of Myh4, Pgc1a and Myh7 in Gas tissues from cold-adapted Kdm2afl/fl and Kdm2aSKO mice (n = 4 per group). n, Representative immunofluorescence staining of Laminin (red), MHC I (green) and DAPI (blue) in frozen sections of Gas tissues from Kdm2afl/fl and Kdm2aSKO mice. Scale bars, 50 μm; n = 4 per group; intDen, integrated density. o, Endurance capacity test showing time to exhaustion (left), electric shock times (middle) and distance to exhaustion (right) of cold-adapted Kdm2afl/fl and Kdm2aSKO mice (n = 6 per group). p, Western blot showing expression of mitochondrial biogenesis-related genes in Kdm2afl/fl and Kdm2aSKO mice (n = 4 per group). q, Relative mitochondrial DNA (mtDNA) copy number analysis of cold-adapted Kdm2afl/fl and Kdm2aSKO mice (n = 6 per group). r, Representative TEM micrographs of Gas tissues from Kdm2afl/fl and Kdm2aSKO mice. Mitochondria are indicated by arrows. Scale bars, 10 μm, n = 4 per group. Data are expressed as mean ± s.e.m. Statistical significance was assessed by two-way ANOVA (a, e, h, i) followed by Bonferroni’s multiple comparisons test or two-sided Student’s t-test (b–d, g, j, l–q).
Source data
In line with the above observations, the Kdm2aSKO mice were characterized by dark-coloured Gas muscles compared to that of wild-type (WT) mice following the cold challenge (Fig. 2k) but without a discernible difference in terms of muscle mass (Extended Data Fig. 2b), indicating an increased proportion of STMs featured by highly enriched mitochondria and myoglobin (Mb). Indeed, Gas muscles from Kdm2aSKO mice exhibited augmented myoangiogenesis (Extended Data Fig. 2c,d) without a significant alteration in muscle area (Extended Data Fig. 2c) but significantly upregulated Mb and vascular endothelial growth factor expression (Fig. 2l). Western blot analysis further revealed increased Pgc1a and Myh7 but decreased Myh4 expressions (Fig. 2m). In particular, immunostaining of Gas sections confirmed a FTM-to-STM transition (Fig. 2n and Extended Data Fig. 2e), which was further confirmed by prolonged running endurance capacity (Fig. 2o and Supplementary Video 1). Of note, we also observed elevated expression of mitochondrial respiration-associated genes (Ndufs1 and Ndufs3 of complex I, Sdhb of complex II) (Fig. 2p) and increased mitochondrial DNA content (Fig. 2q) in the Kdm2aSKO mice. Transmission electron microscopy (TEM) supported the above findings as evidenced by the increased mitochondrial numbers and cristae density in Kdm2aSKO Gas muscles (Fig. 2r). It is noteworthy that no significant difference was found in terms of body weight (Extended Data Fig. 2f), glucose tolerance (Extended Data Fig. 2g) or insulin sensitivity (Extended Data Fig. 2h) between Kdm2aSKO mice and their littermate controls under physiological condition; similar results were also observed for the expression of mitochondrial function-related genes and Pgc1a (Extended Data Fig. 2i,j).
To further confirm the above findings, Kdm2a-KO myoblasts were generated using the LentiCRISPR (v.2) approach. Western blotting verified that Kdm2a deficiency increased H3K36me2 levels (Extended Data Fig. 2k). Increased glucose uptake in Kdm2a-KO myotubes was detected upon 2 h of cold challenge (Extended Data Fig. 2l), which was consistent with the in vivo phenotype. Critically, we also observed enhanced myoangiogenesis (Extended Data Fig. 2m) and myofiber type transition (Extended Data Fig. 2m,n) along with improved mitochondrial function (Extended Data Fig. 2n,o) in the Kdm2a-KO myotubes upon 2 h of cold challenge. Taken together, our data support that loss of Kdm2a enhances glucose consumption to protect mice against cold insult by promoting mitochondria-rich STM transition.
Loss of Kdm2a promotes lipid consumption in HFD-induced mice
Given that obesity is generally coupled with mitochondrial dysfunction and reduction of the proportion of STMs17,36, we next challenged Kdm2aSKO male mice and littermate controls with a HFD for 16 weeks. Lower body weight was noted in Kdm2aSKO mice after 12 weeks of HFD challenge (Fig. 3a), which became more significant following another 4 weeks of HFD induction (Fig. 3b). Notably, the Kdm2aSKO mice also exhibited a decrease in fat mass, whereas lean mass remained relatively comparable (Fig. 3c). Moreover, Kdm2aSKO mice displayed lower fasting blood glucose (Fig. 3d) and serum insulin levels (Fig. 3e) along with enhanced glucose tolerance (Fig. 3f and Extended Data Fig. 3a) and insulin sensitivity (Fig. 3g and Extended Data Fig. 3b). The mice were then subjected to metabolic analysis. The Kdm2aSKO mice exhibited elevated rates of oxygen consumption (Fig. 3h), carbon dioxide emission (Fig. 3i) and energy expenditure (Fig. 3j) without a perceptible difference in terms of food and water intake (Extended Data Fig. 3c). In particular, the Kdm2aSKO mice were characterized by enhanced β-oxidation as evidenced by lower RER values (Fig. 3k)26,37 coupled with elevated random core body temperature at room temperature (20–24 ℃) following 16 weeks of HFD challenge (Fig. 3l). Together, these data support that Kdm2a deficiency allows mice to use more lipids for energy consumption upon a HFD challenge.
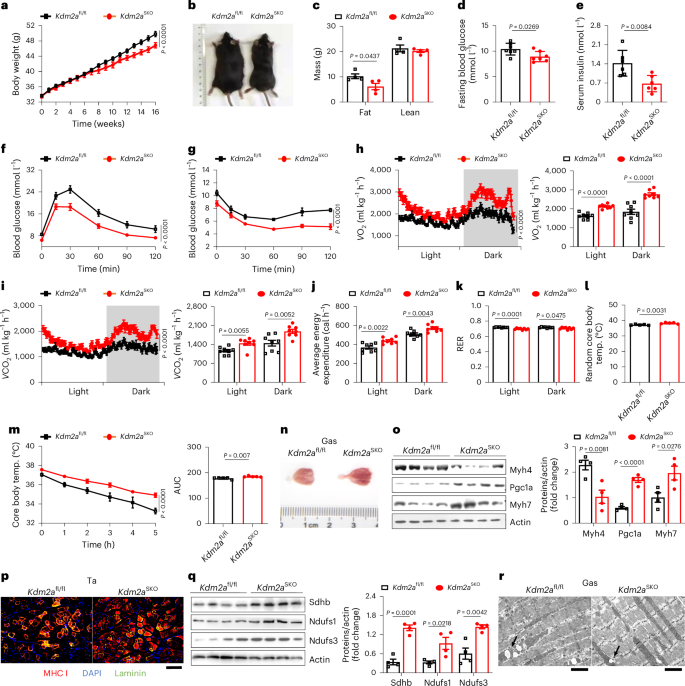
a, Body weight of HFD Kdm2afl/fl and Kdm2aSKO mice (n = 7 per group). b, Representative image of Kdm2afl/fl and Kdm2aSKO mice after 16 weeks of a HFD challenge (right) (n = 4 per group). c, Weight of fat and lean mass of HFD Kdm2afl/fl and Kdm2aSKO mice (n = 4 per group). d, Fasting blood glucose and e, serum insulin levels in Kdm2afl/fl and Kdm2aSKO mice after 16 weeks of HFD (n = 7 per group). f, Intraperitoneal glucose tolerance test and g, insulin tolerance test of Kdm2afl/fl and Kdm2aSKO mice after 16 weeks of HFD (n = 6 per group). h–k, Parameters measured in metabolic cages with HFD-fed Kdm2afl/fl and Kdm2aSKO mice: oxygen consumption and quantification in the right panel (h), Carbon dioxide emission and quantification in the right panel (i), average energy expenditure (j) and RER (k) (n = 8 per group). l, Random core body temperature at room temperature of HFD-fed Kdm2afl/fl and Kdm2aSKO mice (n = 5 per group). m, Core body temperature during fasting monitored with a cold challenge of HFD-fed Kdm2afl/fl and Kdm2aSKO mice (n = 5 per group). n, Representative image of HFD-fed Kdm2afl/fl (left) and Kdm2aSKO (right) mice Gas tissue (n = 5 per group). o, Western blot analysis of Myh4, Pgc1a and Myh7 in Gas tissues from Kdm2afl/fl and Kdm2aSKO mice fed with a HFD for 16 weeks (n = 4 per group). p, Representative immunostaining of Laminin (green), MHC I (red) and DAPI (blue) in Ta tissue cross sections from Kdm2afl/fl and Kdm2aSKO mice. Scale bars, 100 μm (n = 4 per group). q. Western blot showing expression of mitochondrial biogenesis-related proteins (Sdhb, Ndufs1, Ndufs3) in HFD-fed Kdm2afl/fl and Kdm2aSKO mice (n = 4 per group). r, Representative TEM images of Gas tissue cross sections from HFD-fed Kdm2afl/fl and Kdm2aSKO mice. Lipid droplets were indicated by arrows. Scale bars, 20 μm (n = 4 per group). Data are expressed as mean ± s.e.m. Statistical significance was assessed by two-way ANOVA (a, f–i, m) followed by Bonferroni’s multiple comparisons test or two-sided Student’s t-test (c–e, j–l, o, q).
Source data
Upon completion of the HFD induction, the mice were immediately subjected to cold challenge as described in Supplementary Fig. 1f. Similarly, the Kdm2aSKO mice exhibited an enhanced capacity to maintain their core body temperature upon the cold challenge under fasted conditions (Fig. 3m). The Gas muscles from Kdm2aSKO mice were typically dark red (Fig. 3n), indicating highly enriched mitochondrion and Mb content. No perceptible alterations were noted in terms of muscle mass (Extended Data Fig. 3d) or the average area of myotubes (Extended Data Fig. 3e). Western blot analysis (Fig. 3o), quantitative PCR with reverse transcription (RT–qPCR) (Extended Data Fig. 3g) and CD31 immunostaining (Extended Data Fig. 3f) confirmed that Kdm2a deficiency augmented myoangiogenesis as evidenced by the enhanced FTM-to-STM transition. The increased proportion of STMs was further validated by immunostaining of the tibialis anterior sections (Fig. 3p and Extended Data Fig. 3h,i) and by treadmill running assays, in which the HFD-induced Kdm2aSKO mice exhibited prolonged running endurance as shown by significantly lower electric shock incidents (Extended Data Fig. 3j and Supplementary Videos 2 and 3). In line with those observations, a significant upregulation of mitochondrial respiration-related genes (Fig. 3q) along with a marked increase of mitochondrial copy numbers were noted in the Kdm2aSKO mice (Extended Data Fig. 3k). TEM analysis of Gas sections further unveiled fewer swollen mitochondria and a higher density of mitochondrial cristae coupled with reduced lipid droplets in the Kdm2aSKO mice (Fig. 3r).
To validate the above data, we further tackled the impact of Kdm2a on lipid stress in Kdm2a-deficient myotubes. Indeed, depletion of Kdm2a produced myotubes with significantly enhanced thermogenesis, as characterized by a marked decrease in ERthermAC intensity (a heat-sensitive fluorescent dye tailored for monitoring temperature fluctuations in thermogenic cells38,39) following a 48 h palmitic acid challenge (Extended Data Fig. 3l). The enhanced thermogenesis was coupled with increased myoangiogenesis (Extended Data Fig. 3n) and STM transition (Extended Data Fig. 3m,n), enhanced mitochondrial biogenesis and oxidative respiration (Extended Data Fig. 3o,p). Taken together, our data support that loss of Kdm2a promotes an FTM-to-STM transition, thereby enhancing skeletal muscle metabolic flexibility to preferentially consume lipids and adapt to overnutrition-induced metabolic stress.
Kdm2a remodels lipid metabolism under an HFD challenge
To dissect the mechanisms by which Kdm2a regulates the transition of myofiber types, we conducted RNA deep sequencing of Gas muscle samples collected from HFD-challenged WT and Kdm2aSKO male mice. Both Kyoto Encyclopedia of Genes and Genomes (KEGG) and Gene Ontology analyses characterized the pathways relevant to lipid metabolism (Fig. 4a,b). Specifically, KEGG analysis highlighted the enrichment of PI3K-AKT and AMPK signalling pathways, both of which are known to be linked to skeletal muscle fibre type transition (Fig. 4a). RT–qPCR analysis confirmed the expression changes of genes related to lipolysis and fatty acid oxidation (Fig. 4c) as well as lipogenesis (Fig. 4d). The decrease in the expression of glycolytic genes further confirmed that loss of Kdm2a in skeletal muscle promotes the transformation of the skeletal muscle metabolic pattern from glucose to lipid metabolism, which is achieved by reshaping skeletal muscle fibre types (Extended Data Fig. 4a). This is also consistent with the lower RER value of Kdm2aSKO mice shown in Fig. 3k, which indicates preferential consumption of lipids as the main fuel for energy supply upon HFD induction. Notably, the Kdm2aSKO mice exhibited significantly lower concentrations of triglycerides and total cholesterol (T-CHO) in the Gas tissues and circulation following either HFD challenge (Fig. 4e,f) or cold challenge (Fig. 4h,i) as well as in the serum levels of free fatty acids (Extended Data Fig. 4b,c), which was further corroborated by western blot analysis of markers (such as p-ACC and Cpt1a) relevant to lipolysis (Fig. 4g,j). Similar results were observed in C2C12 myotubes following palmitic acid or cold stimulation (Extended Data Fig. 4d,e). Those observations were consistent with the TEM results of attenuated lipid droplet accumulation in the Gas muscles from Kdm2aSKO mice (Fig. 3r). Although normal-diet Kdm2aSKO mice, after the completion of the cold challenge, showed consumption of glucose as the main fuel to maintain body temperature (Fig. 2j), the loss of Kdm2a also promoted the consumption of lipid fuel. Collectively, these findings support that Kdm2a deficiency reshapes skeletal muscle lipid metabolic profiles to induce a transition from FTM to STM, thereby enhancing energy consumption to promote thermogenesis and alleviate metabolic stress.
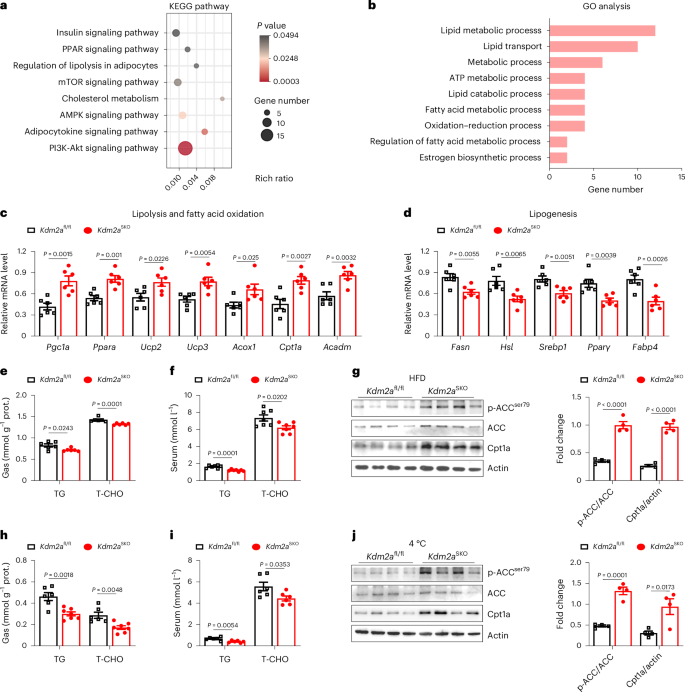
a,b, Gas tissues from HFD-fed Kdm2afl/fl and Kdm2aSKO male mice were isolated and subjected to deep RNA-seq analysis. KEGG pathways (a) and Gene Ontology (GO) analysis (b) were generated from RNA deep sequencing data (n = 3 per group). c, RT–qPCR analysis of the expression of lipolysis and fatty acid oxidation-related genes in HFD-fed Kdm2afl/fl and Kdm2aSKO male mice (n = 6 per group). d, RT–qPCR analysis of the expression of lipogenesis-related genes in HFD-fed Kdm2afl/fl and Kdm2aSKO male mice (n = 6 per group). e,f, Triglyceride (TG) and T-CHO levels in Gas tissues (e) and serum (f) of HFD-fed Kdm2afl/fl and Kdm2aSKO male mice (n = 6 or 7 per group). g, Representative western blot analysis of lipolysis-related proteins (phosphorylated ACC and Cpt1a) in HFD-fed Kdm2afl/fl and Kdm2aSKO male mice (n = 4 per group). h,i, TG and T-CHO levels in Gas tissues (h) and serum (i) of cold-adapted Kdm2afl/fl and Kdm2aSKO male mice (n = 6 per group). j, Representative western blot analysis of lipolysis-related proteins (phosphorylated ACC and Cpt1a) in cold-adapted male mice (n = 4 per group). Data are expressed as mean ± s.e.m. Two-sided unpaired Student’s t-test was used for statistical analysis (a, c–j).
Source data
Esrrg pre-mRNA splicing reshapes muscle metabolic pattern
To elucidate how Kdm2a deficiency reshapes lipid metabolism in skeletal muscle, we conducted chromatin immunoprecipitation with sequencing (ChIP–seq) analysis, using Gas tissues obtained from both HFD-fed Kdm2aSKO and Kdm2afl/fl male mice. Interestingly, co-analysis of RNA sequencing (RNA-seq) and ChIP–seq data unveiled co-upregulation in the Kdm2aSKO mice of estrogen-related receptor γ (Esrrg) (Fig. 5a), a well-recognized transcriptional activator of Pgc1a40, which has a crucial role in lipid metabolism, myoangiogenesis and mitochondrial biogenesis in skeletal muscle41,42. Western blotting and RT–qPCR analyses indeed confirmed a notable upregulation of Esrrg either in HFD-fed Kdm2aSKO mice (Fig. 5b,c) or palmitic-acid-challenged Kdm2a-KO myotubes (Extended Data Fig. 5a,b). These results prompted us to tackle the impact of H3K36me2 on Esrrg expression. Motif analysis of H3K36me2 peaks revealed discrepant binding sites between H3K36me2 and Esrrg, primarily located in the intergenic intron regions. Specifically, H3K36me2 displayed significantly higher enrichments within the intron 5 region of Esrrg (188,170 kb to 188,190 kb) (Fig. 5d). ChIP–PCR further confirmed three highly enriched peaks: peak 35,364, peak 35,366 and peak 35,370 (Fig. 5d,e). Intriguingly, RT–qPCR analysis revealed a notable decrease in terms of RNA levels for the above three fragments in the Gas tissue of Kdm2aSKO mice (Fig. 5f). These results imply that Kdm2a may catalyse H3K36me2 demethylation to regulate pre-mRNA splicing. To address this notion, primers were designed to cover the above three peaks located within intron 5 (F-intron5) and exons 4 and 5 (F-Exon4–5) (Extended Data Fig. 5d). RT–qPCR confirmed that Kdm2a deficiency (coupled with higher H3K36me2 levels) led to a significant increase in RNA levels for exons 4–5 but a marked decrease of intron 5 (Fig. 5g).
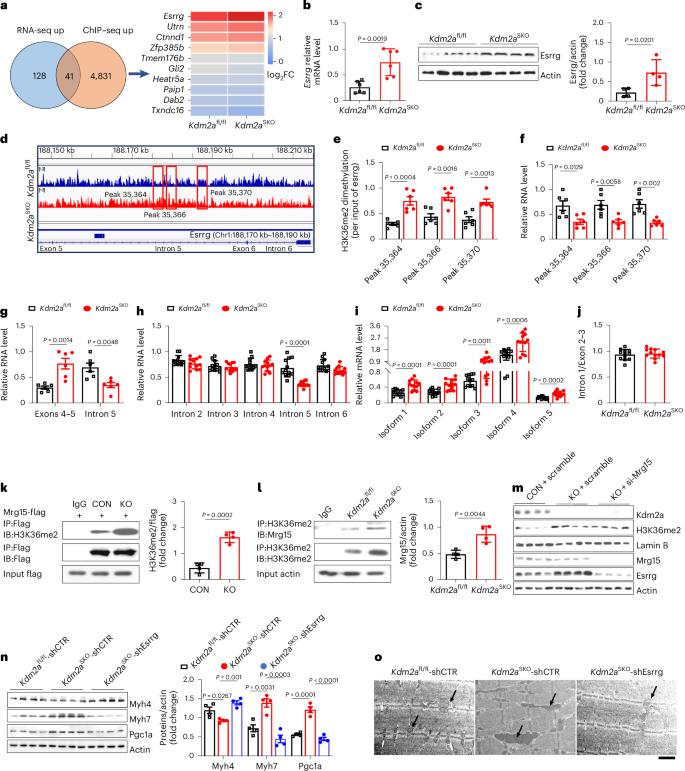
a, ChIP–seq of isolated Gas tissue from HFD-fed Kdm2afl/fl and Kdm2aSKO mice. Venn diagram showing co-upregulated genes revealed by RNA-seq and ChIP–seq (left), and heatmap showing the differentially expressed genes (right) (n = 3 per group). FC, fold change. b, RT–qPCR (n = 6 per group) and c, western blot analysis (n = 4 per group) of Esrrg expression levels in Gas tissue from HFD-fed Kdm2afl/fl and Kdm2aSKO mice. d, ChIP–seq analysis of the Esrrg locus showing the peak locations relative to the intron (n = 3 per group). e, ChIP–qPCR analysis showing intron fragments marked by H3K36me2 in Gas tissue from HFD Kdm2afl/fl and Kdm2aSKO mice (n = 6 per group). f, RT–qPCR analysis of transcribed Esrrg intron fragments in Gas tissue from HFD-fed Kdm2afl/fl and Kdm2aSKO mice (n = 6 per group). g, Relative RNA levels of transcribed Esrrg exons 4–5 and intron 5 between Gas tissue from HFD-fed Kdm2afl/fl and Kdm2aSKO mice (n = 6 per group). h, Relative RNA levels of transcribed Esrrg introns between Gas tissue from HFD-fed Kdm2afl/fl and Kdm2aSKO mice (n = 12 per group). i, Relative expression of different isoforms of Esrrg between Gas tissue from HFD-fed Kdm2afl/fl and Kdm2aSKO mice (n = 12 per group). j, The transcribed ratio of intron 1 to exons 2–3 in Gas tissue from HFD-fed Kdm2afl/fl and Kdm2aSKO mice (n = 12 per group). k, Transfection of C2C12 myotubes with Mrg15–Flag expressing plasmids. Immunoprecipitated Mrg15-Flag was probed for H3K36me2 using an anti-H3K36me2 antibody. The quantification is in the right panel (n = 4 per group). l, In HFD Kdm2afl/fl and Kdm2aSKO mice Gas tissue, immunoprecipitated H3K36me2 was probed for Mrg15 using an anti-Mrg15 antibody. The quantification is in the right panel (n = 4 per group). m, Western blot measurement of Mrg15, H3K36me2, Kdm2a and Esrrg expression levels in C2C12 myotubes (n = 4 per group). n–o, Male mouse model of skeletal muscle-specific Esrrg knockdown, (n) detected Pgc1a, Myh4 and Myh7 protein levels and (o) the representative TEM images of Gas from Kdm2afl/fl-shCTR, Kdm2aSKO-shCTR and Kdm2aSKO-shEsrrg mice (n = 4 per group). Mitochondria are indicated by arrows. Scale bars, 10 μm. Data are expressed as mean ± s.e.m. Statistical significance was assessed by two-sided Student’s t-test (b, c, e–n).
Source data
All exons of the five transcriptional variants of Esrrg are identical except for exon 1 and/or exon 2, as illustrated in Extended Data Fig. 5d,e. To dissect how H3K36me2 specifically regulates intron splicing and its potential impact on isoform formation, we designed primers targeting the common splicing regions of different isoforms and the adjacent common exon regions (F-intron1 and F-exon2–3). Moreover, primers were developed to cover the mature regions of each isoform (F-isoform1, F-isoform2, F-isoform3, F-isoform4 and F-isoform5). Additional primers were also designed to cover intron 2–6 regions (F-intron2, F-intron3, F-intron4 and F-intron6). RT–qPCR analysis revealed that intron splicing primarily occurred in the intron 5 region (Fig. 5h). Furthermore, different Esrrg isoforms exhibited a 1.7-fold to 1.9-fold increase compared to the WT mice (Fig. 5i). It is noteworthy that no significant difference was found between the WT and KO mice for the F-intron1/F-exon2–3 ratio (Fig. 5j), indicating that Kdm2a deficiency only selectively impacts the splicing of introns. In support of this notion, studies conducted in Kdm2a-KO C2C12 myotubes yielded consistent results (Extended Data Fig. 5c,f–i).
To further elucidate the involvement of H3K36me2 in Esrrg intronic splicing, mass spectrometry analysis after co-immunoprecipitation (co-IP) with an H3K36me2 antibody was carried out in C2C12 myotubes. Encouragingly, the data revealed a strong signal of the MORF-related gene on chromosome 15 (Mrg15) (Supplementary Fig. 3a). Previous reports have shown that H3K36me3 can recruit Mrg15, which can interact with polypyrimidine tract binding protein2 (PTBP2), thereby facilitating the engagement of the splicing machinery in the pre-mRNA splicing process43,44. By detecting the levels of H3K36me3 in Kdm2a-KO myotubes (Supplementary Fig. 3b) and Gas tissues of Kdm2aSKO mice (Supplementary Fig. 3c), the possible impact of H3K36me3 on Mrg15-mediated differential intron splicing was excluded. Western blot analysis of co-IP products confirmed a strong interaction between H3K36me2 and Mrg15 in the Kdm2a-KO myotubes (Fig. 5k). Additionally, elevated binding levels were observed in the Gas tissues of Kdm2aSKO mice (Fig. 5l). To confirm that H3K36me2 recruits Mrg15, which then promotes pre-mRNA maturation to enhance Esrrg expression, short interfering RNA designed to target Mrg15 (si-Mrg15 RNA) was transfected into the Kdm2a-KO myotubes. The si-Mrg15 RNA induced a significant reduction in Esrrg expression (Fig. 5m and Extended Data Fig. 6a,b), and comparable H3K36me2 levels were noted between the Kdm2a-KO and si-Mrg15 RNA transfected myotubes (Fig. 5m and Extended Data Fig. 6b). ERthermAC staining revealed an increased fluorescence intensity in si-Mrg15 RNA transfected myotubes (Extended Data Fig. 6c), indicative of attenuated thermogenesis. Furthermore, knockdown of Mrg15 reversed the phenotype of improved mitochondrial function (Extended Data Fig. 6f,g), increased STMs (Extended Data Fig. 6d,f) and enhanced lipid metabolism (Extended Data Fig. 6e,f) caused by Kdm2a deficiency. Similarly, knockdown of Mrg15 expression reversed the basal and maximal mitochondrial oxygen consumption rates in Kdm2a-KO myotubes (Extended Data Fig. 6h), which was coupled with attenuated mitochondrial biogenesis (Extended Data Fig. 6f,g).
Next, a skeletal muscle-specific Esrrg knockdown model was generated in Kdm2aSKO mice by using scAAVrh.74.MHCK7.Hesrrg particles (defined as Kdm2aSKO-shEsrrg mice). Injection of mice with self-complementary adeno-associated viruses (scAAVs) carrying shCTR was used as a control. The transduction efficiency was assessed through immunostaining (Extended Data Fig. 7a), and western blotting confirmed a significant reduction of Esrrg expression following 1 month of viral injection (Extended Data Fig. 7b). Cold challenge revealed that knockdown of Esrrg impaired the capability of Kdm2aSKO mice to maintain the stability of their body temperature (Extended Data Fig. 7c), and decreased random body temperature was also noted at room temperature (Extended Data Fig. 7d). Their Gas muscles exhibited a reduced proportion of STMs (Fig. 5n) and were thus a much lighter colour (Extended Data Fig. 7e) along with attenuated mitochondrial biogenesis compared to the control mice (Extended Data Fig. 7f,g). TEM analysis also demonstrated decreased mitochondrial density (Fig. 5o). The Kdm2aSKO-shEsrrg mice manifested impaired lipolysis (Extended Data Fig. 7h) accompanied by an increase of triglyceride and T-CHO levels in the serum and tissues (Extended Data Fig. 7i). These findings were also corroborated by in vitro reversal experiments, in which si-Esrrg RNA was transfected into the Kdm2a-KO myotubes. Knockdown of Esrrg did not impact the H3K36me2 levels (Supplementary Fig. 4a) but reversed the phenotypes that resulted from Kdm2a deficiency, such as thermogenesis (Supplementary Fig. 4b), lipid metabolic patterns (Supplementary Fig. 4e,f), STM transition (Supplementary Fig. 4d,f) and mitochondrial function (Supplementary Fig. 4c,f).
The above observations prompted us to examine Esrrg expression profiles in both cold-challenged (Extended Data Fig. 7j) and HFD-challenged (Extended Data Fig. 7k) WT mice; its expression levels were positively correlated with H3K36me2 levels (Fig. 1c,e). Similar results were recapitulated in experiments with myotubes (Extended Data Fig. 7l,m). Importantly, studies in human muscle samples also confirmed that subjects with a higher BMI exhibited lower ESRRG levels (Extended Data Fig. 7n), and ESRRG mRNA was negatively correlated with KDM2A expression (Extended Data Fig. 7o), further confirming that Esrrg is a Kdm2a downstream target. Taken together, our data support that loss of Kdm2a promotes the formation of an H3K36me2–Mrg15 complex, thereby enhancing Esrrg pre-mRNA splicing to increase its expression.
Kdm2a could be a viable target against metabolic stress
Finally, we sought to check the feasibility of Kdm2a as a target against metabolic stress in clinical settings. Daminozide, a KDM2A inhibitor, was used for the study. WT 8-week-old male mice were fed a HFD for 16 weeks to induce obesity and insulin resistance. These mice were maintained on a HFD but subjected to sustained cold challenge for 2 weeks, and daminozide was administered by intraperitoneal injection at 50 mg kg−1 day−1 or 100 mg kg−1 day−1 or the same volume of PBS, respectively. The mice were then housed under normal temperature with a HFD for at least 24 h before the following assessments. It was noted that daminozide caused the mice to have a significantly higher random core body temperature (Extended Data Fig. 8a) and percentage of body weight loss (Extended Data Fig. 8b). Consistently, those mice exhibited significantly improved fasting blood glucose levels (Extended Data Fig. 8c), glucose tolerance (Extended Data Fig. 8d) and insulin sensitivity (Extended Data Fig. 8e). However, no dose-dependent effect was observed; therefore, we next primarily focused on those mice treated with a low dose of daminozide. In line with the above observations, metabolic assays revealed that the daminozide-treated mice displayed markedly higher rates of oxygen consumption (Fig. 6a), carbon dioxide emission (Fig. 6b) and energy consumption (Fig. 6c), along with enhanced β-oxidation as they exhibited much lower RER (Fig. 6d); no discernible difference in terms of diet and water intake was noted (Extended Data Fig. 8f). We then challenged the mice with a cold insult again and noted that the daminozide-treated mice manifested a significantly higher capability to maintain their core body temperature stability (Fig. 6e and Extended Data Fig. 8g).
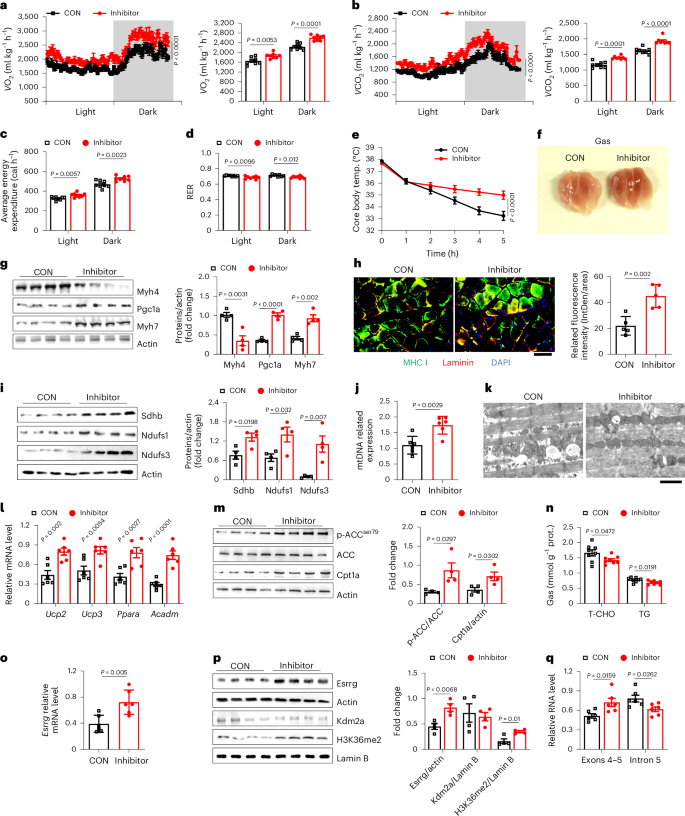
a–d, Detection of oxygen consumption (a) and carbon dioxide emission (b), with quantification in the right panels, (c) average energy expenditure and (d) RER during light and dark conditions in metabolic cages (n = 8 per group). CON, PBS control; inhibitor, diaminozide treatment. e, Core body temperature of control and inhibitor groups (n = 7 per group) at 4 °C. f, Representative Gas photograph from control and inhibitor groups (n = 4 per group). g, Western blot (n = 4 per group) analysis of Myh4, Pgc1a and Myh7 expression in control and inhibitor groups. h, Representative immunostaining of Laminin (red), MHC I (green) and DAPI (blue) in frozen sections of control and inhibitor group Ta. Scale bars: 50 μm (n = 5 per group). i, Western blot analysis of Sdhb, Ndufs1, Ndufs3 expression in control and inhibitor groups (n = 4 per group). j, mtDNA copy number in control and inhibitor groups (n = 6 per group). k, Representative TEM images in control and inhibitor group Ta. Scale bars, 5 μm, n = 4 per group. l, RT–qPCR analysis of Ucp2, Ucp3, Ppara and Acadm expression in control and inhibitor group mice (n = 6 per group). m, Western blot analysis of p-ACC/ACC and Cpt1a levels in control and inhibitor group mice (n = 4 per group). n, TG and T-CHO content Gas tissue from control and inhibitor group mice (n = 8 per group). o, RT–qPCR analysis of Esrrg levels in Gas tissue of control and inhibitor group mice (n = 6 per group). p, Western blot measurement of H3K36me2, Kdm2a and Esrrg expression levels in control and inhibitor group mice (n = 4 per group). q, Relative RNA levels of transcribed exons 4–5 and intron 5 fragments in control and inhibitor group mice (n = 6 per group). Data are expressed as mean ± s.e.m. Statistical significance was assessed by two-way ANOVA (a, b, e) followed by Bonferroni’s multiple comparisons test or two-sided Student’s t-test (a–d, g–j, l–q).
Source data
To further validate the effect of daminozide treatment, skeletal muscles were isolated for additional analysis. Unlike the controls, the Gas tissues that originated from daminozide-treated mice were dark red, indicating highly enriched mitochondria and Mb content (Fig. 6f). Although we failed to detect a marked difference in muscle mass (Extended Data Fig. 8h), enhanced FTM-to-STM transition was noted (Fig. 6g,h and Extended Data Fig. 8i). Significantly improved mitochondrial oxidative respiration (Fig. 6i) and biogenesis (Fig. 6j) were also detected. Moreover, TEM analyses revealed increased mitochondrial numbers and cristae density in the skeletal muscle sections along with decreased lipid droplets (Fig. 6k). Consistent with these observations, genes relevant to lipid metabolism were highly expressed following daminozide treatment (Fig. 6l,m), which was coupled with decreased triglyceride and T-CHO levels both in the serum (Extended Data Fig. 8j) and Gas tissues (Fig. 6n). These findings collectively demonstrate that daminozide enhances energy consumption and reshapes skeletal muscle lipid metabolic patterns under conditions of overnutrition. Of note, daminozide itself did not affect Kdm2a expression but led to a significant upregulation of H3K36me2 levels (Fig. 6p), thereby enhancing Esrrg mRNA expression (Fig. 6o) to increase its protein levels (Fig. 6p). Furthermore, RT–qPCR confirmed a decrease in expression in fragments (peak 35,364, peak 35,366, peak 35,370) (Extended Data Fig. 8k), along with increased F-exon4–5 but decreased F-intron5 expressions (Fig. 6q), demonstrating that daminozide promotes Esrrg expression by facilitating its intronic splicing. In conclusion, daminozide manifested a pronounced capacity to reprogramme skeletal muscle metabolic profiles from glycolysis to β-oxidation upon the challenge of overnutrition, whereby it augmented energy consumption against metabolic stress, thereby supporting that Kdm2a could be a viable target against metabolic stress in clinical settings.
Discussion
Chronic overnutrition caused by daily diet is commonly coupled with an excessive accumulation of mixed fuels, predisposing the development of metabolic stress45. As the largest metabolic organ in the body, skeletal muscle possesses the flexibility to selectively consume certain types of fuels to adapt to the metabolic stress resulting from overnutrition8,46. However, this adaptive mechanism is generally impaired during the development of obesity. In particular, skeletal muscle exhibits decreased mitochondria mass and impaired function coupled with a marked reduction of the proportion of STM in obese conditions11,47,48,49,50. PTMs of histone proteins, especially histone 3 methylations, a typical epigenetic factor, are thought to be highly involved, but the exact regulatory mechanisms are yet to be fully elucidated. Therefore, in the current study, we used an inducible skeletal muscle-specific Kdm2a knockout model (that is, Kdm2aSKO mice) and daminozide, an inhibitor for demethylase Kdm2a, to address the impact of H3K36me2 on the regulation of skeletal muscle metabolic flexibility upon the insult of metabolic stress. Kdm2a is highly expressed in FTMs and negatively correlated with H3K36me2 levels in mouse skeletal muscle. Similarly, KDM2A mRNA levels in the human tibialis anterior muscle are positively correlated with BMI but with attenuated PGC1a expressions, a marker relevant to energy consumption and mitochondrial biogenesis28. Mice deficient in Kdm2a exhibited a higher capability against cold challenge and were protected from HFD-induced obesity and insulin resistance. In general, Kdm2aSKO mice preferentially consumed lipids upon the insult of overnutrition and exhibited a predominant consumption of glucose under a normal diet. Intriguingly, the improved metabolic flexibility in skeletal muscle caused by Kdm2a deficiency was achieved by inducing a FTM-to-STM transition by regulating Esrrg RNA splicing.
Metabolic flexibility in skeletal muscle has long been recognized as being relevant to the capacity of the human body to maintain metabolic homoeostasis, but the underlying mechanisms have yet to be fully addressed. Our data demonstrate experimental evidence supporting that the metabolic flexibility in skeletal muscle is probably determined by a switch in energy consumption under different conditions, such as the consumption of glucose, lipids, glycogen and amino acids. Indeed, previous studies have suggested feasible evidence that the type of exercise affects the absorption and use of fuels by skeletal muscle, thereby reshaping its metabolic style8,51. Specifically, short-term exercise consumes considerable glucose and glycogen, while long endurance and resistance exercise require the use of fatty acid oxidation for energy demand52,53,54. Similarly, undernutrition or overnutrition exerts a profound effect on skeletal muscle metabolism by altering fuel use, fuel handling and storage capacity55. In line with those observations, conditions such as sepsis, cachexia, metabolic acidosis, ageing and diabetes are often coupled with muscle atrophy accompanied by elevated amino acid catabolism in skeletal muscle56,57,58. Our studies support that H3K36me2 levels are a key factor underlying the regulatory mechanisms. In particular, Kdm2aSKO mice exhibited a significantly higher RER than WT mice on a normal diet, and the RER was markedly reduced following a HFD challenge. These findings support that the elevated H3K36me2 levels resulting from Kdm2a deficiency allow skeletal muscle to facilitate a rapid shift from glucose to lipid use upon the insult of metabolic stress, thereby enhancing its metabolic flexibility to prevent the excessive accumulation of mixed fuels. It is noteworthy that metabolic flexibility has been largely proposed as being a beneficial factor, although conflicting effects could also occur under certain conditions. For example, electron transport chain dysfunction leads to excessive hepatic lipid deposition, deletion of pyruvate dehydrogenase 4 (Pdk4) allows pyruvate oxidation to acetyl-CoA and this metabolic inflexibility promotes improvements in mitochondrial health during liver regeneration59. Therefore, the identification of targets capable of regulating skeletal muscle metabolic flexibility may pave the way to develop viable strategies against metabolic disorders in different clinical settings.
Histone modifications, an epigenetic factor, are now recognized to have a crucial role in the regulation of metabolic flexibility in skeletal muscle. Typically, endurance exercise increases the cytoplasmic translocation of histone deacetylase 4 (HDAC4) and HDAC5 to enhance the activity of a myogenic transcription factor, MEF2, which then transcribes genes to improve running performance and reduce muscle fatigue60,61,62. Nevertheless, the impact of histone methylations on the regulation of metabolic flexibility in skeletal muscle is mostly unresolved. Herein, we found that depletion of Kdm2a, an enzyme highly expressed in FTMs to specifically catalyse the demethylation of H3K36me2, significantly improves the capacity of mice to withstand endurance exercise by targeting Esrrg to promote mitochondrial biogenesis. The correlation between KDM2A activity and ESRRG expression was also confirmed in human tibialis anterior muscle samples. Our data support that H3K36me2 levels in the skeletal muscle could be a critical marker to manifest the capacity of a particular individual to adapt to the challenge of metabolic stress.
Upon identification of the first methyltransferase responsible for the methylation of specific residues in the histone tails63, follow-up studies opened the door to characterize many such enzymes and eventually led to the identification of many related histone demethylases64. Other than methylation, a plethora of PTMs have also been identified on histones to date, such as acetylation, phosphorylation, SUMOylation, ubiquitination, succinylation, butyrylation and others64,65. Of note, histone lysine methyltransferases are very dedicated enzymes, with enzymatic machinery devoted to the methylation of a specific lysine residue on a specific histone66. We obtained a similar result for Kdm2a, a histone demethylase specifically upregulated in FTMs upon the insult of metabolic stress. In general, histone methylations are relevant to chromatin remodelling associated with gene transcription or repression. However, studies have also suggested feasible evidence for a role in RNA slicing, such as H3K36 possibly impacting RNA alternative splicing67. Herein, we demonstrated experimental evidence that the elevated H3K36me2 levels resulting from Kdm2a depletion regulate Esrrg RNA splicing, which is only limited to the splicing of introns; no perceptible impact was noted on the alternatively spliced isoforms. Of note, non-histone proteins have also been recognized to be methylated by the methyltransferases under certain conditions68; therefore, whether Kdm2a regulates the methylation of non-histone proteins in the setting of metabolic stress would be a major focus for our follow-up studies.
As mentioned earlier, modern diets are commonly coupled with chronic overnutrition. A constant mix of fuel inputs along with a sedentary lifestyle further exacerbates the imbalance between energy intake and expenditure, ultimately leading to mitochondrial dysfunction45. Our study showed that normal-diet Kdm2aSKO mice preferentially consumed glucose to maintain their body temperature during a cold challenge (Fig. 2d,j and Extended Data Fig. 2l) and also used fatty acids as an energy substrate to avoid hypoglycemia and to better cope with the cold challenge (Fig. 4h–j and Extended Data Fig. 4c, e). Intriguingly, under high-fat-diet-induced nutritional stress, the muscular deletion of Kdm2a prioritized lipids over glucose as the major energy substrate by strengthening the functional capacity of mitochondria (Figs. 3k,q,r and 4e–g and Extended Data Fig. 4b,d). Overall, Kdm2a deficiency in skeletal muscle can flexibly adjust the priority of fuel use, thereby ensuring efficient adaptation to distinct stress conditions.
Conclusion
In summary, our study underscores a pivotal role for Kdm2a-mediated demethylation of H3K36me2 in the FTM–STM transition and reshaping skeletal muscle metabolic flexibility (Fig. 7). Inhibition of KDM2A provides skeletal muscles with enhanced metabolic flexibility to switch fuel consumption and to augment thermogenesis and energy expenditure upon the challenge of metabolic stress. These insights hold significant implications for comprehending the interplay between epigenetic regulation of metabolic pathways in skeletal muscle and offer a promising avenue for the intervention and management of metabolic disorders in clinical settings.
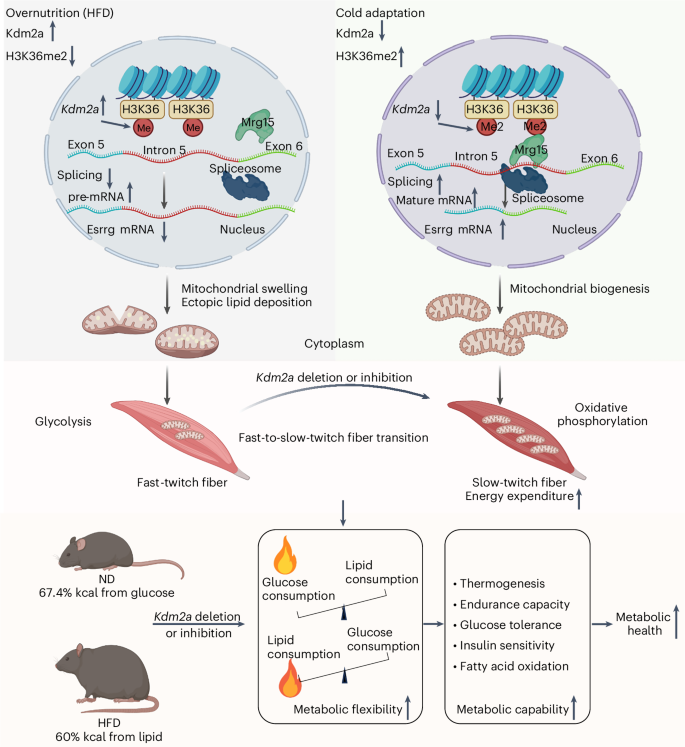
Inhibition of Kdm2a provides skeletal muscles with enhanced metabolic flexibility to shift fuel use from glucose as the main energy source under a normal diet accompanied by cold challenge to lipids as the main energy source under obese condition by increasing the proportion of STMs, which then enhances the capability of the mice to withstand metabolic stress. These insights hold significant implications for Kdm2a to serve as a viable target against metabolic stress in clinical settings (made with BioRender.com).
Methods
Mice
The Kdm2aflox/flox (Kdm2afl/fl) mice in the C57BL/6 background were generated by targeting exons 7–9 (encoding the JmjC-catalytic domain) using a Cre-LoxP system. The Flp transgenic mice and ACTA1-rtTA, tetO-cre mice were purchased from the Jackson Laboratory (strain no. 012433). C57BL/6 (WT) mice were purchased from Beijing HFK Bioscience. All mice were maintained under specific-pathogen-free conditions at the Tongji Hospital Animal Center at 20–24 °C ambient temperature, 45–65% humidity and a 12/12 h light/dark cycle. Both ACTA1-rtTA, tetO-cre-Kdm2afl/fl (referred to as knockout (Kdm2aSKO)) mice and their Kdm2afl/fl littermates (referred to as WT (Kdm2afl/fl) controls) (8 weeks old) were either maintained on a normal diet (67.4% kcal from glucose, 11.1% kcal from lipid; Xietong Pharmaceutical Bio-engineering) or switched to a HFD (25.9% kcal from glucose, 60% kcal from fat; Research Diet) for 16 consecutive weeks. Mice were allocated to the normal diet or HFD groups randomly. Kdm2a deficiency was induced by drinking 2 mg ml−1 of tetracycline (in 5% glucose) for 1 week. At the end of the experiment, the mice were killed for subsequent biochemical experiments. All experimental procedures were approved by the Tongji Hospital Animal Care and Use Committee in accordance with the National Institutes of Health guidelines (TJH-202204022).
Mouse hyperglycemic model
WT mice (8 weeks old) were randomly provided with normal drinking water or water containing 10% glucose for 2 weeks and then monitored for random blood glucose levels twice per week to make sure the mice were hyperglycemic (>16.7 mmol l−1).
Human samples
Muscle samples from patients undergoing anterior cruciate ligament repair for anterior cruciate ligament rupture were collected at the Union Hospital of Tongji Medical College between 2018 and 2019. Clinical characteristics such as sex, height, age and BMI of each subject are summarized in Supplementary Table 1. None of the patients had significant systemic disease, chronic infection or previous history of myocardial infarction. Each subject received a consent form. All studies related to humans were conducted in accordance with National Institutes of Health guidelines and approved by the Institutional Review Board (IRB) of Tongji Hospital (TJ-IRB20230926).
Histone protein extraction
Histone proteins from STMs (soleus) and FTMs (extensor digitorum longus) were extracted using the EpiQuik Total Histone Extraction Kit (OP-0006, Epigentek). The protein concentration was quantified using a BCA kit (G2026, Servicebio).
High-glucose stimulation of C2C12 myotubes
C2C12 myotubes were pretreated with DMEM supplemented with low glucose (5.6 mmol l−1) overnight. They were next washed with PBS and resuspended with fresh DMEM in the presence of low glucose or high glucose (30 mmol l−1), respectively. After another 48 h of culture, the cells were collected for protein extraction.
Intraperitoneal glucose tolerance test and insulin tolerance test assays
For the intraperitoneal glucose tolerance test, the mice were fasted for 16 h before intraperitoneal injection of 15% glucose (w/v) at a dose of 1.5 g kg−1 of body weight. The insulin tolerance test was conducted after 6 h of fasting and injected intraperitoneally with human regular insulin (Novolin R, Novo Nordisk) at 0.5 IU kg−1 of body weight. Blood glucose was measured from tail vein blood at indicated time points using a glucometer (Roche). Serum insulin and fasting blood glucose were assayed at 16 h of fasting.
Cold adaptation and body temperature monitoring
To eliminate the effects of skeletal muscle shivering thermogenesis, a cold adaptation model was established, in which the mice were successively adapted to 18°C, 14°C, 10°C and 6°C for 1 week, respectively. Subsequently, the mice were placed in a cold room at 4–5°C for 8 h each day for 2 weeks (Supplementary Fig. 1f). After fasting for 6 h, core body temperature was measured under cold challenge with one mouse per cage. Random core body temperature was monitored at room temperature without restricting food intake. Additionally, some mice were placed in the prone position after intraperitoneal injection with 1.25% Avertin (M2920, Nanjing Aibei Biotechnology). After 30 min, core body temperature was measured using a rectal probe. The mice were then placed on a heating pad until they were fully awake. For studies in myocytes, C2C12 myotubes were placed in the 4°C cold room for 30 min and then returned to the cell incubator for 5 min. The cells were repeated four times for a total of 2 h of cold stimulation before the follow-up studies.
Histological and immunofluorescence staining
Tissue cross sections from skeletal muscle were prepared and subjected to hematoxylin and eosin staining. The stained sections were analysed under a Leica ST5010 Autostainer XL microscope (Leica Biosystems) by two pathologists in a blinded fashion. For immunostaining, mouse skeletal muscles were removed at indicated time points. Tissue sections were prepared and placed in OCT, frozen in dry-ice-cooled isopentane (Tissue-Tek), fixed in 4% paraformaldehyde and blocked in 3% BSA in Tris-buffered saline. The sections were then incubated overnight at 4 °C with antibodies against major histocompatibility complex I and II and Laminin alpha 2 or KDM2A and α-SMA or CD31 and Laminin alpha 2, followed by probing with an AlexaFluor 488-conjugated anti-mouse IgG or an AlexaFluor 594-conjugated anti-rabbit IgG secondary antibody (Jackson ImmunoResearch Laboratories) for 1 h at room temperature. The slides were further stained with DAPI and then sealed with Vectashield. The immunofluorescence images were captured under a fluorescence microscope (Leica).
Western blotting
Lysates from skeletal muscle and C2C12 cells were prepared in RIPA buffer (Servicebio) and then subjected to western blot analysis. The specific information of each antibody is summarized in the Reporting Summary and the Key Source Table.
Body composition measurement
Body composition (lean and fat mass) was analysed using Bruker’s Minispec Whole Body Composition Analyzer (Minispec LF 90II) based on TD-NMR.
Metabolic studies
The mice were housed individually in metabolic cages (Columbus Instruments) and given free access to food and water. After acclimation in the respiratory chambers for 24 h, the mice were monitored in real-time for 72 h for food and water intake, oxygen consumption, carbon dioxide production, RER and energy expenditure data as previously reported23. All data were obtained and calculated by the Oxymax software.
Glucose uptake assay
Glucose uptake was measured using a Glucose Uptake Fluorometric Assay Kit (E-BC-F041, Elabscience), following the manufacturer’s instructions. C2C12 myotubes were washed with PBS and starved in serum-free DMEM overnight. The cells were subsequently washed twice with KRPH containing 2% BSA and then incubated with 2-DG (10 mmol l−1) for 30 min at 37 °C, followed by washing the cells three times with KRPH (pH 7.4). Next, reagent 1 was added into each well and incubated for 10 min at room temperature and then mixed with the same volume of reagent 2. The samples were then mixed with working solutions and incubated for 30 min at 37 °C. The fluorescent intensity was finally measured using a microplate reader (Synergy 2, Bio Tek) at excitation/emission = 530 nm/590 nm and normalized to protein concentration using a BCA kit. Relative glucose uptake was assessed according to the standard curve based on determination of the standard sample.
Biochemical and ELISA analysis
Skeletal muscle tissues or serum T-CHO and triglyceride levels and serum free fatty acids were measured with a biochemical auto-analyser (BS-200). The concentration of hepatic triglyceride was determined using a triglyceride assay kit (A110-1-1, Nanjing Jiancheng Bioengineering Institute) following the manufacturer’s instructions.
C2C12 myoblasts culture and differentiation, transfection of plasmids and siRNAs
C2C12 myoblasts were obtained from ATCC (CRL-1772). Myoblasts were maintained in culture at <80% confluence in DMEM (high glucose) and 10% FBS. For differentiation, myoblasts were cultured at high-glucose DMEM with 1% horse serum. Myotube formation was monitored visually for 7–10 days before experimental use. C2C12 myoblasts were routinely tested and authenticated as negative for mycoplasma contamination. Differentiated myotubes were transfected with RNAi oligonucleotides or negative-control siRNA using the Lipofectamine 3000 Transfection Reagent (l3000-015; Invitrogen) in Gibco Opti-MEM with 1% horse serum media. After washes following 18 h of transfection, the cells were resuspended in high-glucose DMEM supplemented with 1% horse serum and 1% penicillin– streptomycin and were ready for experimental use after 48 h of transfection. The Mouse Mrg15 cDNA (NP_001034236) was directly synthesized by inserting a Flag tag after the carboxy-terminal sequence. The cDNA product was inserted into a pcDNA3.1 vector. Mrg15-Flag plasmids were transfected into C2C12 myotubes using the Lipofectamine 3000 and P3000 Transfection Reagent in high-glucose DMEM with 1% horse serum media. After washes following 12 h of transfection, the myotubes were ready for experimental use after 48 h of transfection. The related sequences are listed in Supplementary Table 3.
Generation of Kdm2a-KO C2C12 cells
Kdm2a knockout myoblasts (Kdm2a-KO) were generated using LentiCRISPR (v.2) containing a single guide RNA (gRNA). The sequence for LentiCRISPR (v.2) Kdm2a gRNA can be found in Supplementary Table 3. Lentivirus was packaged in C2C12 myoblasts by transient transfection. Conditioned media containing lentivirus was used to transduce C2C12 myoblasts. The cells were selected with puromycin and individual clones were characterized. Kdm2a deletion was verified by western blotting (Extended Data Fig. 2k) and gene sequencing (Supplementary Table 4).
Endurance running capacity and acute exercise test
The mice were acclimated to the treadmill (ZS-PT-III, Zhongshi) for three consecutive days at low speed (5 m min−1) with no incline for 5 min. Running tests were performed with a 5° incline. Animals ran at 10 m min−1 for the first 10 min followed by increases of 2 m min−1 every 5 min until exhaustion, which was defined by the inability to remain on the treadmill for >5 s69. Animals were removed immediately after exhaustion. For an acute exercise test, the mice were acclimated to treadmill running as outlined above. Animals were fasted for 4 h before single bouts of acute exercise set for 30 min at 12 m min−1 with a 5° incline, and the electric shock incidents (the number of times the mice were electrically stimulated on a treadmill before exhaustion) were recorded.
RT–qPCR analysis
Total RNA was extracted from cells or tissues using the Trizol reagent (9109, Takara, Kusatsu-Shiga). The quantity and quality of RNA were determined using the Nano-drop 2000 (Thermo Scientific). Approximately 500 ng of RNA was used for reverse transcription using the HiScript II Q Select RT SuperMix (Vazyme). The cDNA was diluted 1:10 with nuclease-free water and used for real-time PCR on a QuantStudio 12K Flex (Life Technologies) using the SYBR qPCR Mix (Takara, Kusatsu-Shiga). The data were normalized to β-actin and analysed using the ΔΔCt method as previously described70. RNA extraction from intron detection groups and reverse transcription used the kits containing random hexamer primers (R212-01/02, Vazyme). Relative mitochondrial DNA was quantified by real-time PCR using primers for mitochondrially encoded Nd1 normalized to nuclear-encoded 36B4 (Rplp0) DNA. Relative expression levels were quantified using a standard curve and normalized to the expression of housekeeping gene 36b4. Primer sequences are listed in Supplementary Table 2.
Adenoviral transduction
We constructed an scAAVrh.74.MHCK7.hESRRG transgene cassette using the MHCK7 promoter to establish a skeletal muscle-specific Esrrg knockdown mouse model (DesignGene Biotechnology). The related sequences are listed in Supplementary Table 3. Kdm2aSKO mice were randomly divided into control and experimental groups. Viral efficacy in the muscle was achieved through intravenous injection into the tail vein of Kdm2aSKO mice at a total dose of 1 × 10¹² vector genomes (equivalent to 5 × 10¹³ vector genomes per kg for a 20 g mouse). Kdm2afl/fl and Kdm2aSKO mice injected with the scAAVrh.74.MHCK7.GFP served as controls. The experiments were performed following 1 month of transduction.
Administration of Kdm2a inhibitor
The 8-week-old WT mice were fed a HFD for 16 weeks to induce obesity and insulin resistance. These mice were kept on HFD but subjected to a sustained cold challenge for 2 weeks, and daminozide was administered by intraperitoneal injection at 50 mg kg−1 day−1 or 100 mg kg−1 day−1 or the same volume of PBS, respectively, randomly throughout the cold challenge.
Seahorse assay
Basal oxygen consumption rate was measured using a Seahorse XFe24 analyzer (Agilent Technologies) according to the manufacturer’s instructions. C2C12 myoblasts were differentiated in 24-well plates and stimulated with palmitic acid for 24 h at day 7 of differentiation. The differentiated cells were trypsinized and reseeded in the Seahorse XF24-microplates (50K cells per well) on day 8 of differentiation and assayed on day 9 of differentiation. Myotubes were switched to DMEM (no bicarbonate) with 5 mM glucose and 1 mM pyruvate 1 h before the assay. Respiration was measured three times followed by the injection of oligomycin (2 mM final), carbonyl cyanide 4-(trifluoromethoxy) phenylhydrazone (1 mM) and rotenone or antimycin A (1 mM), with three measurements after each injection. Data were normalized to protein content.
Mass spectrometry analysis of co-IP products
The collected C2C12 myotubes were washed three times with ice-cold PBS and then lysed in immunoprecipitation lysis buffer (Beyotime Biotechnology) containing 1% SDS, 1 mM phenylmethylsulfonyl fluoride and 10 mM N-ethylmaleimide (Sigma-Aldrich) in the presence of protease inhibitor cocktail (10 μg l−1 aprotinin, 10 μg l−1 leupeptin, 5 mM sodium pyrophosphate and 1 mM Na3VO4). Immunoprecipitation was performed by incubating with an anti-H3K36me2 antibody overnight at 4 °C with rotation, followed by cross-linking to protein G (HY-K0202, MCE) for an additional 2 h at 4 °C. The resulting co-IP products were subjected to liquid chromatography coupled with tandem mass spectrometry analysis (PTM BioLabs). The potential candidates were determined by detecting more than two specific peptides. After washes with immunoprecipitation lysis buffer, the beads were eluted in Laemmli buffer and resolved by SDS–PAGE.
Immunoprecipitation assay
C2C12 myotubes were transfected with Mrg15-Flag plasmids for 48 h. Cell lysates were incubated with IgG or anti-Flag antibodies overnight at 4 °C. Lysates of Gas tissues were incubated with IgG or anti-H3K36me2 antibodies overnight at 4 °C. The next day, lysates were incubated with protein A/G magnetic beads (HY-K0202, MCE, USA) for 6 h and washed three times using lysis buffer. The levels of Flag and H3K36me2 or H3K36me2 and Mrg15 were then analysed by western blotting. Cell lysates of C2C12 myotubes were incubated with IgG or anti-H3K36me2 antibodies overnight at 4 °C.
ERthermAC analysis
C2C12 myoblasts were differentiated in 24-well plates as above. At day 7 of differentiation, myotubes were treated with ERthermAC (Emdmillipore SCT057) (250 nM) for 30 min, and the cells were washed three times with PBS and then subjected to flow cytometry analysis. The gating strategy is provided in Supplementary Fig. 4g.
Electron microscopy
Muscle slices were fixed in 2% formaldehyde and 2.5% glutaraldehyde in 0.1 M sodium cacodylate buffer (pH 7.4). The sections were subjected to electron microscopy using a JEOL 1200EX transmission electron microscope equipped with an AMT 2k CCD camera. Mitochondrial analysis was performed on ×10,000 cross-section (2 nm per pixel) micrographs from Gas muscle. Five mice were analysed for each study group.
RNA-seq and ChIP–seq
RNA-seq was performed on three animals per genotype per group. Gas tissue from HFD-fed Kdm2afl/fl and Kdm2aSKO mice was isolated and mRNA was then extracted and subjected to deep RNA-seq analysis (BGI Genomics). The prepared mRNA libraries were sequenced on an Illumina HiSeq 2500, and HISAT2 (v.2.0.4) software (the Center for Computational Biology) was used to map cleaned reads to the mm10 reference genome. Fragments per kilobase of exon per million mapped fragments (FPKMs) were calculated using Cuffnorm (v.2.2.1) software (University of Washington). The calculated genes with a normalized FPKM of >1.0 were considered to be expressed. Significantly differentially expressed genes were defined as log2(fold change) ≥ 0.5 with a P value of ≤0.05. Heatmaps were generated using the R package pheatmap.
ChIP–seq was also conducted on the above-isolated Gas tissues from three HFD-fed Kdm2afl/fl and Kdm2aSKO mice, respectively. ChIP assays were carried out using a ChIP assay kit (Beyotime Biotechnology), using an antibody against H3K36me2; a rabbit IgG was used for the control. The purified DNA library was then sequenced on a NovaSeq 6000 sequencer (Illumina; model PE150) by SeqHealth. The established library was verified by agarose electrophoresis, quantified using Qubit (v.2.0) and sequenced on the Illumina HiSeq 2500 PE150. Raw sequencing data were first filtered by Trimmomatic (v.0.36), low-quality reads were discarded and the reads contaminated with adaptor sequences were trimmed. The clean reads were mapped to the reference genome of Sus scrofa from GCF_000003025.6 using STAR software (v.2.5.3a) with default parameters. The distribution, coverage, homogeneity and chain specificity of reads were next evaluated by RSeQC (v.2.6). Peaks in the ChIP–seq datasets were called with MACS2 (v.2.1.1) and the associated genes were identified using Homer (v.4.10). The distribution of call peak on the chromosomes and functional elements was performed by deep Tools (v.2.4.1) and ChIP seeker (v.1.5.1). Peak maps of reads across the genome were described using IGV (v.2.4.16). The motif analysis was performed using Homer (v.4.10). Gene Ontology analysis and KEGG enrichment analysis for the peak-related genes were both implemented by KOBAS software (v.2.1.1) with a corrected P value cutoff of 0.05.
Statistical analysis
All animals used in this study were randomly grouped. No statistical methods were used to predetermine sample sizes, but our sample sizes were similar to those reported in previous publications21,23,71,72. All data are expressed as mean ± s.e.m., and all in vitro studies were performed at least three independent times with replications unless otherwise stated. Data distribution was assumed to be normal, but this was not formally tested. Statistical analyses of the data were conducted with GraphPad Prism (v.5) software using unpaired two-tailed Student’s t-tests, one-way ANOVA where appropriate, two-way ANOVA followed by Bonferroni’s multiple comparisons test or two-sided Spearman’s correlation. For all statistical comparisons, P values of <0.05 were considered statistically significant.
Reporting summary
Further information on research design is available in the Nature Portfolio Reporting Summary linked to this article.
Responses