Key regions aberrantly connected within cerebello-thalamo-cortical circuit and their genetic mechanism in schizophrenia: an fMRI meta-analysis and transcriptome study

Introduction
Schizophrenia (SCZ) is a chronic and severe psychiatric disorder with clinical symptoms consisting mainly of hallucinations, delusions, and cognitive dysfunction, and is one of the leading causes of disability worldwide, affecting 26 million people1. Integration of multi-omics technology, such as connectomic and transcriptomic, has recently formed an approach to understand complex biological process of SCZ2,3. Recent studies have found that the cerebello-thalamo-cortical circuit (CTCC), a classical network, is closely related to the neural mechanism of SCZ4,5 and may be a heritable trait for SCZ6,7. In 1988, Andreasen et al.8 have indicated that a dysfunction in CTCC produces cognitive dysmetria, which may be an integrative theory of SCZ. However, important areas involved in aberrant hyperconnectivity or hypoconnectivity in this circuit and related genetic mechanism are unclear.
Although some studies indicate aberrant connectivity of CTCC in SCZ, we observe that these individual studies vary greatly in their methods and findings, and that hyperconnectivity or hypoconnectivity of CTCC in SCZ and its association with clinical symptoms are inconsistent. Our previous study utilized the method of region of interest (ROI)-wised connectivity found aberrant functional and effective connectivity of CTCC in SCZ patients, including hyperconnectivity between thalamic nucleus and frontal lobe and hypoconnectivity between thalamic nucleus and cerebellum, and the former connectivity was associated with the severity of positive symptoms4. Prefronto-thalamic hypoconnectivity and sensorimotor-thalamic hyperconnectivity were present both at rest and task state in SCZ9. Cao et al.10 performed the method of principal component analysis and found that hyperconnectivity of CTCC could also be a state-independent functional neural signature for psychosis, especially in SCZ. Moreover, hyperconnectivity of CTCC in baseline could predict long-term symptom reduction in negative symptoms but not positive or general symptoms in first episode SCZ11. In other research, hyperconnectivity of CTCC was related to positive and negative symptoms12. Although hypoconnectivity in large-scale brain networks, including default network, affective network, ventral attention network, thalamus network and somatosensory network, in SCZ have been reviewed13, neuroimaging meta-analysis examining aberrant functional connectivity of CTCC in SCZ has never been investigated.
Hyperconnectivity of CTCC could be a heritable trait for SCZ6. However, which genes, as well as their functional features, are over-expressed in regions aberrantly connected within CTCC in SCZ is unknown. Recently, the establishment of regional gene expression in the human brain, such as the Allen Human Brain Atlas (AHBA)14, have provided powerful tools for linking neuroimaging and transcriptomics15. Several studies have pointed to the importance of association between brain structure and function and genetic information in normal human16 and mental disorders17,18,19. Identifying the genetic annotations for brain imaging features can also help to gain new insights into the neural mechanisms underlying abnormal structural and functional features in SCZ patients at the molecular level20,21. Multiple genes have been found to be closely associated with SCZ, and variations in these genes are related to functional connectivity strength in the frontotemporal lobe22. The hyperconnectivity pattern of CTCC in SCZ is more similar in monozygotic twins than in dizygotic twins, suggesting that increased connectivity in CTCC may be a genetic trait associated with the genetic risk of SCZ6. However, there is still a paucity of gene annotation for aberrant connectivity of CTCC in SCZ patients.
Here, we performed a functional magnetic resonance imaging (fMRI) meta-analysis of seed-based connectivity studies to seek important and consistent regions involved in aberrant hyperconnectivity or hypoconnectivity in CTCC and its association with clinical symptoms in SCZ. Then we performed functional annotation for these regions to seek its association with cognitive process. Gene annotation analysis was conducted between transcriptome data and neuroimaging features to identify genes over-expressed in these regions using the AHBA data. Finally, gene functional feature analyses were conducted by a set of post-hoc analysis, such as functional enrichment, specific expression, and protein-protein interaction (PPI).
Methods
Literature search and selection
This meta-analysis was conducted according to the Preferred Reporting Items for Systematic Reviews and Meta-Analyses (PRISMA) guidelines23. The completed PRISMA checklist and flow diagram were included in supplementary file 1 and Fig. 1, respectively. A systematic search was performed independently by two investigators (Y.W. and Z.W.) to examine relevant studies published in PubMed and Web of Science before Aug 22, 2023. This meta-analysis protocol was pre-registered in PROSPERO (https://www.crd.york.ac.uk/PROSPERO/, registration number: CRD42023463587). The following search terms were used: (“schizophrenia”) AND (“cerebello” or “cerebellar” or “cerebellum”) AND (“thalamo” or “thalamic” or “thalamus”) AND (“cortical” or “cortico” or “cortex”) AND (“connectivity” or “connection”). Additionally, related studies were further identified based on references listed in the included studies and on related reviews. The inclusion criteria were used to select relevant studies as follows: (1) studies were published as an original paper from a peer-reviewed journal; (2) studies compared differences of functional and/or effective connectivity between SCZ patients and healthy controls (HCs); (3) comparisons were conducted at a whole-brain ROI-based connectivity analysis; (4) statistical results were exhibited in a stereotactic space (MNI or Talairach space); and (5) imaging data were not used in other included studies. The following exclusion criteria were used: (1) articles were literature reviews or meta-analyses; (2) articles were not in English; (3) no comparisons were performed between SCZ patients and HCs; (4) no peak coordinates were showed for relevant contrasts; (5) other functional connection methods (e.g., independent component analysis or functional connectivity degree/strength)24; (6) one or more brain regions in the results were missing in the cortex, thalamus, and cerebellum. For each included study, we recorded the following information: sample size, age, sex, diagnostic criteria, symptom severity, and illness duration (Table 1). For each included study, we also recorded the resting state or/and task state fMRI, functional or/and effective connectivity, seeds, specific effect circuits mentioned in their texts, and symptoms related with aberrant connectivity of CTCC (Supplementary Table 1).

The study selection process of the meta-analysis. fMRI, functional magnetic resonance imaging; HC, healthy control.
Data organizing
An anisotropic effect-size version of seed-based d mapping (AES-SDM) toolbox version 5.15 (https://www.sdmproject.com/software/) was conducted in this current meta-analysis. SDM is a powerful statistical software that utilizes peak coordinates to conduct meta-analyses of significant differences for abnormal brain activity or connection and is widely utilized in recent neuroimaging meta-analyses25,26,27. The current meta-analysis following the AES-SDM tutorial was finished in three steps. First, we recorded the peak coordinates and corresponding effect size of the results from each study. The coordinates reported in the Talairach space were converted to the Montreal Neurological Institute (MNI) space28, and the Z scores from the effect size of the results were converted to T statistics using the SDM online converter (https://www.sdmproject.com/utilities/?show=Statistics). In case of studies not reporting the specified effect size, we used a “p” for hyperconnectivity and an “n” for hypoconnectivity to remark the effect size of corresponding peak coordinates. The content of the peak coordinates and effect size in each study were written and saved into a separate text file. If one study explored patients with SCZ and other metal diseases, we only recorded the results of SCZ patients. Second, we preprocessed the databases and recreated the effect-size brain maps of differences between groups for each original study using an anisotropic unnormalized Gaussian kernel29. Lastly, mean analysis was conducted to obtain the weighted mean connection differences (z map) in CTCC between SCZ and HCs and to obtain intra-study variability and between-study heterogeneity for all included studies. We reported the results (significant regions/clusters within CTCC) using a voxel-wise threshold of p < 0.001 and a cluster size threshold of 10 voxels to balance the Type I and Type II error30. The robustness and reliability of present meta-analysis methods are described in the supplementary materials. Given the major seeds in these studies of this meta-analysis were thalamus and other seeds were different and distributed in cerebral cortical or cerebellum, we also carried sensitive meta-analysis with 13 studies, in which the thalamus as region of seeds to elucidate the seed-specific findings. Finally, we performed seven meta-regression analyses to investigate the effect of age, sex, duration of illness, and symptoms (positive and negative symptom scores (PANSS) positive scores, negative scores, general psychopathology, and the total scores), respectively. We chose these variables because they have been correlated with variation of functional connectivity31,32,33.
Functional annotation analysis
To explore cognitive processes related to significant regions/clusters aberrantly connected within CTCC in SCZ patients, we performed the functional annotation analysis on regions aberrantly connected within CTCC in SCZ using the brain annotation toolbox (BAT, https://istbi.fudan.edu.cn/lnen/info/1173/1788.htm)34. Functional annotation analysis combined functional terms (cognitive processes) with significant regions/clusters aberrantly connected within CTCC using the probabilistic (activation) maps from Neurosynth (http://neurosynth.org/)35. 217 terms that had clear biological significance with specific regions/clusters were involved34,36. The significant functional terms functional enriched in the given regions/clusters was identified by using a permutation test (5000 times). The significant terms were determined if the corresponding p values were <0.0002, following prior recommendation18. A relatively liberal threshold (p < 0.05) was also used as the preliminary results to explore more functional terms that possibly correlated with regions aberrantly connected within CTCC in SCZ patients. Details about the permutation test are included in the Supplementary materials.
Genetic annotation analysis
Based on gene expression pattern (transcription levels) from the AHBA dataset, we used the BAT to provide the whole genomic gene expression profiles for significant regions/clusters aberrantly connected within CTCC in SCZ patients (details of the gene expression dataset and its preprocessing procedures are provided in the Supplementary materials and Supplementary Table 2). We created a 3 mm sphere ROI for each AHBA tissue sample in the MNI volume space centered on its MNI centroid coordinate. The AHBA samples with more than 50% of voxels in the whole brain (background mask) were retained to perform further analysis. We mapped each background AHBA sample to one of significant regions/clusters, which had the largest number of overlapping voxels with this AHBA sample. The gene expression profile of each region is defined as the average gene expression of all the samples mapped to significant regions/clusters. We also used the permutation test (5000 times, p < 0.0002, following prior recommendation18) to determine significantly expression of genes in the given clusters/regions compared with other regions in the background. Details about the permutation test are also included in the Supplementary materials.
Gene enrichment analysis
We performed a series of gene enrichment analysis for identified genes that over-expressed in regions aberrantly connected within CTCC in SCZ. First, we used ToppGene portal (https://toppgene.cchmc.org/)37 to carry out the functional annotation of these genes. Gene ontology (GO), including molecular functions (MFs), biological processes (BPs), and cellular components (CCs), was used to determine the biological process of these genes. We also adopted the disease database to determine the related diseases of these genes. Second, online tissue, cell type, and temporal specific expression analysis tools (http://doughertytools.wustl.edu/)38 were conducted body tissue, brain cell type, and development specific expression analyses to determine specific tissue, cell type, and developmental stages overrepresented by these genes. We used the specificity index probability (pSI) statistic at four thresholds (0.05, 0.01, 0.001, 0.0001) to identify how likely a gene was to be specifically expressed39. At last, we examined the overlap between the genes co-expressed in regions aberrantly connected within CTCC in SCZ patients in the current study and SCZ-associated genes in the MalaCards database (https://www.malacards.org/)40, using 20738 genes with unique Entrez IDs in the AHBA as the background list. For these enrichment analyses, Fisher’s exact tests were conducted to test the significance. Multiple correction was performed using the Benjamini and Hochberg method for false discovery rate (FDR-BH correction) with a corrected p-value (q) of 0.05.
Protein-protein interaction analysis
Protein-protein interaction (PPI) analysis was performed using STRING database (https://string-db.org/) and Cytoscape v3.9 (https://cytoscape.org/) to determine whether the genes co-expressed in regions aberrantly connected within CTCC in SCZ patients could construct a PPI network with the highest confidence interaction score of 0.9. Genes with the top 10% highest degree values (the number of edges connected to a gene) were identified as hub genes. Moreover, the Human Brain Transcriptome database (http://hbatlas.org/) was employed to delineate the spatial-temporal expression trajectory of hub genes with the highest degree values.
Results
Meta-analysis of regions aberrantly connected within CTCC for SCZ patients
After the comprehensive literature search and selection, 1333 SCZ patients and 1174 HCs from 19 studies were included in our neuroimaging meta-analysis. Table 1 shows the demographic of these subjects. Compared with HC, the regions that SCZ patients showed hyperconnectivity within CTCC included the right superior temporal gyrus (extending to the middle temporal gyrus, the Rolandic operculum, the postcentral gyrus, and precentral gyrus), the left middle occipital gyrus (extending to the middle temporal gyrus, the superior temporal gyrus, the Rolandic operculum, the insula, the inferior occipital gyrus, and the inferior temporal gyrus), the right superior occipital gyrus (extending to the middle occipital gyrus), bilateral lingual gyri, the left postcentral gyrus, the right middle occipital gyrus (extending to the middle temporal gyrus, the inferior occipital gyrus, and the inferior temporal gyrus), the left cuneus cortex, and the left paracentral lobule (Fig. 2, Supplementary Table 3). Moreover, compared with HC, the regions that SCZ patients showed hypoconnectivity within CTCC included the medial part of bilateral superior frontal gyri (extending to the anterior cingulate gyri, the medial cingulate gyri, and the supplementary motor areas), the right cerebellum VI (extending to the cerebellum crus II, the cerebellum X, and the cerebellum VIII), the left cerebellum X (extending to the cerebellum crus II, the cerebellum VIII, the cerebellum VIIB, and the cerebellum crus I), bilateral anterior thalami, the right caudate nucleus, and the left cerebellum crus II (Fig. 2, Supplementary Table 3). In these 19 studies, 18 studies showed some effect networks, such as cerebello-thalamo-motor network and prefronto-thalamo-cerebellar network, which could be classified as belonging to the CTCC. Moreover, positive symptoms were the clinical symptoms that were the most (5 studies) significantly associated with regions involved in abnormal connectivity of CTCC in SCZ, followed by negative symptoms (4 studies) (Supplementary Table 1).
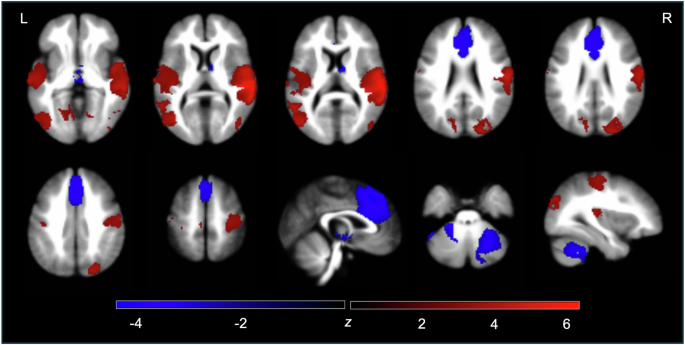
CTCC cerebello-thalamo-cortical circuit, HCs healthy controls, L left, R right, SCZ schizophrenia.
Jackknife sensitivity analysis showed that meta-analysis results of regions involved in abnormal connectivity of CTCC in SCZ remained largely consistent. After 19 repeated meta-analyses and discarding one study each time, as shown in Supplementary Table 4, the right superior temporal gyrus, left middle occipital gyrus, right superior occipital gyrus, left lingual gyrus, right middle occipital gyrus, left cuneus cortex, the medial part of bilateral superior frontal gyri, right cerebellum VI, left cerebellum X, right caudate nucleus, and left cerebellum crus II were replicated in all 19 meta-analyses. The right lingual gyrus and bilateral anterior thalami were stably preserved in 18/19 of the datasets. The left postcentral gyrus (cluster 5 in hyperconnectivity) was stably preserved in 17/19 of the datasets. The left paracentral lobule and left postcentral gyrus (cluster 10 in hyperconnectivity) remained significant in 14 and 13 meta-analyses, respectively. Moreover, heterogeneity analysis (I2 < 50%, Supplementary Table 5) demonstrated the robustness and reliability of our meta-analysis results.
Sensitive meta-analysis with the thalamus as region of seeds revealed hyperconnectivity between the thalamus and the right superior temporal gyrus (extending to the middle temporal gyrus, the postcentral gyrus, the Rolandic operculum, and the precentral gyrus), the superior temporal gyrus (extending to the middle temporal gyrus, the supramarginal gyrus, the postcentral gyrus, the Rolandic operculum, the middle occipital gyrus, and the inferior occipital gyrus), the right middle occipital gyrus (extending to the superior occipital gyrus and the inferior occipital gyrus), bilateral lingual gyri, the left superior occipital gyrus, and the left paracentral lobule; and hypoconnectivity between the thalamus and the left cerebellum X (extending to the cerebellum VIII, the cerebellum VIIB, the cerebellum crus II, and the cerebellum crus I), the right cerebellum crus II (extending to the cerebellum crus I and the cerebellum X), the medial part of bilateral superior frontal gyri (extending to the median cingulate gyri and anterior cingulate gyri), and bilateral anterior thalami (extending to the caudate nuclei) in SCZ compared to HCs (Supplementary Table 6).
Meta-regression results
The meta-regressions of age identified significant positive associations with hyperconnectivity within CTCC and significant negative associations with hypoconnectivity within CTCC, which showed the differences between groups in hyperconnectivity and hypoconnectivity amplified with advancing age (Supplementary Table 7). The meta-regressions of sex identified significant positive associations with hyperconnectivity within cerebral cortex and significant negative associations with hypoconnectivity within cerebral cortex and cerebellum, which showed the differences between groups in hyperconnectivity or hypoconnectivity amplified with more female or male, respectively (Supplementary Table 8). The meta-regressions of illness duration identified significant positive associations with hyperconnectivity within CTCC and significant negative associations with hypoconnectivity within CTCC, which showed the differences between groups in aberrant hyperconnectivity and hypoconnectivity amplified with advancing illness duration (Supplementary Table 9). The meta-regressions of PANSS positive and negative scores identified one cluster with significant positive associations. In the right inferior frontal gyrus, the differences between groups in hyperconnectivity amplified with advancing PANSS positive and negative scores (Supplementary Table 10). No clusters displayed significant negative associations with PANSS positive and negative scores. The meta-regressions of PANSS general psychopathology and total scores identified one cluster with significant positive associations and one cluster with significant negative associations. In the right Rolandic operculum, the differences between groups in hyperconnectivity amplified with advancing PANSS general psychopathology and total scores; in the right supplementary motor areas, the differences between groups in hypoconnectivity amplified with advancing PANSS general psychopathology and total scores (Supplementary Table 10).
Functional annotation results
Functional annotation identified a series of functional terms for meta-analysis results of regions aberrantly connected within CTCC for SCZ patients from 217 terms with clear biological significance. These terms included self, personality, action, decision making, social, somatosensory, primary somatosensory, second somatosensory, hand movements, pain, and rhythm (p < 0.0002, Fig. 3, Supplementary Table 11). Interestingly, using p value threshold of 0.05, these terms also included SCZ and hallucinations, acoustic, anxiety, illusion, attention control, autism, cognitive control, cognitive emotional, Stroop task, episode, pressure, salience, executive control, and so on (Supplementary Table 11), which were showed in the word cloud (Fig. 3).
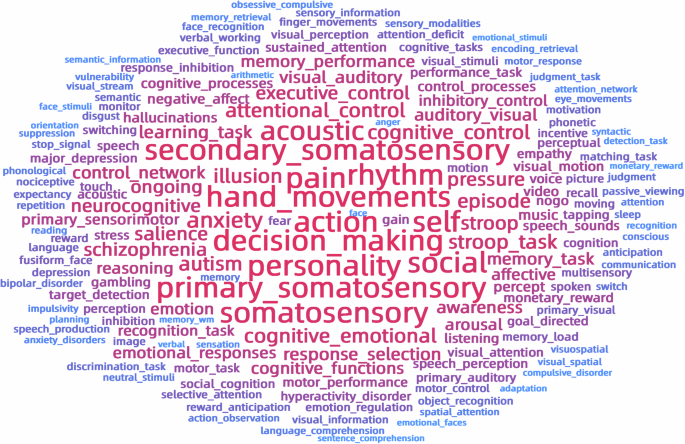
The size of word refers to −log10(p). The redder the color of the text, the more relevant it is to regions aberrantly connected within CTCC in SCZ, and the bluer the color of the text, the less relevant it is to regions aberrantly connected within CTCC in SCZ. CTCC cerebello-thalamo-cortical circuit, SCZ schizophrenia.
Genes annotation and functional enrichment results
2922 genes were identified to be significantly co-expressed in the regions aberrantly connected within CTCC for SCZ patients (Supplementary Table 12). With regard to GO, these genes were significantly enriched for MFs including cytoskeletal protein binding, monoatomic ion-gated channel activity, gated channel activity, voltage-gated monoatomic cation channel activity, salt transmembrane transporter activity, and transmembrane transporter binding; for BPs including synaptic signaling, anterograde trans-synaptic signaling, chemical synaptic transmission, trans-synaptic signaling, modulation of chemical synaptic transmission, and regulation of trans-synaptic signaling; for CCs including synapse, glutamatergic synapse, neuron projection, postsynapse, synaptic membrane, and somatodendritic compartment (Fig. 4, Supplementary Table 13). Regarding to diseases, these genes were found to be enriched for SCZ and bipolar disorder (Fig. 4, Supplementary Table 13).
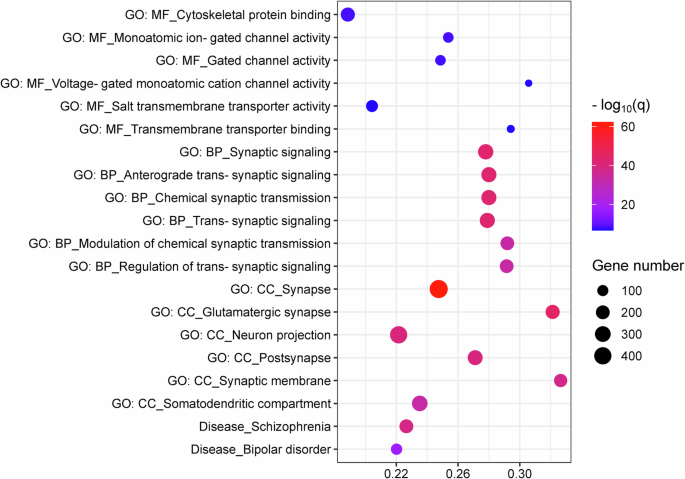
In the bubble chart, the x-axis represents the rich factor, and the y-axis represents items from the GO and disease databases. The rich factor refers to the ratio of the number of the significant genes annotated to the item to the number of all genes annotated to the item. The bubble color refers to the −log10(q), and the bubble size refers to the number of genes overlapping with those belonging to each item. BP, biological process; CC, cellular component; CTCC, cerebello-thalamo-cortical circuit; GO, gene ontology; MF, molecular function; SCZ, schizophrenia.
Tissue, cell type, and temporal specific expression
Specific expression results of the 2922 genes over-expressed in regions aberrantly connected within CTCC in SCZ patients are listed in Supplementary Tables 14–16 and are illustrated in Fig. 5. Tissue specific expression analysis showed that these genes were specifically expressed in the brain tissue (Fig. 5A, Supplementary Table 14). Cell specific expression analysis showed that these genes were specifically expressed in the cortex (Ctx), corticothalamic neurons of cortex (Ntsr+), corticopontine neurons of cortex (Glt25d2), corticosterone-expressing neurons of cortex (Cort+), D2 dopamine receptor-expressing medium spiny neurons of striatum (Drd2+), immune cells (Immu), D1 dopamine receptor-expressing medium spiny neurons of striatum (Drd1+), prepronociceptin-expressing neurons of cortex (Pnoc+), striatum (Stri, including caudate and putamen), basal forebrain (BF), and granule cells of cerebellum (Gran) (Fig. 5B, Supplementary Table 15). Temporal specific expression analysis showed that these genes were preferentially expressed during early middle fetal, late middle fetal, late fetal, neonatal and early infancy, late infancy, early childhood, middle and late childhood, adolescence, and young adulthood (Fig. 5C, Supplementary Table 16).
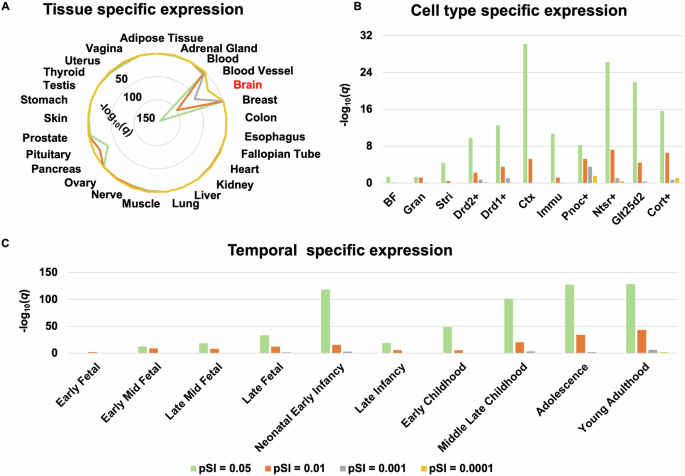
A Tissue specific expression. B Cell type specific expression. C Temporal specific expression. BF basal forebrain, Cort+ corticosterone-expressing neurons of cortex, Ctx cortex, Drd1+ D1 dopamine receptor-expressing medium spiny neurons of striatum, Drd2+ D2 dopamine receptor-expressing medium spiny neurons of striatum, Glt25d2 corticopontine neurons of cortex, Gran granule cells of cerebellum, Immu immune cells, Ntsr+ corticothalamic neurons of cortex, Pnoc+ prepronociceptin-expressing neurons of cortex, Stri striatum.
Overlap with SCZ-associated genes
The 2922 genes co-expressed in regions aberrantly connected within CTCC for SCZ patients in the present study significantly overlapped with the 551 SCZ-associated genes in the Malacards database (208 overlap genes, odds radio = 481.4, p = 2.03 × 10 −14).
PPI network and hub genes
PPI analysis showed that 856 from the 2922 genes could form an interconnected PPI network (Supplementary Fig. 1A). This network consisted of 4252 edges, which was significantly higher than expected (p = 1.0 × 10⁻¹⁶). 85 genes with the top 10% highest degree values were defined as hub genes (Supplementary Table 17). Moreover, we delineated the spatial-temporal expression trajectory of five hub genes (i.e. CALM3, GNAI1, PRKACA, PRKACG, and PRKACB) with the highest degree values (Supplementary Fig. 1B).
Discussion
In this study, we investigated key regions aberrantly connected within CTCC and its genetic mechanism for SCZ patients using neuroimaging and brain gene expression data. The fMRI meta-analysis demonstrated that SCZ patients had hyperconnectivity in the temporal, occipital, postcentral, and lingual gyri, cuneus cortex and paracentral lobule, and hypoconnectivity in the frontal gyrus, cerebellum, thalamus, and caudate nucleus within CTCC, which were enriched in domains involving self, action, social, and sensory. This implicates that insights emerging from mapping intrinsic brain connectivity networks provide a potentially mechanistic framework for an understanding of aspects of human behavior41,42,43. Meta-regressions showed that these effects were affected by age, sex, duration of illness, and the severity of symptoms. Furthermore, these regions were spatially correlated with co-expression of 2922 genes, which were enriched for important MFs, BPs, and CCs of the neurons/cells in the brain as well as SCZ and other mental diseases. In addition, these genes were specially expressed in the brain tissue, in the neurons of the cerebellum, subcortex and cortex, and during nearly all developmental stages. Concurrently, these genes constructed a PPI network supported by 85 hub genes with functional significance. Altogether, these findings suggest key regions involved in hyperconnectivity and hypoconnectivity of CTCC in SCZ and its molecular mechanism.
The fMRI meta-analysis results can be summarized as aberrant connectivity in CTCC and can also be extended as hyperconnectivity in the auditory network (the superior and middle temporal gyri44,45), visual system (the occipital and lingual gyri, and cuneus cortex46) sensorimotor areas (the postcentral gyrus and paracentral lobule5), and hypoconnectivity in the cerebellum and limbic system (the cingulate gyrus, thalamus, and caudate nucleus47). It’s well established that SCZ is a complex neuropsychiatric disorder with clinical symptoms consisting mainly of hallucinations, delusions, abnormal behavior, and cognitive dysfunction48. Hyperconnectivity in the auditory network and visual system might be related with positive symptoms, especially auditory4 and visual46 hallucinations and delusions45. Moreover, this meta-analysis study showed that positive symptoms were the clinical symptoms that were the most significantly associated with abnormal connectivity within CTCC for SCZ patients. Hyperconnectivity in the sensorimotor areas might be related with abnormal behavior49. The previous studies also found hyperconnectivity of auditory network, visual system, and sensorimotor areas in SCZ9,49,50. Moreover, the cognitive dysmetria hypothesis proposed by Andreasen et al.8,51 suggest that the cerebellum plays an important role in CTCC and that a disruption in this circuit may lead to a cognitive dysmetria, and that the impairment in this basic cognitive process defines the phenotype of SCZ and produces its diversity of symptoms. Functional annotation results also indicated the association between cognitive dysmetria and regions aberrant connected within CTCC. The previous studies also found abnormal connectivity within prefrontal-thalamic (limbic)-cerebellar (sensorimotor) circuit in SCZ and indicated that SCZ may reinforce the driving connectivity from the medial prefrontal cortex or anterior cingulate cortex to the sensorimotor regions52. In the 19 study of this fMRI meta-analysis, a large proportion of the seed sites studied are the thalamus. It seems to be that the use of the thalamus as seeds facilitates the discovery of aberrant connectivity within CTCC in subjects with SCZ. Moreover, the sensitive meta-analysis showed similar findings compared with the original meta-analysis, which further illustrate the key and important role of the thalamus within CTCC. Our meta-analysis findings showed key regions involved in aberrant connectivity within CTCC for SCZ, which might help to further understand the pathophysiological mechanism and provide therapeutic targets of SCZ.
Meta-regression showed that hyperconnectivity and/or hypoconnectivity within CTCC in SCZ were affected by age, sex, duration of illness, and the severity of symptoms. A previous study observed significant association between aberrant hypothalamic connectivity and age53. Meta-regression of sex in the present study showed that the male and the female have similar association with hyperconnectivity and different association with hypoconnectivity within CTCC in SCZ. A previous study also found dysconnectivity within CTCC and sex-specific differences of default mode/salience networks in SCZ54. It’s inconsistent that whether aberrant connectivity in SCZ associated with duration of illness and symptoms53,55,56, which might be caused by the differences of data sources, the selection of seeds, and analyzed methods, and so on. A previous study conducted a meta-analysis that compared reward anticipation signals between SCZ and HCs, observed a reduced difference in activation in SCZ within a frontal-striatal network, and revealed associations between this functional signature and the severity of psychotic symptoms through meta-regression56. The findings of meta-regression in this present study imply that the further research should pay attention the effect of advancing age, sex-specific and clinical features on the dynamic changes of neural activity in SCZ.
We identified 2922 genes co-expressed in regions aberrantly connected within CTCC for SCZ by uniting brain imaging data and brain-wide transcriptome atlases. Functional enrichment analyses indicated that these genes were mainly enriched for ion channel, neurotransmitter system, synapse, neuron, and functional terms (behavior, cognition, and learning). Ion channels in the nervous system are transmembrane proteins/receptors that create pathways for charged ions to pass through cell membranes, produce membrane potentials, and play critically in the secretion of neurotransmitter57,58. Ion channels modulate synaptic plasticity and neuronal circuit, and altered function or mutation in ion channels could cause cognitive impairments in various psychiatric disorders, such as SCZ, bipolar disorder, depression, and autism spectrum disorder59,60,61. Ion channels, such as glutamate receptors and GABA receptors, could guide the development of drugs for treatment of SCZ62,63. Synaptic plasticity provides the basis for most models of learning, memory, and development in neural circuits; however, and slight perturbations of synapse function can lead to brain disorders64,65. Synaptic loss in SCZ were found in the frontal and cingulate cortices, and hippocampus66, and synaptic transmission-related genes were significantly enriched in SCZ67. Neurons have diverse morphologies, ion channels, neurotransmitters, synapses, and functional properties68. Moreover, the genes, receptors, and neurotransmitters related to SCZ might regulate neuronal development and activity, which may contribute to increased risk of SCZ and impaired cognitive function69,70,71. Cognitive deficits are known to be a core feature of SCZ, which may influence the behavior and learning processes of patients72. Therefore, cognitive therapy leads to behavior modification and symptom relief in SCZ73,74. With respect to diseases, the genes related to regions aberrantly connected within CTCC in SCZ were found to be enriched for several mental disorders including SCZ, bipolar disorder, autistic disorder, and depressive disorder, which indicated some common genetic and circuit mechanisms contributing to these illnesses. The genes that over-expressed in these regions within CTCC being significantly overlapped with SCZ-associated genes ensured that these identified genes were associated with SCZ.
Specific expression analyses proposed that the genes co-expressed in regions aberrantly connected within CTCC in SCZ were specially expressed in the brain tissue, in neurons/cells from the cerebellum, subcortex, cortex, in immune cells, and during nearly all developmental stages, respectively. Classifying neurons into types help understanding the structure, function and development of brain circuits68. The excitatory Gran are especially important in cerebellar function, and decreased excitatory input from these cells due to synaptic pathology have major implications that explain cerebellar and CTCC dysfunction in SCZ and related abnormalities in symptoms and cognition75,76. Both clinical studies and basic research in animal models have shown that subcortical dopaminergic dysfunction is a key feature in SCZ77,78,79. It’s apparent that the most expressed cell-type was the neuron in cortex, including Cort+, Glt25d2, Ntsr+, and Pnoc+. Corticosterone expressed by Cort+ might be associated with adaptation to stress, and its antagonist attenuates SCZ-like behavior80. Macaque study showed that corticopontine neurons almost distributed in the cingulate cortex, superior temporal gyrus, primary motor cortex, premotor cortex and visual cortex81. The previous studies also indicated aberrant connectivity of cortico-ponto-cerebello-thalamo-cortical circuit in SCZ82,83. Moreover, the Glt25d2 gene is a kind of collagen galactosyltransferase and could mediate the inflammatory immune regulatory mechanism84. Inflammatory response in patient-derived microglia exacerbates neuronal deficits, such as synaptic loss in SCZ85. Pnoc+ defines a subpopulation of GABAergic neurons within stria terminalis and amygdala, whose chemogenetic inhibition reduces high-fat-diet-driven increases in bodyweight and adiposity86. SCZ is frequently associated with obesity, and people with both obesity and SCZ showed more pronounced brain alterations than people with only one of these conditions87. The temporal specific expression indicates that these genes exert an enduring effect on SCZ-related regions aberrantly connected within CTCC throughout nearly all developmental stages. The previous study also supports that multiple hits throughout life contribute to disease manifestation rather than a single early-life event and emphasize the importance of investigating time-dependent perturbations in gene expression before the age of onset in elucidating the molecular mechanisms of psychiatric disorders88.
PPI analysis showed that these genes could construct a PPI network supported by 85 putative hub genes with functional significance for understanding the molecular mechanism of regions aberrantly connected within CTCC in SCZ. For example, protein kinase related genes (i.e. PRKACA, PRKACG, and PRKACB) encodes cyclic adenosine monophosphate (cAMP)-dependent protein kinase A (PKA), a pleiotropic holoenzyme that regulates numerous fundamental biological processes such as metabolism, development, memory, and immune response89. Moreover, the cAMP/PKA pathway is known to play a central role in the endocrine system90. Phosphodiesterases are enzymes involved in the homeostasis of cAMP, whose related gene variants have been identified in probands with SCZ91 and whose related mRNA levels in the frontal lobe are reduced in SCZ patients92.
Several limitations to our study need to be considered when interpreting our results. First, most of the SCZ patients in the neuroimaging meta-analysis were chronic and antipsychotic-medicated, which may confuse the result due to illness duration and antipsychotic medications. In future studies, drug-naïve first episode SCZ patients should be recruited to eliminate these confusions and confirm these preliminary findings. Second, although this neuroimaging meta-analysis showed key regions aberrantly connected within CTCC in SCZ, it’s still unclear which brain regions within CTCC have abnormal connectivity. Future studies could use the regions in the present study and find abnormal connectivity and information flow within CTCC in SCZ in detail. Third, we used the gene expression data from post-mortem brains, but we obtained the neuroimaging data from living brains. Researchers found conservative gene expression of human brain across individuals93,94. Michael et al.93 also found the association between conservative gene expression and functional connectivity (functionally relevant circuit). Moreover, similar methods have been used in many previous studies18,20,21, and our findings found complex interactions from a wide range of genes with diverse functional features associated with SCZ. Future studies should collect the peripheral blood of SCZ patients, analyze the gene expression pattern of individuals, and compute the association between multi-omics patterns.
In conclusion, these findings show key regions involved in hyperconnectivity and hypoconnectivity of CTCC in SCZ, which may indicate the neural substrate of “cognitive dysmetria” for patients and be a consequence of complex interactions from a wide range of genes with diverse functional features.


Responses