KorB switching from DNA-sliding clamp to repressor mediates long-range gene silencing in a multi-drug resistance plasmid

Main
Spatiotemporal gene expression in eukaryotes is commonly coordinated by transcriptional enhancers/silencers that loop over long genomic distances to regulate target-gene promoters1. By contrast, gene regulation over kilobase distances is rare in bacteria, and it remains to be determined whether other mechanisms, beyond DNA looping and DNA supercoiling2,3,4, are involved.
Long-range gene regulation by the DNA-binding protein KorB is important for stable vertical inheritance and horizontal transmission of the broad-host-range multidrug resistance plasmid RK2, as well as for the fitness of its host bacterium5,6,7,8,9,10. KorB is a member of the same family of proteins as ParB. ParB is a self-loading cytidine triphosphate (CTP)-dependent DNA clamp that loads and accumulates in the vicinity of a bacterial centromere-like parS sequence on bacterial chromosomes or plasmids11,12,13,14,15. ParB is crucial for plasmid and bacterial chromosome segregation15,16,17,18. However, in contrast to ParB, KorB also functions as a long-range silencer, repressing the expression of plasmid genes that promote replication and conjugative transfer19. The best understood KorB-mediated transcriptional repression requires a 16 bp silencer sequence called OB (operator of KorB) and the small DNA-binding protein KorA that binds site specifically to a 12 bp OA sequence (operator of KorA). OB is positioned either 4–10 bp (OB proximal) or 45 bp to >1,000 bp (OB distal) upstream of target promoters19,20,21,22,23. KorB-mediated long-range gene silencing has been investigated for three decades19,20,24,25,26 yet is not fully understood. Conflicting models propose that KorB either polymerizes on DNA to reach the target promoter from a distal OB site or promotes DNA looping over long distances to connect OB and the target promoter or a combination thereof19. In this Article, we investigate KorAB–CTP interaction and provide a unifying model for KorAB-mediated long-range gene silencing. We find that KorB binds CTP to form a protein clamp that can entrap and slide along DNA to mediate long-range transcriptional repression, likely by allowing KorB to reach target promoters from distal OB sites. We resolved the tripartite crystal structure of a KorB–KorA–DNA co-complex, finding that the DNA-binding KorA is also a clamp-locking protein that docks underneath the DNA-binding domain (DBD) of KorB to latch the closed-clamp state. Our data suggest that the KorA–KorB interaction stalls KorB sliding at target core promoter elements and exploits an inherently unstable open RNA polymerase (RNAP)–promoter complex to exclude RNAP holoenzymes from the promoters. KorA–KorB interaction also increases the residence time of KorAB on DNA, enhancing repression. Overall, we demonstrate how a DNA-binding and clamp-locking protein KorA allows KorB to switch functions between sliding and stalling on DNA to act as an effective repressor. Our findings, therefore, provide unanticipated insights into long-range transcriptional repression mechanisms in bacteria.
Results
KorB is a DNA-stimulated CTPase
As KorB harbours a widely distributed ParB N-terminal domain (NTD) (Fig. 1a and Extended Data Fig. 1a), we sought to determine whether it binds and hydrolyses CTP. Isothermal titration calorimetry (ITC) showed that KorB binds CTP with moderate affinity (KD = 4.5 ± 0.5 μM) (Fig. 1b) and approximately tenfold more tightly to a non-hydrolysable analogue cytidine-5′-(3-thiotriphosphate) (CTPɣS) (KD = 0.4 ± 0.1 μM) (Extended Data Fig. 1b) but qualitatively much weaker to cytidine diphosphate (CDP) (Extended Data Fig. 1b). We then solved a 2.3 Å resolution co-crystal structure of CTPɣS with a KorB∆N30∆CTD variant that lacks the N-terminal peptide (N30) and the C-terminal domain (CTD) (Fig. 1c and Extended Data Fig. 1c) to locate CTP-contacting residues (Fig. 1d). Structure-guided mutagenesis and ITC showed that arginine 117 to alanine (R117A) substitution abolished CTP binding while asparagine 146 to alanine (N146A) did not (Fig. 1b).

a, The domain architecture of KorB: an intrinsically disordered region (IDR) IncC (ParA)-interacting peptide, the NTD, a central OB DBD, a predicted flexible 53-amino acid linker and a CTD. The KorB∆N30∆CTD variant that was used for crystallization lacks the 30 N-terminal amino acids, the linker and the CTD (faded green). b, Analysis of the interaction of KorB (WT and mutants) with CTP by ITC. Each experiment was duplicated. The y-axes show a measured power differential (DP) between the reference and sample cells to maintain a zero temperature between the cells, and enthalpy (∆H) of binding. c, Co-crystal structure of a KorB∆N30∆CTD–CTPɣS complex reveals a CTP-binding pocket and a closed conformation at the NTD of KorB. Top: the front view of the co-crystal structure of KorB∆N30∆CTD (dark green and grey) bound to a non-hydrolysable analogue CTPɣS (orange). Bottom: the top view of the KorB∆N30∆CTD–CTPɣS co-crystal structure. d, The protein–ligand interaction map of CTPɣS bound to KorB∆N30∆CTD. Hydrogen bonds are shown as dashed green lines and hydrophobic interactions as red semi-circles. We did not observe electron density for Mg2+ in the CTP-binding pocket. N146 does not make contact with CTPɣS; however, mutations at the equivalent residue in ParB were previously reported to disrupt CTP hydrolysis11,28, and thus N146 was also selected for mutagenesis in this study. e, NTP hydrolysis rates of KorB (WT and variants) were measured at increasing concentrations of NTP. Experiments were triplicated.
Source data
The phosphate-binding motif (GERRxR) (Extended Data Fig. 1a) is highly conserved in ParB, with the glutamate residue being crucial for CTPase activity but not for CTP binding13,14,27. KorB, despite having an alanine at the equivalent position on its phosphate-binding motif (GARRYR), hydrolysed ~60–90 CTP molecules per KorB dimer per hour in the presence of CTP and a cognate DNA-binding site OB (Fig. 1e and Extended Data Fig. 1d), a rate that is comparable to that of the Bacillus subtilis ParB-like protein Noc and approximately sixfold faster than Caulobacter crescentus ParB (Extended Data Fig. 1d)14,28. KorB did not noticeably hydrolyse other nucleoside triphosphates (NTPs) nor CTP if OB DNA was removed or a scrambled OB DNA was included (Fig. 1e). Furthermore, CTP hydrolysis was abolished in the CTP-binding mutant R117A and also in the CTP-binding proficient N146A (Fig. 1e). Altogether, our data show that KorB is an OB DNA-stimulated CTPase.
CTP and OB DNA promote KorB NTD engagement
In the presence of CTP, canonical ParB self-engages at the NTD to create a clamp-like molecule11,12,13,14. We similarly observed dimerization of NTDs from opposing KorB subunits (with a substantial interface area of ~2,097 Å2) (Fig. 1c), supporting a potential clamping mechanism. To detect KorB NTD dimerization in solution, we used cysteine-specific crosslinking of a purified KorB variant with bismaleimidoethane (BMOE) (Fig. 2a). Based on the KorB∆N30∆CTD–CTPɣS co-crystal structure and sequence alignment between KorB and C. crescentus ParB (Extended Data Fig. 1a), residue S47 at the NTD was substituted by cysteine on an otherwise cysteine-less KorB background (Extended Data Fig. 2a). KorB (S47C) crosslinked at ~20% efficiency in the absence of CTP (lane 2) or in the presence of 24 bp OB DNA or scrambled OB DNA alone (lanes 3 and 4) (Fig. 2a). Crosslinking efficiency reduced to ~5–10% when CTP alone was included (lane 6) or together with scrambled DNA (lane 5) (Fig. 2a), suggesting that in the absence of the OB DNA, CTP inhibits KorB NTD engagement. However, the crosslinking efficiency increased to ~80% (lane 7) when both CTP and cognate OB DNA were added together (Fig. 2a), indicating that both CTP and OB DNA are required to promote KorB NTD engagement. Consistent with this, a CTP-binding mutant KorB (S47C R117A) did not crosslink beyond ~20% (Fig. 2a). Furthermore, KorB (S47C N146A), which can bind but not hydrolyse CTP, did not crosslink beyond ~40% (Fig. 2a), suggesting that the N146A substitution also impairs NTD engagement. However, this is unlikely due to the lack of CTP hydrolysis as a non-hydrolysable analogue CTPɣS could readily promote crosslinking of KorB (S47C), even without DNA or with a scrambled DNA (lanes 8 and 9) (Fig. 2a).

a, SDS–PAGE analysis of BMOE crosslinking products of 8 µM of KorB (S47C) dimer (and variants) ± 1 µM 24 bp OB/scrambled (SCR) DNA ± 1 mM CTP. X indicates a crosslinked form of KorB. Sub-stoichiometric concentration of OB DNA was sufficient to promote efficient crosslinking of KorB (S47C) (Extended Data Fig. 2b). The S47C substitution did not impact the OB-mediated repression function of KorB (Extended Data Fig. 2c). Quantification of the crosslinked fraction is shown below each representative image. Data are represented as mean values ± s.d. from three replicates. b, CTP binding promotes the diffusion of KorB on DNA containing OB sites. Left: schematic of the C-trap optical tweezers experiment where DNA containing one or two clusters of 8×OB sites were tethered between two beads and scanned with a confocal microscope using 488 nm illumination. A 44.8 kb DNA was constructed from ligating together two identical tandem 22.4 kb DNA, each containing 8×OB and 1×OA site (Methods). The OA site is omitted from the diagram for simplicity. Right: representative kymographs showing the binding of KorB at the OB cluster in the presence or absence of CTPɣS or CTP. Scale bars represent fluorescence intensity on the kymographs. Kymographs were taken in a buffer-only channel, after 60 s incubation in the protein channel, to reduce the fluorescence background. c, CTP-dependent N engagement is essential for KorB to repress transcription from a distance. Left: schematic diagrams of promoter–xylE reporter constructs. Right: values shown are fold of repression, which is a ratio of XylE activities from cells co-harbouring a reporter plasmid and a KorB-expressing plasmid to that of cells co-harbouring a reporter plasmid and an empty plasmid (KorB-minus control). Data are represented as mean values ± s.d. from three replicates. See Extended Data Fig. 2c for the absolute values of XylE activities and an α-KorB immunoblot from lysates of cells used in the same experiments.
Source data
CTP enables KorB diffusion on an OB DNA substrate
To investigate the impact of CTP on KorB–DNA interaction, we used dual optical tweezers combined with confocal fluorescence microscopy29. Here, individual DNA molecules were immobilized between two polystyrene beads and extended almost to their contour length under force (Fig. 2b). We did not observe fluorescence signal from Alexa Fluor 488 (AF488)–KorB incubated with DNA devoid of OB sites (Extended Data Fig. 3a), consistent with the requirement of OB for KorB binding. Next, we used DNA with eight OB sites that were present in either one or two clusters on the DNA, to increase the probability of observing KorB–DNA binding (Fig. 2b; see figure legend and Methods for more details on the construction of these DNA molecules). Kymographs showed two stable regions of high fluorescence, corresponding to the position of the two OB clusters (Fig. 2b) when AF488–KorB alone was used, consistent with the initial binding of KorB at OB being CTP independent. In the presence of CTP or CTPɣS, fluorescence signals were identified outside of the OB clusters (Fig. 2b), suggesting that KorB–CTP was now distributed non-specifically along the DNA. We determined that AF488–KorB diffuses on DNA with a diffusion constant (D = ~1.6 ± 0.1 µm2 s−1) (Extended Data Fig. 3b), which is approximately fourfold higher than that of B. subtilis ParB–CTP diffusion on DNA29. We also occasionally observed KorB–OB stable binding events under both CTP and CTPɣS conditions (Fig. 2b). We interpret these events as either new KorB proteins being loaded at 8×OB or existing KorB proteins diffusing and occasionally re-binding to OB when they re-encounter this cluster.
KorB–CTP does not condense OB DNA in vitro
Canonical ParB–CTP was previously reported to bridge and condense DNA in vitro29,30,31,32. To test whether KorB induces DNA condensation, we used magnetic tweezers and DNA molecules containing a cluster of 16 OB sites (16×OB) and an OA site (1×OA) (Extended Data Fig. 4). We observed no difference in the force–extension curves in the presence or absence of KorB + 2 mM CTP (Extended Data Fig. 4), indicating that KorB–CTP does not condense DNA under the tested conditions. In the case of B. subtilis BsParB control, we observed unspecific condensation at high concentrations (1–2 µM). As expected, BsParB was not able to condense at a lower concentration (500 nM) because BsParB does not recognize OB sites on our DNA substrate.
CTP-dependent KorB NTD engagement is essential for long-range transcriptional repression
KorB was previously shown to mediate long-range transcription repression19. To investigate whether CTP binding and DNA sliding influence this activity, we constructed two promoter–xylE transcriptional fusion reporters and assayed for catechol dioxygenase activity in the presence or absence of KorB in vivo (Fig. 2c). OB DNA was either engineered 4 bp (OB proximal) or 1.5 kb (OB distal) upstream of the −35 element of the core promoter of the RK2 trbB gene (Fig. 2c). The presence of KorB led to ~4- to 5-fold transcriptional repression compared with a KorB-minus control for both promoter–reporter constructs, consistent with previous findings19 (Fig. 2c and Extended Data Fig. 2c). The NTD-engagement-defective KorB (R117A) and KorB (N146A) variants were capable of repressing transcription from an OB-proximal promoter but not from an OB-distal promoter (Fig. 2c). Overall, our data suggest that the ability of KorB to bind CTP and close the clamp to slide on DNA is crucial for long-range gene silencing.
KorA promotes the NTD engagement of KorB independent of CTP and OB DNA
KorB has previously been reported to require KorA (Fig. 3a) to strengthen transcriptional repression, especially at OB-distal promoters19,25,26, yet it is unclear how KorA and KorB cooperate to do so. We hypothesized that KorA might modulate the CTP-dependent activities of KorB. To investigate this possibility, we pre-incubated purified cysteine-less KorA with KorB (S47C) in the presence or absence of OB DNA and/or CTP before crosslinking by BMOE. KorB (S47C) crosslinked at ~20% in the absence of KorA (lane 2) (Fig. 3b) but increased to ~60% in the presence of KorA alone (lane 3) or additionally with OB or scrambled OB DNA (lanes 4 and 5) (Fig. 3b). In the presence of CTP alone, KorA increased the crosslinking efficiency of KorB (S47C) to ~20% (lane 7) (Fig. 3b), again higher than the ~10% crosslinked fraction observed in the absence of KorA (lane 6) (Fig. 3b). KorB (S47C) crosslinked maximally at ~80% efficiency when KorA, CTP and OB DNA were all included (lane 9) (Fig. 3b). KorA also improved the crosslinking efficiency of KorB (S47C) when OA DNA was present (lanes 3 and 4) (Extended Data Fig. 5a). It is worth noting that for both KorB (R117A) and KorB (N146A) variants, which are defective in NTD engagement, KorA further increases the crosslinking efficiency in all conditions (Extended Data Fig. 5b). Overall, our results suggest that KorA promotes NTD engagement of KorB. KorA likely does so via direct interaction with KorB24,25, which we confirmed by ITC (Fig. 3c).

a, The domain architecture of KorB (same as Fig. 1a) and KorA. The KorB∆N30∆CTD variant that was used for crystallization lacks the 30 N-terminal amino acids, the linker and the CTD (faded green). KorA has an N-terminal OA DNA-binding domain (NTD) and a C-terminal dimerization domain (CTD). b, SDS–PAGE analysis of BMOE crosslinking products of 8 µM of KorB (S47C) dimer (or the variant S47C F249A) ± 8 µM of KorA dimer (WT or the variant Y84A) ± 1 µM 24 bp OB/scrambled OB DNA ± 1 mM CTP. X indicates a crosslinked form of KorB. Quantification of the crosslinked fraction is shown below each representative image. Data are represented as mean values ± s.d. from three replicates. c, Analysis of the interaction of KorB with KorA by ITC. The experiment was duplicated. d, KorA–DNA docks onto the DBD of a clamp-closed KorB in the co-crystal structure of a KorB∆N30∆CTD–KorA–DNA complex. Left: the side view of the co-crystal structure of KorB∆N30∆CTD (dark green and light green) bound to a KorA (magenta and pink) on a 14 bp OA DNA duplex (black). Right: The front view of the KorB∆N30∆CTD–KorA–DNA co-crystal structure. e, Helix α10 (dark green) of KorB interacts with helix α5 (magenta) of KorA. Hydrogen bonds are shown as dashed lines, pi-stacking interaction between the aromatic ring of Y84 in KorA with the E248–F249 peptide bond of KorB and between the aromatic ring of F249 in KorB with the E80–H81 peptide bond of KorB are shown as black semi-circles (Extended Data Fig. 6b,c).
Source data
KorA–DNA docks onto the DBD locking the KorB clamp
To determine the mechanism by which KorA induces the KorB closed-clamp conformation, we solved a 2.7 Å resolution structure of a tripartite complex between KorB∆N30∆CTD and KorA bound to its 14 bp OA DNA duplex (Fig. 3d and Extended Data Fig. 6a). The asymmetric unit contains two subunits of KorA that dimerize via the C-terminal β1 strands and α5 helices (Fig. 3d). The DBDs (helices α1–4) from opposing KorA subunits dock into adjacent major grooves on the OA DNA (Fig. 3d). The asymmetric unit also contains two subunits of KorB∆N30∆CTD whose opposing NTDs (strands β1–3 and helices α1–4) are self-dimerizing (interface area = ~1,250 Å2) (Fig. 3d), showing that KorB∆N30∆CTD in the tripartite complex has already adopted an NTD-engaged conformation, even though CTPɣS was not added to the crystallization set-up (see Supplementary Information for further structural analysis and discussion). Therefore, we reasoned that KorA–DNA may facilitate or capture KorB∆N30∆CTD in the NTD-engaged state.
The DNA-bound KorA dimer docks underneath the OB-binding domain of KorB∆N30∆CTD, specifically via α5 of KorA interacting directly with α10 of KorB∆N30∆CTD (Fig. 3d). A network of specific interactions is established at the KorA–KorB interface, including KorA Y84 and KorB F249 (Fig. 3e and Extended Data Fig. 6b,c). ITC data verified observed interactions, showing that KorA (Y84A)24 and KorB (F249A) completely abolished the interaction with KorB (wild type (WT)) and KorA (WT), respectively (Extended Data Fig. 5c). Furthermore, neither KorA (Y84A) nor KorB (S47C F249A) increased KorB crosslinking beyond ~20% (lanes 10 and 11 versus lane 3, Fig. 3b). Overall, our results showed that KorA, via its C-terminal α5, directly interacts with the DBD of KorB to lock KorB in an NTD-engaged closed-clamp state.
KorA blocks KorB diffusion on DNA and increases retention time at operator OA
Next, we used optical tweezers to investigate the importance of KorAB interaction for DNA sliding in the presence of CTP. Individual DNA molecules were engineered to contain an OA site ~3 kb away from the 8×OB sites (Fig. 4a). Without CTP, kymographs showed that fluorescence signals from AF488-labelled KorB and AF647-labelled KorA were confined only to the corresponding positions of OB and OA sites, respectively (Fig. 4a, top right panel). When CTP was included, the location of the fluorescence signal from AF647–KorA remained confined to OA sites. By contrast, AF488–KorB signals were found outside of the OB clusters, consistent with KorB–CTP sliding on DNA (Fig. 4a, bottom right panel). However, we observed the accumulation of AF488–KorB fluorescence signal between OB and its proximal OA site (Fig. 4a, bottom right panel), suggesting that OA-bound KorA and/or OA-bound KorA–KorB complex might block the sliding of KorB–CTP.

a, Left: schematic of the C-trap optical tweezers experiment with positions of 8×OB and 1×OA clusters indicated. Right: representative kymograph showing the binding of AF488-labelled KorB and AF647-labelled KorA ± CTP. The upper panel kymograph was taken in a channel containing fluorescently labelled KorAB, hence the higher fluorescence background. The lower panel kymograph was taken in a buffer-only channel to reduce the fluorescence background. b, Left: schematic of the C-trap optical tweezers experiment. Right: representative kymographs of AF647–KorA and AF488–KorB in the presence of CTP for the four described cases. The frequency of occurrence for each case is indicated on the kymographs (the total number of recorded events n = 182). Kymographs were taken in a buffer-only channel, after a 60 s incubation in the protein channel, to reduce fluorescence background. c, Box plot showing the residence times (mean ± s.e.m.) of AF647–KorA alone (2.9 ± 0.2 s, n = 122), in the presence of KorB (2.6 ± 0.2 s, n = 70) or KorB–CTP (10.1 ± 0.6 s, n = 125), that of AF647–KorA (Y84A) in the presence of KorB–CTP (3.7 ± 0.3 s, n = 148), and that of AF647–KorA in the presence of KorB (F249A) and 2 mM CTP (3.1 ± 0.2 s, n = 126) (see Extended Data Fig. 7b for representative kymographs). Box plots indicate the median and the 25th and 75th percentiles of the distribution, and whiskers extending to data within 1.5× interquartile range. Outliers are displayed as points beyond the whiskers. d, KorA captures the KorB–CTP clamp to heighten long-range transcriptional repression. Top: schematic diagrams of promoter–xylE reporter constructs. Bottom: values shown are fold of repression, which is a ratio of XylE activities from cells co-harbouring a reporter plasmid and KorB/A-expressing plasmid to that of cells co-harbouring a reporter plasmid and an empty plasmid (KorA/B-minus control). Data are represented as mean values ± s.d. from three replicates (Extended Data Fig. 8b).
Source data
In addition, we constructed another DNA substrate with 8×OB and two copies of the OA sequence to increase the chances of KorA binding to this site (Fig. 4b and Extended Data Fig. 7a). We identified four distinct cases regarding KorB localization and the simultaneous binding of KorA and KorB in the presence of CTP (Fig. 4b). In case I, KorB localized between the OA and OB sites. Case I is most frequent at ~45% of the 182 recorded events and consistent with OA-bound KorA and/or OA-bound KorA–KorB complex blocking the sliding of KorB–CTP. We occasionally observed trespassing of KorB beyond the OA site; trespassing is likely due to a transient disruption of the KorA–KorB complex or KorB diffusing beyond OA before the complex formation. In case II (~21%), KorB localized between OA and the OB-proximal bead. We interpret case II as follows: KorB was bound to OB and, in the presence of CTP, could freely diffuse in either direction. In both cases I and II, a subsequent KorB protein binding to OB might act as a roadblock, preventing a previously loaded KorB from passing through the OB site, thereby restricting KorB to either side of OB. The higher occurrence of case I compared with case II is likely due to the higher chance of KorB finding KorA within the OA–OB region given a particular lifetime of the KorB–DNA interaction. In case III (~25%), there were stable co-localizations of both KorA and KorB at OA. Case III likely reflects a single diffusing KorB protein binding to KorA. Crucially, we never observed KorB localization at OA without KorA. Lastly, in case IV (~9%), we observed mostly static KorA and KorB binding at OA and OB, respectively.
During the investigation, we noted that the AF647–KorA fluorescence signal showed an on–off behaviour at the OA site in the presence of KorB but absence of CTP (Extended Data Fig. 7b). However, the AF647–KorA signal (at OA) was more stable over time when KorB and CTP were both included (Extended Data Fig. 7b), suggesting that KorB–CTP might reduce KorA dissociation from OA. To test this possibility, we quantified the residence time of AF647–KorA at OA either alone or in the presence of unlabelled KorB with or without CTP (Fig. 4c). The residence time increased ~4.5-fold in the presence of KorB–CTP compared to with or without apo-KorB (Fig. 4c). It is worth noting that this effect was abolished when non-interacting AF488–KorA (Y84A) or KorB (F249A) variants were used instead (Fig. 4c and Extended Data Fig. 7b). Altogether, we suggest that KorA can block the diffusion of KorB on DNA, and KorB increases the residence time of KorA on DNA through their specific interaction as observed in the crystal structure. Finally, magnetic tweezers experiments showed no evidence that KorB–CTP could condense OA and OB containing DNA in the presence of KorA (Extended Data Fig. 4).
KorA captures and locks KorB–CTP clamp converting KorB to a local co-repressor
To investigate the interplay between KorA and KorB–CTP in vivo, we engineered a promoter–xylE reporter where the OB site is 1.5 kb upstream of the core promoter while OA overlaps with the −10 element (Fig. 4d), mimicking KorAB-regulated promoters natively found on RK2 (ref. 8). KorA and KorB were induced from separate plasmids, and there was not sufficient evidence that their production altered the copy number of the reporter plasmid nor those of the korAB expression plasmids (Extended Data Fig. 8a). KorB alone repressed reporter expression weakly by approximately fourfold (Fig. 4d and Extended Data Fig. 8b). This low repression was also observed when KorB (F249A), which does not bind KorA, was expressed alone. Both KorA (WT) and the non-interacting KorA (Y84A) variant repressed transcription ~200-fold when produced alone, consistent with previous findings24 (Fig. 4d). However, when WT KorB and KorA were co-expressed, transcriptional repression was increased to ~38,000-fold, indicating cooperation between the two proteins24 (Fig. 4d). This cooperative transcriptional repression was abolished when KorA (WT) and KorB (F249A) or KorA (Y84A) and KorB (WT) were co-produced. As F249A and Y84A substitutions removed the ability of KorA to bind KorB and close the clamp, these activities are essential for effective and efficient transcriptional repression24.
As KorA could bind apo-KorB (Fig. 3c), we wondered whether DNA-unbound KorB could cooperate with KorA to elicit the same high level of transcriptional repression in vivo. To investigate, we scrambled the distal OB site and measured XylE activity when WT KorAB or variants were co-produced (Fig. 4d). In the absence of OB, we reasoned that only apo-KorB and CTP-bound KorB (that is, opened clamp) could form inside the cells, while OB-stimulated DNA-entrapped KorB–CTP (that is, closed clamp) could not. As expected, in the absence of OB, no cooperative transcriptional repression was observed (Fig. 4d). Collectively, these results suggest that OA-bound KorA captures a DNA-entrapped sliding clamp of KorB to cooperatively repress promoters.
KorB–CTP and KorA exploit unstable promoter complexes to repress transcription initiation
The molecular mechanism governing the co-repressive activity of KorAB remains elusive. The proximity of the OA site to the core promoter elements of RK2 genes33,34 suggests a classical RNAP-occlusion mechanism. However, previous work suggested a potential interaction between KorB and RNAP, indicating a repression mechanism stabilizing a closed or intermediate state of a promoter complex where the DNA bubble is incompletely formed35. To investigate further, we first used in vitro transcription initiation assays with Escherichia coli RNAP and a linear DNA containing a model promoter PkorA36 which features an OA site overlapping with the upstream half of its −10 element and an OB site directly upstream of the −35 element (Fig. 5a). Transcription initiation assays confirmed that KorA and KorB (with and without CTP) individually function as repressors (Extended Data Fig. 9a,b). The combined activity of KorAB was not significantly greater than KorA alone, but under the conditions of our assay the repression activity of KorA alone was quite high, so observing a significant increase with additional KorB became difficult (Extended Data Fig. 9a,b). Next, to investigate the possible binding of KorA and KorB to E. coli Eσ70–promoter complexes (Eσ70:DNA), we used native mass spectrometry (nMS). Introducing a 2.5-fold excess of KorA or KorB to PkorA-bound E. coli Eσ70 (Eσ70:DNA) led to near-complete dissociation of Eσ70 from DNA rather than ternary complex formation (Fig. 5b,c). No corresponding KorB-bound Eσ70 peaks were observed (Fig. 5b,c), indicating that KorB does not interact with Eσ70. Minor Eσ70–KorA peaks were detected (Fig. 5b), but these are non-specific as the addition of 2.5-fold excess KorA to Eσ70 without promoter DNA resulted in no such complex (Extended Data Fig. 9c).

a, Promoter scaffold from the RK2 korABF operon (PkorA) is shown with core promoter elements (underlined), OA (magenta box), and OB (green box). Differences to the PkorA:λPR discriminator are depicted. b, Deconvolved nMS spectra of E. coli Eσ70 holoenzyme assembled on 100 bp PkorA DNA (Eσ70:DNA) with and without 2.5-fold excess KorA dimer in 150 mM ammonium acetate pH 7.5 and 0.01% Tween-20. c, Deconvolved nMS spectra of Eσ70:DNA with and without 2.5-fold excess KorB dimer in 500 mM ammonium acetate pH 7.5 and 0.01% Tween-20. d, Top: representative gel close-up on the abortive RNA product (5′-ApUpG-3′) transcribed by Eσ70 in in vitro abortive initiation half-life assays on the two PkorA linear scaffold variants. Bottom: plot of fraction of competitor-resistant open complexes (from normalized abortive RNA band intensities) against time. Data points from three experimental replicates are mean values ± s.e.m. with an exponential trend line fit. Some error bars are too small or lead to negative values and thus were omitted. Estimated half-lives are shown adjacent to exponential decay trend lines. e, WT PkorA and PkorA:λPR discriminator in vitro transcription repression of Eσ70 in the presence of fivefold excess KorA and/or KorB. Data points from at least three experimental replicates are normalized to holoenzyme only control as mean values ± s.e.m. Eσ70 + KorA and Eσ70 + KorA + KorB conditions on WT PkorA has n = 4, while the rest are n = 3; this remains valid as repression quantities are normalized to a Eσ70-only control and background-corrected for each gel run, and s.e.m. are considered in statistical analysis. P values were calculated by unpaired two-tailed Welch’s t-tests; *P ≤ 0.05, **P ≤ 0.01, ***P ≤ 0.001. The P values are 3.66 × 10⁻³ (Eσ70 + KorA), 0.635 × 10⁻³ (Eσ70 + KorB) and 31.5 × 10⁻³ (Eσ70 + KorA + KorB).
Source data
Analysis of the PkorA promoter sequence revealed near-consensus −10 (TAAACT; consensus is TATAAT), −35 element (TTGACG; consensus is TTGACA)37,38 and a consensus 17 bp spacer between the −10 and −35 elements (Fig. 5a). These features highly favour promoter melting by RNAP39,40. However, the discriminator (the sequence between the −10 element and the transcription start site) (Fig. 5a), crucial for the stability of an open RNAP–promoter complex (RPo), is highly unfavourable (TCTCTC; consensus is GGGnnn)41. Indeed, the substitution of the WT discriminator with a favoured discriminator from bacteriophage λ PR (Fig. 5a)42,43 increased the half-life of PkorA RPo from 2 min to over 90 min, stabilizing the RPo over 50-fold (Fig. 5d). The substituted discriminator showed a significant decrease in in vitro transcription repression when KorA and KorB were added individually or combined (Fig. 5e). The instability of the PkorA RPo complex, coupled with the observations of KorA and KorB binding to DNA but not to Eσ70, suggests the following model. PkorA RPo is inherently unstable, resulting in frequent RNAP dissociation that allows KorA and KorB to bind their respective operator sites and, upon sliding, form a repressome on the promoter that occludes RNAP from the promoter. Our findings suggest that KorAB exploits RK2 promoter kinetic instabilities (that is, weak discriminators leading to short half-lives) to competitively occlude RNAPs from DNA.
Discussion
KorB is important for regulating gene expression for basic RK2 functions7. Our work has shown that CTP is required for KorB to form an OB-dependent sliding clamp on DNA, which enables KorB to travel a long distance to repress distal promoters (Fig. 6). Similar to chromosomal ParB15,44, we propose that KorB loads at the OB site, binds CTP and then switches to a closed-clamp conformation through NTD engagement, allowing it to escape the high-affinity loading site and slide away while entrapping DNA (Fig. 6a).
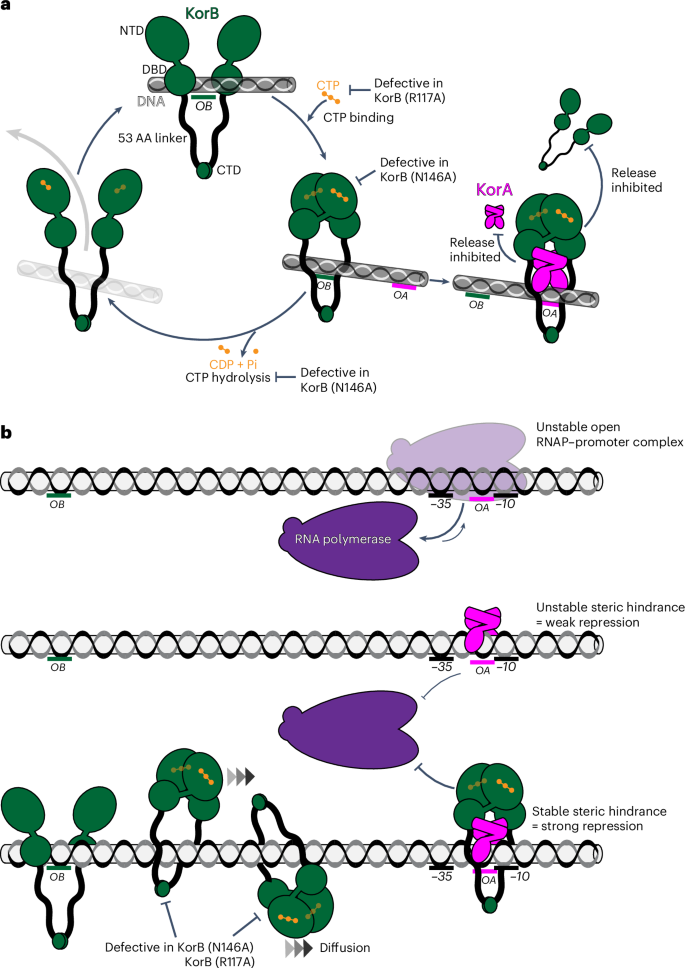
a, KorB (dark green) loading, sliding, and release cycle. Loading KorB is likely an open clamp, in which OB DNA binds at the DBD. The presence of CTP (orange) and OB DNA likely triggers KorB clamp closing. In this state, KorB can slide away from the OB site by diffusion while entrapping DNA. CTP hydrolysis and/or the release of hydrolytic products (CDP and inorganic phosphate Pi) likely reopen the clamp to release DNA. Substitutions that affect various KorB functions are also indicated on the schematic diagram. KorA (magenta) bound at OA can form a complex with and promote or trap KorB in a closed clamp state. In this state, KorB most likely still entraps DNA. The tripartite KorAB–DNA reduces the release of KorB from DNA as well as the release of KorA from OA DNA. b, A model for KorA–KorB cooperation to enhance long-range transcription repression. On RK2, OB can position kilobases away from the target core promoter elements while OA is almost invariably near these core promoter elements. Owing to an unfavourable discriminator sequence, the RNAP holoenzyme–promoter DNA complex is inherently unstable. In the absence of KorB–CTP, KorA binds OA with a low retention time, thus only providing an unstable steric hindrance to occlude RNAP (magenta) from the core promoter elements, resulting in weak transcriptional repression. In the presence of CTP, KorB loads at a distal OB site, binds CTP, closes the clamp and slides by diffusion to reach the distal OA site. OA-bound KorA captures and locks KorB in a clamp-closed conformation. In this state, the KorAB–DNA co-complex presents a larger and more stable steric hindrance. As a result, the KorAB–DNA co-complex can exploit the unstable RPo and occludes RNAP more effectively, hence stronger transcriptional repression than each protein alone can provide.
A sliding clamp is seemingly incompatible with transcription repression. Such a clamp could, for example, slide past the core promoter region, providing access to RNAP. Accordingly, our in vivo transcriptional reporter assay showed that KorB alone only repressed promoters weakly (Fig. 2c). It has also been shown that transcribing RNAPs can steadily traverse the B. subtilis ParB–DNA partition complex in vitro32, and ParB sliding to neighbouring DNA does not affect gene expression in vivo45. There are exceptions; for example, plasmid P1 ParB autoregulates its expression46,47,48 and Pseudomonas aeruginosa, Vibrio cholerae and Streptococcus pneumoniae ParBs control transcription of neighbouring genes, but again the repression is weak49,50,51. Our data suggest that KorA has a role in switching KorB from a sliding clamp, ineffective at transcription repression, to a sitting clamp which is more effective at repression. Stationary OA-bound KorA captures KorB sliding towards it from a distal OB site (Fig. 6b). As OA is invariably found next to core promoter elements8, a stationary OA-bound KorA–KorB co-complex likely provides a larger and more persistent steric hindrance to RNAP than KorA or KorB alone (Fig. 6b). Furthermore, a KorAB complex improves the retention of KorA at OA (Fig. 4c), providing a more stable hindrance to RNAP (Fig. 6a, b). Our finding that KorA binding causes apo-KorB to close the clamp independently of OB DNA and CTP (Fig. 3b) suggests that KorA might prolong the closed-clamp state of KorB–CTP, even in the case that bound KorB eventually hydrolyses CTP (Fig. 6a). We speculate that a self-reinforcing interplay between KorA and KorB on DNA cooperatively creates a super-repressive complex. Finally, our data also suggest that this co-repression occurs via a competitive occlusion mechanism (Fig. 5), with KorAB exploiting an intrinsically unstable open RPo to exclude RNAP holoenzymes from the target promoters (Fig. 6b).
Transcriptional regulation by a DNA-sliding clamp, as observed for KorB–CTP here, is reminiscent of the activation of virulence genes in Shigella flexneri by a VirB-CTP sliding clamp52,53,54 or the activation of T4-phage late genes by a phage-encoded PCNA-like gp45 protein clamp55,56. The ability of KorA to trap sliding clamp KorB is functionally similar to eukaryotic CTCF and cohesin, respectively57, where a DNA-binding protein CTCF restrains the translocation and loop extrusion by cohesin at specific DNA sites57,58. Our insights into KorAB here might have an impact beyond the bacterial transcription field, providing a conceptual advance in our understanding of phage, bacterial and eukaryotic transcriptional regulation.
Methods
Strains, media and growth conditions
E. coli strains were grown in lysogeny broth (LB) medium. When appropriate, the media was supplemented with antibiotics at the following concentrations (liquid/solid (μg ml−1)): carbenicillin (50/100), chloramphenicol (20/30), kanamycin (30/50), streptomycin (50/50) and tetracycline (12.5/12.5).
Plasmid and strain construction
Plasmids and strains used or generated in this study are listed in Supplementary Tables 1 and 2, respectively.
For plasmid construction, a double-stranded DNA fragment containing a desired sequence was chemically synthesized (gBlocks, IDT). The target plasmid was double-digested with restriction enzymes and gel-purified. A 10 μl reaction mixture was created with 5 μl 2× Gibson master mix (NEB) and 5 μl of combined equimolar concentration of purified backbone and gBlock(s). This mixture was incubated at 50°C for 60 min. Gibson assembly was possible owing to shared sequence similarity between the digested backbone and the gBlock fragment(s). All resulting plasmids were verified by Sanger sequencing (Genewiz) or whole-plasmid sequencing (Plasmidsaurus).
Construction of pET21b::korB–(his)6 (WT and mutants)
DNA fragments containing mutated korB genes (korB*) were chemically synthesized (gBlocks, IDT). The NdeI-HindIII-cut pET21b plasmid backbone and korB* gBlocks fragments were assembled using a 2× Gibson master mix (NEB). Gibson assembly was possible owing to a 37 bp sequence shared between the NdeI-HindIII-cut pET21b backbone and the gBlocks fragment.
Construction of pET21b::korA–(his)6 (WT and mutants)
DNA fragments containing mutated korA genes (korA*) were chemically synthesized (gBlocks, IDT). The NdeI-HindIII-cut pET21b plasmid backbone and korA* gBlocks fragments were assembled using a 2× Gibson master mix (NEB). Gibson assembly was possible owing to a 37 bp sequence shared between the NdeI-HindIII-cut pET21b backbone and the gBlocks fragment.
Construction of pBAD33::korB (WT and mutants)
DNA fragments containing mutated korB genes (korB*) were chemically synthesized (gBlocks, IDT). The SacI-HindIII-cut pBAD33 plasmid backbone and korB* gBlocks fragments were assembled using a 2× Gibson master mix (NEB). Gibson assembly was possible owing to a 38 bp sequence shared between the SacI-HindIII-cut pBAD33 backbone and the gBlocks fragment.
Construction of pDM1.2::korA (WT and mutants)
DNA fragments containing mutated korA genes (korA*) were chemically synthesized (gBlocks, IDT). The EcoRI-SalI-cut pDM2.1 plasmid backbone and korA* gBlocks fragments were assembled using a 2× Gibson master mix (NEB). Gibson assembly was possible owing to a 38 bp sequence shared between the EcoRI-SalI-cut pDM2.1 backbone and the gBlocks fragment.
Construction of pSC101::PkorA (WT and mutants)
DNA fragments containing mutated PkorA promoters (PkorA*) were chemically synthesized (gBlocks, IDT). The BamHI-cut pSC101 plasmid backbone and PkorA* gBlocks fragments were assembled using a 2× Gibson master mix (NEB). Gibson assembly was possible owing to a 38 bp sequence shared between the BamHI-cut pSC101 backbone and the gBlocks fragment.
Construction of pUC19::146-bp-PkorA
A 146 bp DNA fragment containing PkorA was chemically synthesized (gBlocks, IDT) and subsequently 5′-phosphorylated using T4 PNK (NEB). Phosphorylated 146 bp PkorA DNA was blunt-end ligated with a dephosphorylated SmaI-cut pUC19 using T4 DNA ligase (NEB).
Construction of pUC19::146-bp-PkorA:λPR
To clone the 146 bp PkorA:λPR discriminator DNA into pUC19, pUC19::146bp-PkorA was used as a template for site-directed mutagenesis with Q5 DNA Polymerase (NEB) using the primers 5′-AACATTTCTCGCACG-3′ and 5′-TAGCTAAACTGGTTGCATGTGCTGGCG-3′ at an annealing temperature of 57 °C. The resulting PCR product was introduced into E. coli DH5α, and carbenicillin-resistant colonies were isolated. Subsequently, plasmids were isolated and verified by whole-plasmid sequencing (Plasmidsaurus).
Construction of E. coli DH5α and BL21 pLysS strains containing the desired combinations of plasmids
Plasmids were introduced/co-introduced into E. coli DH5α or E. coli BL21 pLysS via heat shock transformation (42 °C, 30 s) in the required combinations (Supplementary Table 2).
Protein overexpression and purification
Proteins used or generated in this study are listed in Supplementary Table 3.
KorA and KorB (WT and mutants)
Protein preparation for crystallization, ITC and biochemical experiments, excluding BMOE crosslinking, was performed as follows. C-terminally His-tagged KorA and KorB (WT and mutants) were expressed from the plasmid pET21b in E. coli Rosetta (BL21 DE3) pLysS competent cells (Merck). Overnight culture (120 ml) was used to inoculate 6 l of LB with selective antibiotics. Cultures were incubated at 37 °C with shaking at 220 r.p.m. until OD600 of ~0.6. Cultures were cooled for 2 h at 4 °C before isopropyl-β-d-1-thiogalactopyranoside (IPTG) was added to a final concentration of 0.5 mM. The cultures were incubated overnight at 16 °C with shaking at 220 r.p.m. before cells were pelleted by centrifugation. Cell pellets were resuspended in buffer A (100 mM Tris–HCl, 300 mM NaCl, 10 mM imidazole, 5% (v/v) glycerol, pH 8.0) with 5 mg lysozyme (Merck) and a cOmplete EDTA-free protease inhibitor cocktail tablet (Merck) at room temperature for 30 min with gentle rotation. Cells were lysed on ice with 10 cycles of sonication: 15 s on/15 s off at an amplitude of 20 µm and pelleted at 32,000 g for 35 min at 4 °C, and the supernatant filtered through a 0.22 µm sterile filter (Sartorius). Clarified lysate was loaded onto a 1 ml HisTrap HP column (Cytiva) pre-equilibrated with buffer A. Protein was eluted from the column using an increasing gradient of imidazole (10–500 mM) in the same buffer. Desired protein fractions were pooled and diluted in buffer B (100 mM Tris–HCl, 20 mM NaCl, 5% v/v glycerol, pH 8.0) until the final concentration of NaCl was 60 mM. Pooled fractions were loaded onto a 1 ml Heparin HP column (Cytiva) pre-equilibrated with buffer B. Protein was eluted from the column using an increasing gradient of NaCl (20–1,000 mM) in the same buffer. Desired protein fractions were pooled and loaded onto a preparative-grade HiLoad 16/600 Superdex 75 pg gel filtration column (GE Healthcare) pre-equilibrated with elution buffer (10 mM Tris–HCl, 150 mM NaCl, pH 8.0). Desired fractions were identified and analysed for purity via sodium dodecyl sulfate–polyacrylamide gel electrophoresis (SDS–PAGE) before being pooled. Aliquots were flash frozen in liquid nitrogen and stored at −80 °C. For protein samples to be used for protein–nucleotide binding ITC experiments, Mg2+ was introduced via an overnight dialysis step at 4 °C in buffer containing 10 mM Tris–HCl, 150 mM NaCl and 5 mM MgCl2, pH 8.0 before concentration and quantification as described above.
Protein preparations for BMOE crosslinking were purified using a one-step Ni-affinity column with all buffers adjusted to pH 7.4 for optimal crosslinking. Purified proteins were subsequently desalted using a PD-10 column (Merck) before being concentrated using an Amicon Ultra-4 10 kDa cut-off spin column (Merck). Final protein samples were aliquoted and stored at −80 °C in storage buffer (100 mM Tris–HCl, 300 mM NaCl, 5% v/v glycerol, 1 mM Tris(2-carboxyethyl) phosphine, pH 7.4).
Both biological (new sample preparations from a stock aliquot) and technical (same sample preparation) replicates were performed for assays in this study. Protein concentrations were determined by Bradford assay and reported as concentrations of KorA or KorB dimers.
E. coli His10–PPX–RNAP
Plasmid pVS11 (also called pEcrpoABC(-XH)Z)59,60 was used to overexpress each subunit of E. coli RNAP (full-length α, β, ω) as well as β′-PPX-His10 (PPX; PreScission protease site, LEVLFQGP, GE Healthcare) were co-introduced with a pACYCDuet-1::E.coli rpoZ into E. coli BL21(DE3) to ensure saturation of all RNAPs with E. coli RpoZ. Cells were grown in the presence of 100 µg ml−1 ampicillin and 34 μg ml−1 chloramphenicol to an OD600 of ~0.6 in a 37 °C shaker. Protein expression was induced with 1 mM IPTG (final concentration) for 4 h at 30 °C. Cells were collected by centrifugation and resuspended in 50 mM Tris–HCl pH 8.0, 5% w/v glycerol, 10 mM dithiothreitol (DTT), 1 mM phenylmethylsulfonyl fluoride (PMSF) and 1× protease inhibitor cocktail. For 200× protease inhibitor cocktail (40 ml volume), the following are dissolved into 100% ethanol: 696 mg PMSF, 1.248 g benzamidine, 20 mg chymostatin, 20 mg leupeptin, 4 mg pepstatin A and 40 mg aprotinin.
After lysis by French press (Avestin) at 4 °C, the lysate was centrifuged twice for 30 min each. Polyethyleneimine (PEI, 10% w/v pH 8.0, Acros Organics, Thermo Fisher Scientific) was slowly added to the supernatant to a final concentration of ~0.6% PEI with continuous stirring. The mixture was stirred at 4 °C for an additional 25 min, then centrifuged for 1.5 h at 4 °C. The pellets were washed three times with 50 mM Tris–HCl pH 8.0, 500 mM NaCl, 10 mM DTT, 5% w/v glycerol, 1 mM PMSF, and 1× protease inhibitor cocktail. For each wash, the pellets were homogenized and then centrifuged again. RNAP was eluted by washing the pellets three times with 50 mM Tris–HCl pH 8.0, 1 M NaCl, 10 mM DTT, 5% w/v glycerol, 1× protease inhibitor cocktail and 1 mM PMSF. The PEI elutions were combined and precipitated overnight with ammonium sulfate at a final concentration of 35% w/v. The mixture was centrifuged, and the pellets were resuspended in 20 mM Tris–HCl pH 8.0, 1 M NaCl, 5% w/v glycerol and 1 mM β-mercaptoethanol (BME). The mixture was loaded onto two 5 ml HiTrap IMAC HP columns (Cytiva) for a total column volume of 10 ml. RNAP(β′-PPX-His10) was eluted at 250 mM imidazole in column buffer (20 mM Tris–HCl pH 8.0, 1 M NaCl, 5% w/v glycerol and 1 mM BME). The eluted RNAP fractions were combined and dialysed into 10 mM Tris–HCl pH 8.0, 0.1 mM EDTA pH 8.0, 100 mM NaCl, 5% w/v glycerol and 5 mM DTT. The sample was then loaded onto a 40 ml Bio-Rex-70 column (Bio-Rad), washed with 10 mM Tris–HCl pH 8.0, 0.1 mM EDTA, 5% w/v glycerol and 5 mM DTT in isocratic steps of increasing concentration of NaCl (eluted at 0.5 M NaCl). The eluted fractions were combined, concentrated by centrifugal filtration, then loaded onto a 320 ml HiLoad 26/600 Superdex 200 column (Cytiva) pre-equilibrated in gel filtration buffer (10 mM Tris–HCl pH 8.0, 0.1 mM EDTA pH 8.0, 0.5 M NaCl, 5% w/v glycerol and 5 mM DTT). The eluted RNAP was concentrated to ~8–10 mg ml−1 by centrifugal concentration, supplemented with glycerol to 20% w/v, flash frozen in liquid nitrogen and stored at −80 °C.
E. coli His10-SUMO (small ubiquitin-like modifier)-σ70
Plasmid pSAD1403 (ref. 61) was introduced into E. coli BL21(DE3). The cells were grown in the presence of 50 μg ml−1 kanamycin to an OD600 of ~0.6 at 37 °C. Protein expression was induced with 1 mM IPTG for 1–1.5 h at 30 °C. Cells were collected by centrifugation and resuspended in 20 mM Tris–HCl pH 8.0, 500 mM NaCl, 0.1 mM EDTA pH 8.0, 5 mM imidazole, 5% w/v glycerol, 0.5 mM BME, 1 mM PMSF and 1× protease inhibitor cocktail. After lysis by French press (Avestin) at 4 °C, cell debris was removed by centrifugation twice. The lysate was loaded onto two 5 ml HiTrap IMAC HP columns (Cytiva) for a total column volume of 10 ml. His10-SUMO-σ70 was eluted at 250 mM imidazole in 20 mM Tris–HCl pH 8.0, 500 mM NaCl, 0.1 mM EDTA pH 8.0, 5% w/v glycerol and 0.5 mM BME. Peak fractions were combined, cleaved with Ulp1 protease and dialysed against 20 mM Tris–HCl pH 8.0, 500 mM NaCl, 0.1 mM EDTA pH 8.0, 5% w/v glycerol and 0.5 mM BME, resulting in a final concentration of 25 mM imidazole. The cleaved sample was loaded onto one 5 ml HiTrap IMAC HP to remove His10-SUMO tag along with any remaining uncleaved σ70. Untagged σ70 fractions were pooled and diluted with 10 mM Tris–HCl pH 8.0, 0.1 mM EDTA pH 8.0, 5% w/v glycerol and 1 mM DTT until the conductivity corresponds to NaCl concentration slightly below 200 mM. The diluted sample was injected onto three 5 ml HiTrap Heparin HP columns (total column volume of 15 ml; Cytiva) which were pre-equilibrated at the same diluent buffer but with 200 mM NaCl, with a gradient to 1 M NaCl, with the first major peak as the target peak. The target peak sample was pooled and concentrated by centrifugal filtration before being loaded onto a HiLoad 16/60 Superdex 200 (Cytiva) which was pre-equilibrated in 20 mM Tris–HCl pH 8.0, 500 mM NaCl, 5% w/v glycerol and 1 mM DTT. Peak fractions of σ70 were pooled, supplemented with glycerol to a final concentration of 20% w/v, flash frozen in liquid nitrogen and stored at −80 °C.
Protein crystallization
Crystallization screens for both KorBΔN30ΔCTD–CTPγS and KorBΔN30ΔCTD–KorA–OA complexes were performed in sitting-drop vapour diffusion format in MRC2 96-well crystallization plates. Drops consisted of 0.3 μl precipitant solution and 0.3 μl protein complex with incubation at 293 K.
KorBΔN30ΔCTD–CTPγS
Purified His-tagged KorBΔN30ΔCTD was premixed at 20 mg ml−1 with 1 mM MgCl2 and 1 mM CTPγS in buffer containing 10 mM Tris–HCl and 150 mM NaCl, pH 8.0. The KorBΔN30ΔCTD–CTPγS crystals grew in a solution containing 160 mM LiOAc and 2.0 M ammonium sulfate. Suitable crystals were cryoprotected with 20% (v/v) ethylene glycol and mounted in Litholoops (Molecular Dimensions). Crystals were flash-cooled by plunging into liquid nitrogen.
KorBΔN30ΔCTD–KorA–OA
Purified His-tagged KorBΔN30ΔCTD was combined with purified His-tagged KorA in equimolar concentrations before being purified by gel filtration as described above. The protein complex was premixed at 20 mg ml−1 with a 14 bp dsDNA (OA, TGTTTAGCTAAACA) at a molar ratio 1:1.2 (protein complex to DNA) in buffer containing 10 mM Tris–HCl and 150 mM NaCl, pH 8.0. Crystals grew in a solution containing 1.95 M ammonium sulfate and 0.1 M NaOAc, pH 4.6. Suitable crystals were cryoprotected with 25% (v/v) glycerol and mounted in Litholoops (Molecular Dimensions). Crystals were flash-cooled by plunging into liquid nitrogen.
Structure determination and refinement
X-ray data were recorded either on beamline I04-1 or beamline I03 at the Diamond Light Source using either an Eiger2 XE 9M or an Eiger2 XE 16M hybrid photon counting detector (Dectris), respectively, with crystals maintained at 100 K by a Cryojet cryocooler (Oxford Instruments). Diffraction data were integrated and scaled using DIALS (v. 3)62 via the XIA2 (v. 3.9.dev0) expert system62 then merged using AIMLESS (v. 0.7.7)63. The majority of the downstream analysis was performed through the CCP4i2 (v. 7.1.018) graphical user interface64. MolProbity (v. 4.4) was additionally used for validation of 3D atomic models. Data collection statistics are summarized in Supplementary Table 5.
X-ray data for KorBΔN30ΔCTD–CTPγS were collected from a single crystal at a wavelength of 0.9179 Å and processed to 2.3 Å resolution in space group P212121, with approximate cell parameters of a = 58.7, b = 152.8 and c = 198.3 Å. Analysis of the likely composition of the asymmetric unit suggested that it could contain between four and eight copies of the KorB subunit with an estimated solvent content in the range of 43–72%.
Structural predictions for KorB were generated using AlphaFold2 (AF2)65, as implemented through ColabFold66. There was good sequence coverage, and the predicted local distance difference test (pLDDT) scores were generally good (for example, average of 85 from the rank 1 prediction). For a single subunit simulation, the predicted aligned error scores indicated a two-domain structure with very low confidence in the relative placement of the two domains, while for a dimer simulation, the predicted aligned error scores suggested high confidence in the relative placement of all four domains. Consistent with this, all five independently generated models were closely superposable.
The KorBΔN30ΔCTD–CTPγS complex structure was solved via molecular replacement using PHASER67. A dimer template was prepared from the rank 1 AF2 model using the ‘Process Predicted Models’ CCP4i2 task, which removed low-confidence regions (based on pLDDT) and converted the pLDDT scores in the B-factor field of the PDB coordinate files to pseudo B factors. Initial attempts used an isomorphous dataset at 3.25 Å resolution. After much trial and error, searching with separate templates corresponding to the two KorB domains showed the most promise. PHASER (v. 2.8.3) produced a partial solution where three pairs of domains were juxtaposed such that they could be connected into single subunits using COOT (v. 0.9.6)68. One of the latter was then used as the template for a subsequent run, where PHASER placed five of these in the asymmetric unit (ASU), which were arranged as two dimers and a single subunit. Inspection of this solution in COOT revealed residual electron density adjacent to the latter which could be filled by a sixth subunit by extrapolation from one of the dimers. This final composition of six protomers per ASU gave an estimated solvent content of 57%. When the 2.3 Å resolution dataset became available, the preliminary model was refined directly against this in REFMAC5 (v. 5.8.0403)69. At this stage, residual electron density at the interface between the NTDs of each dimer indicated the presence of two symmetry-related ligands. These were built as CTP molecules, as it was not possible to define the locations of the sulfur atoms of CTPγS. The model was completed through several iterations of model building in COOT and restrained refinement in REFMAC5. Pairwise superpositions of the three dimers gave overall r.m.s. deviations of 0.63–1.18 Å, indicating that they were closely similar. Comparison against the AF2 dimer model showed that this experimental structure had a domain-swapped arrangement, while the predicted structure did not. Refinement and validation statistics are summarized in Supplementary Table 5.
X-ray data for KorBΔN30ΔCTD–KorA–OA were collected from a single crystal at a wavelength of 0.9763 Å (2 × 360° passes) and processed to 2.7 Å resolution in space group C2, with approximate cell parameters of a = 173.2, b = 77.1, c = 84.6 Å and β = 107.4°. Analysis of the likely composition of the asymmetric unit suggested that it contained a single complex comprising two copies of each of the KorA and KorB subunits and a single DNA duplex, giving an estimated solvent content of 61%.
The structure was solved via molecular replacement using PHASER. Separate templates were prepared for the two KorB domains from the A chain of the above KorBΔN30ΔCTD–CTPγS complex, for the KorA subunit by taking a single chain from the previously solved KorA–DNA complex (PDB code 2W7N)70 and for the DNA by generating an ideal B-form DNA duplex in COOT from the palindromic sequence TGTTTAGCTAAACA. PHASER was able to locate the four domains expected for a KorB dimer and the DNA duplex, but not the two KorA subunits. However, after refinement in REFMAC5, a clear difference density was visible for the missing KorA subunits. These could be manually placed from a superposition of the KorA–DNA complex. Several sulfates were built into the density, presumably derived from the precipitant. Two of these occupied positions equivalent to the β-phosphates of the CTP ligands in the previous structure. The model was completed through several iterations of model building in COOT and restrained refinement in REFMAC5. In contrast to the KorB dimer from the CTP complex, this dimer does not have a domain-swapped architecture. Moreover, a superposition of this KorB dimer onto the AF2 dimer model revealed that they were almost identical at the protein backbone level, giving an overall r.m.s. deviation of only 1.01 Å. Refinement and validation statistics are summarized in Supplementary Table 5.
DNA preparation for in vitro NTPase, crosslinking and ITC experiments
Palindromic single-stranded DNA oligonucleotides (OB, GGGATATTTTAGCGGCTAAAAGGA; OA, TGTTTAGCTAAACA) (100 µM in 1 mM Tris–HCl pH 8.0, 5 mM NaCl buffer) were heated at 98 °C for 5 min before being left to cool down to room temperature overnight to form 50 µM dsDNA. The core sequence of OB or OA is underlined.
Measurement of CTPase activity by EnzChek phosphate release assay
CTP hydrolysis was monitored using an EnzCheck Phosphate Assay Kit (Thermo Fisher Scientific). Samples (100 µl) containing a reaction buffer supplemented with an increasing concentration of CTP (1, 5, 10, 50, 100, 500 and 1,000 µM), 0.5 µM of 24 bp OB DNA, and 1 µM dimer concentration of KorB (WT or mutants) were assayed in a CLARIOstar Plus plate reader (BMG Labtech) at 25 °C for 5 h with readings every 2 min with continuous orbital shaking at 300 r.p.m. between reads. The reaction buffer (1 ml) typically contained 740 μl ultrapure water, 50 μl 20× reaction buffer (100 mM Tris–HCl, 2 M NaCl and 20 mM MgCl2, pH 8.0), 200 μl 2-amino-6-mercapto-7-methylpurine riboside (MESG) substrate solution and 10 μl purine nucleoside phosphorylase enzyme (one unit). Reactions with buffer only or buffer + CTP + 24 bp OB DNA only were also included as controls. The inorganic phosphate standard curve was also constructed according to the instruction guidelines. The results were analysed using Excel (v. 16.92) and plotted in GraphPad Prism (v. 9.5.1). The CTPase rates were calculated using a linear regression fitting in GraphPad Prism 9. Error bars represent standard deviations from triplicate experiments.
In vitro crosslinking assay using a sulfhydryl-to-sulfhydryl crosslinker BMOE
A 50 µl mixture of 8 µM dimer concentration of KorB WT or mutants ± 1 mM NTP ± 0.5 µM 24 bp dsDNA containing OB or scrambled OB was assembled in a reaction buffer (10 mM Tris–HCl pH 7.4, 100 mM NaCl and 1 mM MgCl2) and incubated for 5 min at room temperature. BMOE was added to a final concentration of 1 mM, and the reaction was quickly mixed by three pulses of vortexing. The reaction was then immediately quenched through the addition of SDS–PAGE sample buffer containing 23 mM BME. Samples were heated to 50 °C for 5 min before being loaded on 12% Novex WedgeWell Tris-Glycine gels (Thermo Fisher Scientific). Protein bands were stained with an InstantBlue Coomassie protein stain (Abcam), and band intensity was quantified using ImageJ (v. 2.14.0/1.54f). The results were analysed in Excel and plotted using GraphPad Prism 9.
For the experiments containing KorA in addition to KorB, an equimolar amount was used (8 µM of WT or mutants, dimer concentration). The reaction was otherwise assembled identically and loaded on 4–20% Novex WedgeWell Tris-Glycine gels (Thermo Fisher Scientific) for sufficient separation of KorA in the samples. Band intensity was quantified using ImageJ, and the results were analysed in Excel and plotted using GraphPad Prism 9.
ITC
All ITC experiments were recorded using a MicroCal PEAQ ITC instrument (Malvern Panalytical). Experiments were performed at 25 °C. For protein–nucleotide binding experiments, all components were in 10 mM Tris–HCl, 150 mM NaCl and 5 mM MgCl2, pH 8.0 buffer. For protein–protein binding experiments, all components were in 10 mM Tris–HCl and 150 mM NaCl, pH 8.0 buffer. For each ITC run, the calorimetric cell was filled with 20 μM dimer concentration of KorB (WT or mutant), and a single injection of 0.4 μl of 500 μM small-molecule nucleotides or 200 μM protein partner was performed first, followed by 19 injections of 2 μl each. Injections were carried out at 150 s intervals with a stirring speed of 750 r.p.m. The raw titration data were integrated and fitted to a one-site binding model using the built-in software of the MicroCal PEAQ ITC instrument. Each experiment was run in duplicate. Controls of ligand into buffer and buffer into protein were performed with no signal observed. Where required, representative data are presented.
xylE reporter gene assays
Reporter gene assays were carried out using a modified version of ref. 71. In short, E. coli DH5α cells containing relevant expression plasmids were grown to a logarithmic phase from a 1:100 dilution of overnight culture. Induction of KorB WT/mutant expression was achieved with 0.2% (PkorA; Fig. 5e) and 0.02% (PtrbB; Fig. 3) arabinose. In the three plasmid experiments, induction of KorA WT/Y84A required no additional IPTG. About 10 or 50 ml of culture was pelleted and resuspended in 500 μl resuspension buffer (0.1 M sodium phosphate buffer pH 7.4, 10% v/v acetone). From this point onwards, samples were kept on ice. Cells were disrupted using sonication at 10 µm for 10 s and subsequently pelleted. The supernatant was transferred to a fresh microcentrifuge tube and assayed for catechol 2,3-oxygenase activity. Samples were diluted 1:10 in reaction buffer (0.1 M sodium phosphate buffer pH 7.4, 200 μM catechol) and incubated at room temperature for 1 min before the absorbance at 374 nm was determined using a BioMate 3 spectrophotometer (Thermo Fisher Scientific). Protein concentration, determined using Bradford assay, was used to normalize the samples. The results were analysed in Excel and plotted using GraphPad Prism 9.
Immunoblot analysis
For western blot analysis samples, 200 ng total protein lysate was resuspended in 1× SDS–PAGE sample buffer and heated to 95 °C for 10 min before loading. Denatured samples were run on 12% Novex WedgeWell gels (Thermo Fisher Scientific) at 150 V for 55 min. Resolved proteins were transferred to PVDF membranes using the Trans-Blot Turbo Transfer System (BioRad) and incubated with a 1:5,000 dilution of α-KorB primary antibody (Cambridge Research Biochemicals) or with 1:300 dilution of α-KorA. Membranes were washed and subsequently probed with a 1:10,000 dilution of mouse α-rabbit HRP-conjugated secondary antibody (Abcam). Blots were imaged after incubation with SuperSignal West PICO PLUS Chemiluminescent Substrate (Thermo Fisher Scientific) using an Amersham Imager 600 (GE HealthCare). Loading controls of denatured 200 ng total protein lysate were run on 12% Novex WedgeWell gels (Thermo Fisher Scientific) at 150 V for 55 min and stained with InstantBlue Coomassie protein stain (Abcam).
Protein labelling with Alexa Fluor for confocal optical tweezers (C-trap) experiments
C-terminally His-tagged versions of KorB (A6C) and KorA (WT/Y84A variant) with an extra cysteine residue at the C-terminus were coupled to maleimide-conjugated Alexa Fluor (AF) 488 and 647, respectively. A6C was selected because it resides in a surface-exposed intrinsically disordered region at the N-terminal region of KorB. His-tagged KorB (A6C) and His-tagged KorA-extra C were purified as described for the WT proteins. About 250 µl of 50 µM KorB (A6C) or KorA-extra C were incubated with 0.3 mM tris-carboxyethyl phosphine for 30 min at room temperature in a buffer containing 10 mM Tris–HCl and 300 mM NaCl, pH 7.4. Subsequently, 6 µl of 30 mM AF488 or AF647 (dissolved in DMSO) was added, and the reaction was incubated with rotation at 4 °C overnight. The conjugate solution was then loaded onto a Superdex increase 200 pg 10/300 gel filtration column (pre-equilibrated with 10 mM Tris–HCl, 300 mM NaCl, pH 8.0) to separate labelled KorB/A from unincorporated fluorophore. AF-labelled KorB/A was pooled and concentrated before storage as described for WT KorB and KorA.
Design and construction of a DNA plasmid with 16×OB sites and 1×OA site for magnetic tweezers experiments
A DNA plasmid containing 16×OB sites (ATTTTAGCGGCTAAAAG) and 1×OA site (AATGTTTAGCTAAACCTT) was produced by modification of a pUC19 plasmid containing a single copy of each site separated by 1,016 bp (pUC19_v1), following several cloning steps and methods described elsewhere29,72.
First, the original pUC19 plasmid (4,886 bp) with one of each site was enlarged by introducing a piece of DNA obtained from a lab plasmid. This resulted in a larger plasmid (7,699 bp) which, after digestion with appropriate restriction enzymes, produces the central part of a magnetic tweezers DNA construct with centred OB and OA sites.
To increase the number of OB sites, two long oligonucleotides (Supplementary Table 4) containing 2×OB sites separated by 40 bp with a PshAI restriction site in the middle of this region were annealed by heating at 95 °C for 5 min and cooling down to 20 °C at a rate of −1 °C min−1 in hybridization buffer (10 mM Tris–HCl pH 8.0, 1 mM EDTA, 200 mM NaCl and 5 mM MgCl2) followed by a phosphorylation step of the 5′-terminal ends by the T4 PNK (NEB). This dsDNA duplex was ligated into the previous plasmid of 7,699 bp that already contained 1×OA and 1×OB sites digested with PshAI restriction enzyme (NEB) and dephosphorylated. These oligonucleotides were designed to lose the original PshAI site at both ends after ligation, so that once ligated into a cloning plasmid they could not be cleaved again by PshAI. The single bona fide PshAI site located in the middle of the duplex allows for repetition of the ligation process to be repeated as many times as desired in the cloning plasmid to add new pairs of OB sites. Plasmids containing 1×OA site and up to 8×OB have been obtained following this procedure. Note that in one of the rounds of cloning and by chance, half of a previous duplex was lost during the ligation process, and therefore the final plasmid contains 8×OB instead of 9×OB as expected.
A plasmid with 1×OA site and 16×OB was produced by PCR amplifying an 8×OB cassette with Phusion High-Fidelity DNA Polymerase (Thermo Scientific) (see Supplementary Table 4 for primer sequences). The PCR fragment was then digested with SpeI and XhoI (both from NEB) and ligated into the plasmid already containing 1×OA site and 8×OB copies previously digested with XbaI (NEB) and XhoI and dephosphorylated. This resulted in a plasmid with 1×OA site and 16×OB sites (8,705 bp). Plasmids were introduced into E. coli DH5α competent cells, and potentially positive colonies were then selected by colony PCR. Plasmids were purified from the cultures using a QIAprep Spin Miniprep Kit (QIAGEN), analysed by restriction enzyme digestion and finally verified by Sanger sequencing. This plasmid was subsequently used to produce a magnetic tweezers dsDNA construct.
Construction of large plasmids with different combinations of OB and OA sites for confocal optical tweezers (C-Trap) experiments
C-Trap experiments were performed on three types of molecule: one containing only a single copy of the OA site without any OB site and two different versions containing 1×OA or 2×OA sites together with 8×OB sites. Therefore, different large plasmids were cloned. First, a large DNA plasmid with 1×OA site was fabricated by ligating a DNA fragment containing a single copy of the OA site into a previously prepared large plasmid in our laboratory that did not contain either of these sites. The fragment containing the OA site was obtained by PCR amplification using Phusion High-Fidelity DNA Polymerase with the pUC19 plasmid containing a single copy of the OB and OA sites as a template (see Supplementary Table 4 for sequences of oligonucleotides). The PCR fragment was digested with KpnI (NEB) and ligated into the previously large plasmid prepared in our laboratory that did not contain either of these sites, digested with KpnI and dephosphorylated. This resulted in a large plasmid with a single OA site (20,985 bp). A DNA fragment with 8×OB sites was then inserted over this new large plasmid. The 8×OB fragment was obtained by PCR amplification (see Supplementary Table 4 for sequences of oligonucleotides) using Phusion High-Fidelity DNA Polymerase with the magnetic tweezers plasmid that contained 1×OA and 8×OB sites as a template. The PCR fragment was digested with SpeI and XbaI and ligated into the large plasmid, which already contained 1×OA site, digested with XbaI and dephosphorylated, resulting in a large plasmid with 1×OA site and 8×OB sites (22,394 bp). The large DNA plasmid containing 8×OB sites and 2×OA sites (22,733 bp) was produced by inserting a new copy of the OA site into the previously described plasmid digested with NruI (NEB). A new 339 bp dsDNA fragment with a copy of the OA site was obtained by digestion of the pUC19 plasmid containing a single copy of the OB and OA sites with SfoI and HpaI (NEB). The dsDNA fragment was gel extracted, purified and ligated into the NruI-linearized large plasmid described before. The plasmids were cloned and analysed as described before for magnetic tweezers plasmids, looking for a final plasmid with the new OA site in the same orientation as the previous one. These plasmids were subsequently used to prepare various C-Trap dsDNA constructs.
Magnetic tweezers dsDNA construct with 16×OB and 1×OA sites
The dsDNA construct for magnetic tweezers experiments consisted of a central dsDNA fragment of 8,693 bp containing 16×OB and 1×OA sites, obtained by digestion with NotI and ApaI (NEB) of the final magnetic tweezers plasmid described above, flanked by two highly labelled DNA fragments, one with digoxigenins and the other with biotins, of 997 bp and 140 bp, respectively, used as immobilization handles. The biotinylated handle was shorter to minimize the attachment of two beads per DNA tether. Handles for magnetic tweezers constructs were prepared by PCR (see Supplementary Table 4 for sequences of oligonucleotides) with 200 µM final concentration of each dNTP (dGTP, dCTP, dATP), 140 µM dTTP and 66 µM Bio-16-dUTP or Dig-11 dUTP (Roche) using plasmid pSP73-JY0 (ref. 73) as template, followed by digestion with the restriction enzyme ApaI or PspOMI (NEB), respectively. Labelled handles were ligated to the central part overnight using T4 DNA Ligase (NEB). The sample was then ready for use in magnetic tweezers experiments without further purification. The DNAs were never exposed to intercalating dyes or UV radiation during their production and were stored at 4 °C. The sequence of the central part of the magnetic tweezers construct is included in Supplementary Table 6.
C-Trap dsDNA constructs with different combinations of OB and OA sites
C-Trap experiments were performed on three types of molecule: one containing a single copy of the OA site without any OB sites and two different versions containing 1×OA or 2×OA sites together with 8×OB sites. The C-Trap dsDNA construct consisting of a large central fragment of 22,394 bp containing 8×OB and 1×OA sites was produced by digestion of the large C-trap plasmid with NotI. Without further purification, the fragment was ligated to highly biotinylated handles of ~1 kbp ending in PspOMI. Handles for C-Trap constructs were prepared by PCR (see Supplementary Table 4 for sequences of oligonucleotides) as described for biotin-labelled magnetic tweezers handles. These handles were highly biotinylated to facilitate the capture of DNA molecules in the C-Trap experiments. As both sides of the DNA fragment end in NotI, it is possible to generate tandem (double length) tethers flanked by the labelled handles. The sample was ready for use in C-Trap experiments without further purification. The dsDNA constructs with 8×OB and 2×OA sites (22,733 bp) or with only a 1×OA site (20,985 bp) were equally prepared, but they were obtained by digestion with NotI of the other large C-Trap plasmids described above: the one with 8×OB and 2×OA sites or the one with a single copy of the OA site without any OB sites, respectively. The DNAs were not exposed to intercalating dyes or UV radiation during their production and were stored at 4 °C. The sequence of the central part of the C-Trap construct is included in Supplementary Table 6.
Confocal optical tweezers experiments
Confocal optical tweezers experiments were carried out using a dual optical tweezers set-up combined with confocal microscopy and microfluidics (C-Trap; Lumicks)74,75. A computer-controlled stage allowed rapid displacement of the optical traps within a five-channel fluid cell, allowing the transfer of the tethered DNA between different channels separated by laminar flow. Channel 1 contained 4.38 µm streptavidin-coated polystyrene beads (Spherotech). Channel 2 contained the DNA substrate labelled with multiple biotins at both ends. Both DNA and beads were diluted in 20 mM HEPES pH 7.8, 100 mM KCl and 5 mM MgCl2. A single DNA tether was assembled by first capturing two beads in channel 1, one in each optical trap, and fishing for a DNA molecule in channel 2. The tether was then transferred to channel 3 filled with reaction buffer (10 mM Tris pH 8, 100 mM NaCl, 5 mM MgCl2 and 1 mM DTT) to verify the correct length of the DNA by force–extension curves. The DNA was then incubated for 1 min in channel 4 filled with KorB and/or KorA proteins in reaction buffer and supplemented with 2 mM CTP as indicated. To reduce the fluorescence background in single KorB diffusion measurements, imaging was occasionally performed in channel 3 after protein incubation in channel 4 (as indicated in figure legends). All the fluorescence intensities in kymograms were normalized, and the scales in the intensity profiles were adjusted for better visualization. Scale bars in figures represent fluorescence intensity on the kymographs.
The system is equipped with three laser lines for confocal microscopy (488, 532 and 635 nm). In this study, the 488 nm laser was used to excite AF488–KorB and the 635 nm laser to excite AF647–KorA, with emission filters of 500–525 nm and 650–750 nm, respectively. Protein-containing channels were passivated with BSA (0.1% w/v in PBS) for 30 min before the experiment. Kymographs were generated by single line scans between the two beads using a pixel size of 100 nm and a pixel time of 0.1 ms, resulting in a typical time per line of 22.4 ms. The confocal laser intensity at the sample was 2.2 µW for the 488 laser and 1.92 µW for the 635 laser. Experiments were performed in constant-force mode at 15 pN.
Magnetic tweezers experiments
Magnetic tweezers experiments were performed using a homemade set-up that was previously described76,77. Briefly, optical images of micron-sized superparamagnetic beads tethered to a glass surface by DNA substrates were acquired using a ×100 oil immersion objective and a CCD camera operating at 120 Hz. Real-time image analysis allows the spatial coordinates of the beads to be determined with nanometre accuracy in the x, y and z directions. We controlled the stretching force of the DNA by using a step motor coupled to a pair of magnets located above the sample. The applied force is quantified from the Brownian motion of the bead and the extension of the tether, obtained by direct comparison of images taken at different focal planes78,79.
Magnetic tweezers experiments were performed as follows. The DNA sample containing 16×OB sites was diluted in 10 mM Tris–HCl pH 8.5 and 1 mM EDTA and mixed with 1-µm-diameter magnetic beads (Dynabeads, MyOne Streptavidin, Invitrogen) for 10 min. Magnetic beads were previously washed three times with PBS and resuspended in PBS/BSA at a 1:10 dilution. The DNA to bead ratio was adjusted to obtain as many single-tethered beads as possible. After incubation, we introduced the DNA–bead sample in a double-PARAFILM (Sigma)-layer flow cell and allowed them to sink for 10 min to promote the binding of the digoxigenin (DIG)-labelled end of the DNA to the anti-DIG glass-coated surface. Then, a force of 5 pN was applied to remove non-attached molecules from the surface. The chamber was washed with ~500 µl of PBS before experiments. Torsionally constrained molecules and beads containing more than a single DNA molecule were identified from their distinct rotation–extension curves and discarded for further analysis. Force–extension curves were generated by measuring the extension of the tethers at decreasing forces from 5.5 pN to 0.002 pN. The curves were first measured on naked DNA molecules, and then the experiment was repeated using different concentrations of B. subtilis ParB and KorB ± KorA in a reaction buffer (10 mM Tris pH 8, 100 mM NaCl, 5 mM MgCl2, 1 mM DTT and 0.1 mg ml−1 BSA) supplemented with 2 mM CTP. Data were analysed and plotted using OriginPro (v. 2022b) software.
Construction of PkorA and PkorA:λP
R linear scaffolds
The plasmid pUC19::146-bp-PkorA was used as a template to amplify a 146 bp linear PkorA DNA scaffold using primers 5′-AGACGAAAGCCCGGTTTCCGGG-3′ and 5′-CTCCGCGCCTTGGTTGAACATAG-3′ in a PCR reaction with Taq DNA polymerase (Promega) at an annealing temperature of 65 °C (Supplementary Table 4). The correct band was gel extracted from a 2% w/v agarose gel and eluted into TE buffer. The plasmid (pUC19-146-bp-PkorA:λPR) was similarly used as a template to amplify a linear 146 bp PkorA:λPR DNA scaffold (Supplementary Table 1).
Construction of a PkorA linear scaffold for nMS
The PkorA sequence was shortened to its minimal elements as a 100 bp DNA scaffold and synthesized as separate PAGE-purified top and bottom strand oligos (IDT) (Supplementary Table 6). The two strands were resuspended separately to 1 mM solutions in 10 mM Tris–HCl pH 8.0, 50 mM NaCl and 1 mM EDTA, pH 8.0. The strands were mixed in a 1:1 molar ratio for a 500 μM dsDNA (final concentration) and were heated to 95 °C before being cooled down to 25 °C in a 1 °C stepwise decrease using a Thermocycler PCR machine (Eppendorf). The resulting dsDNA was assayed by 2% w/v agarose gel electrophoresis for purity and was quantified using a Qubit (Invitrogen) dsDNA broad-range quantification kit.
Construction of a promoter bubble DNA for half-life abortive initiation assays
An ideal promoter bubble DNA (generated with a non-complementary intervening sequence) was used as a competitor DNA for the in vitro half-life abortive initiation assays (Supplementary Table 6)80. The top and bottom strands were synthesized and annealed as described for WT PkorA 100-bp DNA scaffold used in nMS.
Electrophoretic mobility shift assays
To check for E. coli Eσ70 binding to the PkorA DNA scaffolds, 50 nM of PkorA DNA scaffold was mixed with 50 nM E. coli Eσ70 and incubated at 37 °C for 5 min. In all biochemical experiments except nMS, Eσ70 was assembled by incubating E. coli His10–PPX–RNAP with a fivefold molar excess of σ70 at 37 °C for 15 min (excess σ70 was not purified away). The Eσ70–DNA sample was then loaded onto a 4.5% native Tris–borate–EDTA (90 mM TBE pH 8.3) polyacrylamide gel and run at a constant current of 15 mA for 1.5 h at 5–10 °C in a cold room. The gel was stained for dsDNA using GelRed (Biotium).
In vitro abortive initiation assay for transcription initiation repression
To assay for transcription initiation repression, we monitored levels of abortive initiation RNA products in an NTP-restricted in vitro promoter-based transcription reaction. The 146 bp WT PkorA and PkorA:λPR discriminator linear DNA scaffolds were used to assay KorA and KorB-mediated repression on WT and mutant DNA-derived transcription, respectively. E. coli Eσ70 was assembled as described for electrophoretic mobility shift assays. The transcription buffer consists of 50 mM Tris–HCl pH 8.0, 10 mM MgCl2, 150 mM KCl, 0.1 mg ml−1 BSA and 1 mM DTT. Assembly of protein–DNA mixes before the addition of NTP mix involved a sequential incubation of DNA (10 nM), E. coli Eσ70 (50 nM) and KorAB factors (250 nM; and saturating CTP where relevant) at 37 °C in 5 min incubations. NTP mix (50 μM GTP, 250 μM ApU dinucleotide, 0.05 μCi per μl reaction volume of α-32P-GTP (PerkinElmer)) was added once all factors were added and incubated for 10 min at 37 °C to synthesize one abortive RNA band (5′-ApUpG*-3′; +1 to +3 RNA). Reactions were quenched using a 2× STOP buffer (45 mM TBE pH 8.3, 8 M urea, 30 mM EDTA pH 8.0, 0.05% w/v bromophenol blue and 0.05% w/v xylene cyanol). Reaction samples were analysed on a 23% denaturing PAGE (19:1 acrylamide to bis-acrylamide, 90 mM TBE pH 8.3, 6 M urea) for 1.5–2 h at a constant voltage of 800 V, and the gel was exposed to a storage phosphor screen for 1–2 h and imaged using a Typhoon Phosphorimager (Cytiva). Band intensities were quantified on ImageJ81, with measured values subtracted of the background and normalized to an E.coli Eσ70–DNA only control (no repression) for values to be averaged among replicates (n of at least 3 in all repression conditions). Repression as percentage values was calculated as (1-normalized intensity) × 100%, graphed and statistically analysed in GraphPad Prism using unpaired Welch’s t-tests.
In vitro abortive initiation assay for half-life estimation
To estimate half-lives of E. coli Eσ70-open promoter complexes on both the WT and mutant PkorA DNA scaffolds, we adapted the in vitro abortive initiation assay by including a competitor DNA to compete with the promoter DNA of interest. In this setup, the assay is similar to the previous abortive initiation assay80, except that competitor DNA is added in the beginning, and NTP mix is added afterwards at several varying timepoints. Eσ70 was incubated in transcription buffer for 5 min at 37 °C before adding promoter DNA scaffold and incubated for another 15 min at 37 °C. This formed a master mix to which competitor DNA (100 nM final concentration) was added (t = 0 s was transcribed as a separate reaction) and was incubated at 37 oC throughout. Aliquots were taken out at desired time points (t = 0, 1, 2, 5, 10, 30, 45, 60 min), to which NTP mix was added to start transcription of abortive RNAs. In this way, abortive RNA production is a proxy for the proportion of open promoter complexes remaining as time goes on, as Eσ70 that dissociates from the promoter binds to the ideal bubble competitor DNA and does not easily dissociate (re-binding to the PkorA scaffold is thereby negligible). Quantification of abortive RNA bands was the same as performed for the repression assays80. Plots of normalized band intensities against time resulted in a double exponential curve, with the slow-decaying component (that is, basal noise-level signal) dominating at time points with low fractions of competitor-resistant open promoter complexes. Due to the rapid decline in WT PkorA open complexes, a correction was applied by subtracting values that occur at t ≥ 30 min to remove the slow-decaying component and derive the true half-life from the fast decay as a single exponential decay curve. This correction was not applied to PkorA:λPR discriminator open complex values as the time points measured did not decline to noise-level signal.
The plots were presented on a semi-log scale, with the fraction of competitor-resistant open promoter complexes on a log10 scale and time on a linear scale, with single exponential decay trend lines fitted (WT PkorA with R2 = 0.7637; PkorA:λPR discriminator with R2 = 0.9934). Analysis and plotting were performed using Microsoft Excel (v. 16.92) and GraphPad Prism (v. 9.5.1).
Preparation of E. coli Eσ70 holoenzyme for nMS
Eσ70 was formed by mixing purified His10–PPX–RNAP and a 2.5-fold molar excess of σ70 and incubated for 15 min at 37 °C. Eσ70 was buffer exchanged into 20 mM Tris–HCl pH 8.0, 500 mM NaCl and 5 mM DTT (to remove most glycerol from protein storage buffer) by centrifugal filtration and purified on a Superose 6 Increase 10/300 GL column (Cytiva) pre-equilibrated in 50 mM Tris–HCl pH 8.0, 150 mM KCl, 10 mM MgCl2 and 1 mM DTT. The eluted Eσ70 was concentrated to ~10–12 mg ml−1 (~21–26 μM) by centrifugal filtration. Purified Eσ70 was supplemented with glycerol to a final concentration of 20% w/v, flash frozen in liquid nitrogen and stored at −80 °C.
nMS analysis
Frozen samples were thawed and reconstituted in various combinations. Sample concentrations for conditions without Eσ70 used 2 μM WT PkorA DNA and 5 μM KorA/B factors. For conditions with Eσ70, the sample contained 5 μM Eσ70, 5.5 μM WT PkorA DNA and 2.5-fold molar excess (12.5 μM) of KorA/B factors. For KorB samples with CTP, 0.5 mM CTP was used to ensure saturation of KorB.
For nMS analysis, samples were buffer exchanged into either 150 mM, 300 mM or 500 mM ammonium acetate pH 7.5, 0.01% Tween-20 using Zeba microspin desalting columns with a 7 kDa or 40 kDa molecular weight cut-off (Thermo Scientific). A 2–3 µl aliquot of the sample was then loaded into a gold-coated quartz capillary tip that was prepared in-house and then electrosprayed into an Exactive Plus with extended mass range instrument (Thermo Fisher Scientific) with a static direct infusion nanospray source82. The typical MS parameters for all samples included the following: spray voltage, 1.20–1.22 kV; capillary temperature, 125–150 °C; in-source dissociation, 0–10 V; S-lens RF level, 200; resolving power, 8,750 at m/z of 200; automatic gain control target, 1 × 10⁶; maximum injection time, 200 ms; number of microscans, 5; total number of scans, at least 100. Additional specific nMS parameters were injection flatapole, 8 V; interflatapole, 4 V; bent flatapole, 4 V; high-energy collision dissociation, 150–200 V; ultrahigh vacuum pressure, 5.2–5.8 × 10⁻¹⁰ mbar. Mass calibration in positive extended mass range mode was performed using cesium iodide. For data processing, the collected nMS spectra were visualized using Thermo Xcalibur Qual Browser (v. 4.2.47). Spectral deconvolution was performed using UniDec v. 4.2.083,84 with the following general parameters: for background subtraction (if applied), subtract curve 10; smooth charge state distribution, enabled; peak shape function, Gaussian; degree of Softmax distribution (beta parameter), 10–20.
The expected masses for the component proteins of the Eσ70 include α, 36,511.7 Da; β, 150,632.2 Da; β′, 158,008.1 Da (includes one Mg2+ and two Zn2+ ions); ω (lost N-terminal methionine), 10,105.4 Da; and σ70, 70,263.3 Da. The expected masses for the Kor proteins and the DNA scaffold used are KorA monomer, 12,825.6 Da; KorB (lost N-terminal methionine), 40,399.6 Da; and PkorA dsDNA, 61,667.2 Da. The observed mass deviations (calculated as the percentage difference between the measured and expected masses relative to the expected mass) ranged from 0.001% to 0.3% with a typical mass deviation of 0.12%.
Determination of plasmid copy number by deep sequencing
Cell cultures for deep sequencing were grown in the same conditions as for promoter–xylE reporter assays. Cells from 5 ml of these cultures were resuspended in 300 µl of Puregene cell lysis solution (Qiagen) before incubation at 50 °C for 10 min. About 2 µl of 20 mg ml−1 RNaseA was added, and the samples were mixed by inverting 25 times before incubation at 37 °C for 60 min. The samples were cooled to room temperature, and 100 µl of Puregene protein precipitation solution (Qiagen) was added. Samples were briefly vortexed and incubated on ice for 10 min, and protein precipitate was removed via centrifugation at 17,000 g for 10 min. The supernatant was transferred to a fresh microcentrifuge tube containing 600 µl of isopropanol and mixed by inverting 50 times. Precipitated DNA was pelleted via centrifugation, and the pellet was washed with 600 µl of 70% ethanol before final centrifugation at 17,000 g for 1 min. The supernatant was carefully removed, and the DNA pellet was resuspended in 100 µl of distilled water.
Illumina sequencing libraries were prepared using the tagmentation-based and PCR-based Illumina DNA Prep kit and custom IDT 10 bp unique dual indices with a target insert size of 280 bp. No additional DNA fragmentation or size selection steps were performed. The DNA samples were sequenced using 200 Mb Illumina whole-genome sequencing on an Illumina NovaSeq X Plus system (SeqCenter). Sequencing data were mapped back to a reference genome (constructed by concatenating the sequence of the E. coli DH5α genome and the sequences of the promoter–xylE reporter and those of korA and/or korB expression plasmids) using Bowtie 2 on default settings as part of the Galaxy open source platform85,86. Count read coverage per base was calculated using the Perbase command line package (https://github.com/sstadick/perbase) using the following command: perbase only-depth *.bam > output.csv. Using Python (v. 3.11.8), the reads were normalized, and the average read coverage of the chromosome and plasmids was used to calculate the plasmid copy number per chromosome for each sample. Data were subsequently analysed and plotted using GraphPad Prism 9.
Statistics and reproducibility
Experiments were performed in triplicates unless stated otherwise. No statistical method was used to pre-determine the sample size. No data were excluded from the analysis. Details of statistical tests and the P values are reported in the legends of relevant figures.
Reporting summary
Further information on research design is available in the Nature Portfolio Reporting Summary linked to this article.

Responses