Large-scale empirical study of electric vehicle usage patterns and charging infrastructure needs

Introduction
Climate change is one of our time’s most pressing challenges, with anthropogenic activities widely acknowledged as a primary driver1. Among these activities, the transportation sector significantly contributes to global carbon emissions. Fossil-fuel-based internal combustion engine vehicles (ICEVs) release substantial amounts of carbon dioxide and other greenhouse gases (GHGs), exacerbating the greenhouse effect and fueling climate change. Governments and international bodies have implemented various emissions reduction strategies to combat this issue, including initiatives to promote the adoption of electric vehicles (EVs). In 2023, the global EV fleet surpassed 40.5 million, with China holding the largest share at 54%, followed by Europe and the United States2.
As the global electrification of transportation gains momentum, an urgent need arises for a deeper understanding of EVs’ empirical usage and charging patterns at a large scale3,4. Policymakers and urban planners can use this knowledge to devise targeted strategies to promote EV uptake and optimize charging infrastructure deployment, thereby accelerating progress towards environmental sustainability goals5. EV manufacturers and charging infrastructure providers require this information to tailor their product offerings and service provisions to better meet battery energy requirements and charging demands of EV users6. Energy system operators and grid planners must devise strategies to ensure EVs’ reliable and sustainable integration while maximizing the utilization of renewable energy resources7,8.
Research on EV usage behaviors applies various methodologies to make assumptions regarding user preferences, charging patterns, driving habits, etc. They are grouped into two categories: 1) ICEV characteristic benchmarking, which primarily involves equating EVs to ICEVs to infer potential usage patterns and challenges, and 2) charger trials, which focus on empirical observations of EV charging infrastructure to derive insights into user behavior and charging system performance.
The first method equates EVs with ICEVs, determining probable EV usage patterns and problems. For instance, Pearre et al.9 simulated EV usage based on the behavior of 484 ICEVs to assess whether the limited battery range of EVs aligns with typical driving habits. Similarly, Cai et al.10 used data from 11,880 conventional fuel taxis to predict the impacts of EV adoption on public charging infrastructure and GHG emissions in Beijing. Shoman et al.11 utilized GPS-logged movement patterns from 412 ICEVs in Sweden to simulate the benefits of an electric road system (ERS) for EV drivers. Liao et al.12 applied an agent-based model using a mental model developed based on the interviews of early EV adopters13 to simulate the behavior of 284,000 ICEV drivers in the Västra Götaland region of Sweden. This model explored three hypothetical charging behaviors: one mirroring traditional liquid fuel strategies (charge when battery state of charge (SOC) is below 20%) and two adaptive EV strategies based on daily trip planning and available infrastructure. These studies often assume that ICEV driving patterns indicate future EV usage, which may not accurately capture the distinct operational and behavioral dynamics of EVs.
While many of these studies provide valuable insights into potential charging behaviors, the scope of the research is frequently limited by the assumption that EV drivers will behave similarly to ICEV drivers. EV usage patterns, however, may diverge significantly due to differences in battery size, range anxiety, the availability of charging infrastructure, and the need for route optimization. For example, studies like those by Franke and Krems14 have highlighted that EV drivers may modify their driving routes and charging decisions to accommodate the vehicle’s specific needs, particularly for long-distance travel. Moreover, such behavioral adaptations can vary based on factors like climate, road infrastructure, and urban versus rural driving conditions, as discussed by Helveston et al.15, who found that EV adoption and usage patterns differ markedly across geographic regions and climates.
Recent studies have increasingly focused on real-world data from EV charging events. Hardman et al.16 used questionnaire surveys, interviews, modeling, GPS data from vehicles, and data from EV charging equipment to identify the most important location for plug-in electric vehicle (PHEV) charging. Hecht et al.17 analyzed 22,200 charging stations in Germany, providing insights into energy consumption, station occupancy, and profitability of public charging stations. Khoo et al.18 modeled charging behavior based on actual charging events in Australia, noting that widespread EV adoption only modestly increases overall electricity demand. These studies are crucial for understanding the practical aspects of EV charging and user interactions with charging stations, reflecting direct observations of user behavior.
One of the key aspects of EV adoption that remains underexplored is the temporal and spatial impact of charging on the grid. EV charging tends to be highly concentrated at certain times of the day, particularly during peak hours when grid demand is already high. Studies like those by Muratori19 and Richardson20 have shown that unmanaged EV charging can lead to grid congestion and increased strain on electricity infrastructure. Furthermore, the spatial distribution of charging stations—especially in urban versus rural areas—can significantly influence charging patterns. The spatial dynamics of EV charging are critical for grid planning, as clusters of charging stations in high-demand areas may require grid reinforcement to prevent overload.
There is growing evidence that EV drivers’ preferences for charging locations (e.g., home versus public charging) and times of day can drastically alter the grid load profile. As highlighted by studies like that of Wang et al.21, the integration of EVs into the grid requires a comprehensive understanding of not only peak demand but also the timing and location of charging events. This knowledge is crucial for developing strategies such as time-of-use tariffs and vehicle-to-grid (V2G) technologies, which could mitigate grid stress by encouraging off-peak charging or allowing EVs to discharge electricity back into the grid.
However, there are significant drawbacks from the aforementioned studies. Studies leveraging real-world data are limited by focusing on a small sample size of early adopters, who may not represent the broader population of current and future EV users. Large-scale simulation tools and behavioral models based on ICEV drivers may not hold for EV drivers due to differences in vehicle technology and user adaptation to EV-specific characteristics and infrastructure. Furthermore, model assumptions based on interviews and case studies of early adopters might not represent the broader EV user base. Additionally, most studies often suffer from short observation periods, which can restrict the generalizability of the findings.
A notable limitation of existing research is its primary focus on private passenger cars, often neglecting the charging behaviors and usage patterns of other consumer groups, particularly service-oriented users such as taxis, rental cars, official cars, and vehicle types, including buses, trucks, and special purpose vehicles (SPVs). While passenger EV studies provide valuable insights, these findings may not be directly applicable to the other consumer groups and larger vehicles that play a critical role in service/commercial transportation. Charging requirements for commercial users are likely to be distinct due to longer driving distances, longer operating hours, and differing operational schedules, requiring separate assumptions for simulations and predictive models. Thus, the omission of other user groups, buses, trucks, and service-oriented EV including taxi and rental cars leaves a significant gap in understanding how electrification might affect broader transportation systems, particularly in terms of infrastructure demands and energy consumption.
This study’s significance is combining large-scale, long-term empirical data collection of EV usage across a comprehensive population sample with advanced modeling techniques that accurately reflect the unique behaviors associated with EV driving and charging patterns. Such comprehensive research efforts are essential for developing effective policies and infrastructure plans that accommodate the EV market’s rapid growth and evolving dynamics. As the number of EVs surges and the differences in user demands become more and more diverse, the impact of EV charging load on the operation of distribution networks will have a greater impact on the accuracy and effectiveness of future EV policies and infrastructure planning. Specifically, we attempt to answer the following research questions (RQs), each designed to highlight our unique contributions:
-
1.
What distinct characteristics and usage patterns emerge across different types of EV fleets in China, particularly between private and public mobility services?
-
2.
How do the charging behaviors of EVs vary among different fleet types in China, and what does this reveal about the operational dynamics specific to each service type?
-
3.
What are the spatio-temporal dynamics of EV charging demand, and how do these variations influence energy requirements?
RQ1 aims to highlight the diversity within EV operations and their adaptation to varying mobility demands. RQ2 seeks to uncover unique challenges and opportunities in the charging infrastructure necessary to support diverse EV applications. RQ3 focuses on understanding the implications of these dynamics for managing energy resources effectively in the transition to electric mobility.
Results
We analyze the activity of 1.686 million EVs from November 1, 2020, to October 31, 2021, across seven major Chinese cities: Beijing, Shanghai, Guangzhou, Shenzhen, Nanjing, Chengdu, and Chongqing, representing 42.2% of China’s total EV fleet. This extensive dataset includes various vehicle categories including private cars, taxis, rental cars, official vehicles, buses, and SPVs. SPVs refer to vehicles that have other uses including transporting goods by road, e.g., concrete pump. They are described in Section Regional and Fleet Diversity in EV Adoption and Battery Capacities.
The original dataset includes 73 parameters such as energy capacity, trip timestamps, vehicle state, odometer readings, SOC, power consumption, and vehicle type, etc. We defined “trip” as uninterrupted journeys and calculated parking times to analyze driving and charging patterns. We created a parking database with start/end times, SOC percentages, and locations. To address the inconsistent definitions of charger levels and the lack of detailed data on charger types, we analyzed the empirical distributions of the actual charging power delivered to vehicles using the valley-seeking method. By identifying natural troughs (density valleys) in these distributions, we defined three cutoff levels—P1, P2, and P3—that represent slow, medium, and fast charging for each vehicle type, enabling a more accurate analysis of charging practices and their impact on battery longevity. By analyzing the usage and charging data, we present the main results in Sections Usage and Charging Patterns Reflect Operational Needs and Service Functions of EVs and Energy Consumption and Charging Power Utilization Inform Infrastructure and Grid Planning Needs.
For spatiotemporal analysis, we mapped charging events within city boundaries to hexagon grids (0.74 km2), filtering out grids without sufficient events. We counted charging events in each grid for hourly intervals on weekdays and weekends, normalized the data, and performed K-means clustering (k = 3), guided by the Elbow Method, Silhouette Score, and Hierarchical Clustering, to identify temporal charging patterns. This part of the results is presented in Section Spatial Charging Patterns Highlight Energy Resource Management Challenges.
Regional and fleet diversity in EV adoption and battery capacities
Private passenger cars form the majority of the EV fleets, accounting for 54% of the total fleet. SPVs account for 13%, followed closely by official (11%), rental (10%), taxi (7.5%), and buses (4.5%) (Fig. 1a). The penetration rate of EVs among passenger cars exhibits notable regional variation, with Shenzhen leading at 18.4%, followed by Shanghai (14.0%), Guangzhou (12.2%), and Beijing (9.7%). In contrast, Chengdu, Nanjing, and Chongqing present lower rates, suggesting differentiated urban adoption dynamics reflecting regional policy differences22. Taxis powered by electricity display substantial penetration in Beijing (11.5%), indicative of policy-driven fleet conversion, whereas Shanghai and Chongqing show moderate uptake. Electric buses present an impressive adoption, with Guangzhou at the forefront with 93.4%, followed by Shanghai and Beijing, both exceeding 80%, and Shenzhen at 46.5% in 2021, although to-date many of these cities have reached near 100% penetration rate. These figures underscore the aggressive electrification policies within urban transit systems in some of the Chinese cities.
EV battery capacities vary significantly across different transportation modes and regional frameworks, reflecting a rich diversity in usage requirements and local policies. Buses, which require substantial energy reserves for extensive public transport operations, exhibit the largest median battery capacity at 165 kWh (Fig. 1b). Conversely, taxis, rental vehicles, official cars, and private passenger vehicles show a more uniform median battery capacity around 50 kWh, indicating a level of standardization that spans both service-oriented and private uses. However, SPVs and buses, despite their lower and more varied battery capacities, respectively, are included in separate analyses (Fig. 1c, d) because of their unique operational roles and the broader variability in their battery sizes across different cities. SPVs, although slightly lower in median battery capacity than cars, display a broader range of battery sizes and a right-skewed distribution. This broader range of battery capacities in SPVs and buses is a focal point of our study, as it underscores the influence of localized operational demands and context such as geography and charging infrastructure and their impacts on battery sizing. This diversity points to variations of region-specific charging infrastructures and energy strategies to effectively support the varied energy requirements of China’s EV fleet (more results in Fig. 6 in Supplementary C).

a Distribution of EV types across selected Chinese cities. b Distribution of battery energy by vehicle types, with buses and SPVs plotted on a separate axis due to their significantly different energy profiles compared to passenger cars. c Variations of battery energy of buses across studied cities. d Variations of battery energy of SPVs across studied cities. e Daily driving distance of different vehicle types. f The ratio of daily energy consumed over battery energy (light purple bars, left y-axis) and the number of charging events per day (light green bars, right y-axis).
The daily driving distances show marked contrasts between service vehicles and private cars. Private vehicles demonstrate the shortest daily travel distances (median 30 km), succeeded by official cars, SPVs, rental cars, buses, and taxis (median 150 km) in ascending order. Buses, taxis, and SPVs exhibit the highest daily driving distance, underscoring their intensive usage (Fig. 1e). As a result, these three vehicle types also have the highest number of daily charging events, with SPV, taxi, and bus having a median of 0.81, 1.14, and 1.67 times per day, respectively (Fig. 1f). In Fig. 1f, we illustrate these observed charging events alongside the energy ratio (ratio of daily energy consumed over battery energy). For example, most private vehicles don’t need to be charged daily because the ratio of daily energy consumed over battery energy is less than 1 (median = 0.14), meaning that the energy required for daily driving is typically below the full capacity of the battery. This is reflected in the lower number of charging events per day, with a median of 0.47 (Fig. 1f). Even for vehicle types with higher daily energy consumption, such as taxis and buses, where the ratio approaches but is still below 1, the majority of vehicles do not require daily charging, although the distribution shows that some do. This indicates that while the median energy ratio suggests less frequent charging, operational demands for these vehicles often lead to more frequent charging events.
Usage and charging patterns reflect operational needs and service functions of EVs
The distinct temporal patterns of EV usage (Fig. 2a) reflect these vehicles’ operational demands and service roles. Private cars are typically driven during peak weekday hours, suggesting commuting travel. Weekends & holidays show a more even distribution, indicating leisure activities. Taxis, SPVs, official cars, and rental cars exhibit high activity throughout the day with minimal weekday vs. weekends & holidays variation, highlighting constant demand for commercial passenger and service transport (Fig. 2a). Weekends & holidays usage is higher for rental cars, indicating a higher demand for weekends & holidays trips. Buses have striking rush-hour peaks on weekdays that match public transport demand (Fig. 2a). Weekends & holidays activity is evener but still peaks in the morning and evening.
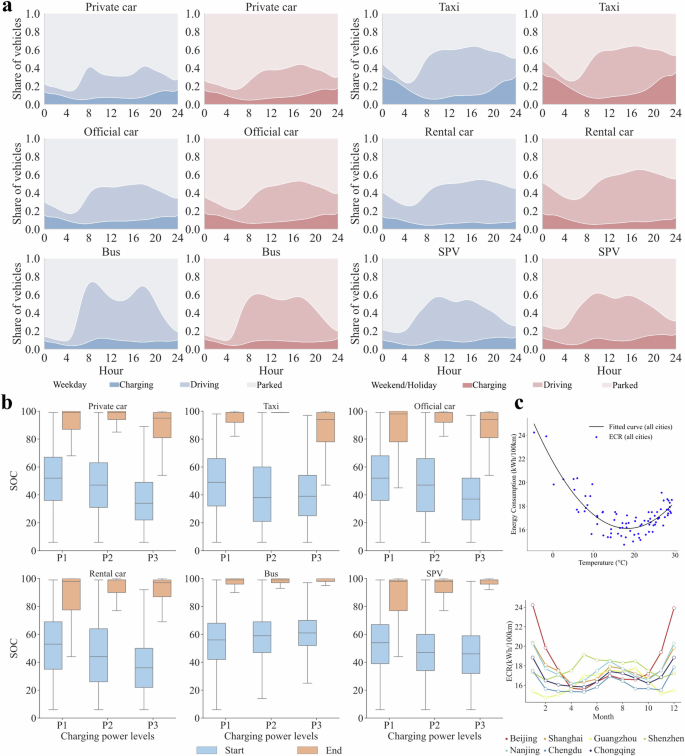
a Daily usage patterns of EVs across different vehicle types and days. The figure presents the share of vehicles that are driving, charging or stationary (parking) over a 24-hour period for six vehicle categories, marked with decreasing color saturation. Each category is analyzed separately for weekdays (blue) and weekends & holidays (red). b SOC levels before and after charging by charging level by vehicle type. c Energy consumption rate (ECR) of passenger cars by month of the year by city (bottom) and as a function of temperature (top).
Previous studies often assume that EV drivers charge their cars when the SOC is below 20%, much like refueling their gas cars. Though interviews of EV drivers suggest that there is a wide range of behavioral types13. We present the SOC levels before and after charging for each vehicle type, categorized by charging power level (Fig. 2b) and found that users rarely let their SOC drop below 20% before charging. This suggests that most batteries are not fully depleted before charging. It is generally not advantageous for drivers to charge their batteries beyond 80% SOC, as this can lead to longer charging times and reduced battery lifespan. Optimal charging typically occurs at 80% SOC, while fully charging to 100%—a common practice in China (as illustrated in Fig. 2b)—can actually be detrimental to battery health and significantly shorten its lifespan23. A general trend indicates that higher charging power is associated with lower SOC for all vehicle types except buses.
Buses exhibit different charging behaviors than the other vehicle types due to their operational needs. They operate with quick turnaround times to maintain service schedules and accommodate large ranges; buses are charged even when SOC levels are high. The unique charging patterns of buses suggest that maximizing the range to provide continuous service is a priority for the bus fleet. Surprisingly, despite the recommendation of avoiding complete discharge and recharge cycles for lithium-ion batteries24, we found that it is common across all vehicle types to charge to 100% SOC, indicating that users prefer to maximize their driving range despite the belief that regularly charging to 100% SOC can shorten battery lives.
Energy consumption and charging power utilization inform infrastructure and grid planning needs
These distinct operating conditions, combined with the temperature effect on batteries, lead to the varying energy consumption rate (ECR) of vehicle batteries25. The relationship between temperature and energy consumption indicates that battery efficiency peaks at 16 kWh/100 km around 15–20 °C (Fig. 2c, bottom). Efficiency decreases by 12.5% when the temperature is either above 30 °C or below 7 °C, highlighting that high and low extreme temperatures negatively impact the energy consumption of EVs. Other vehicle types exhibit similar trends to private cars, although these results are not presented here due to limited space. Take passenger cars as an example, we observe “W”-shaped energy use curves from January to December across various cities (Fig. 2c, top). The observed variations between cities can largely be attributed to differences in ambient temperature (as illustrated in Fig. 2c, bottom). However, additional factors beyond temperature, such as vehicle mass, traffic conditions, and speed limits, could also contribute to these discrepancies. EVs exhibit the highest ECR during the winter months (November to February) in cities with cooler climates, not only due to the sub-optimal performance of batteries at low temperatures but also because of the increased energy consumption from additional on-board units, such as heating systems. Additionally, EVs show increased ECR during the hot summer months (June to September), likely due to air conditioner usage. In Guangzhou, where winter is mild, there is an efficiency penalty only in the summer, with no significant impact observed in the winter.
Given the lack of standardized definitions and frequent confusion regarding charging levels and the lack of access to the chargers used by drivers, we use empirical distributions of charging power delivered to vehicles to identify three power levels (P1, P2, P3), referred to as low (P1), medium (P2), and high (P3) charging levels for each vehicle type (cars, buses, SPVs). See more description in Supplementary B and the summary of charger power level in Methodology Table 2.
The daily charging number of charging vehicles and charging load provide valuable empirical insights into charging behaviors that correspond to the service needs of these vehicles (Fig. 3). Low-level charging occurs consistently throughout the day and draws minimal power from the grid. Medium- and high-power charging are used more frequently during the day and vary depending on the application. For infrastructure planning, it is evident that high-power, fast-charging options are essential for commercial and public service vehicles, while private passenger cars exhibit diverse charging behaviors, including low power (<4 kW, presumably home charging) and medium power (4–20 kW, presumably both home and workplace charging) solutions. Medium-level charging for passenger cars peaks after 18:00. High-power (P3) charging is more frequent for all service vehicles, including official, rental cars, taxis (>20 kW), buses (>185 kW), and SPVs (>65 kW), though the timing varies depending on the service provided. The highest power demand for buses occurs immediately after the morning and afternoon peaks. SPVs predominantly utilize medium-level power (10–65 kW) with a peak around noon. The weekends & holidays schedules also differ for all vehicle types.
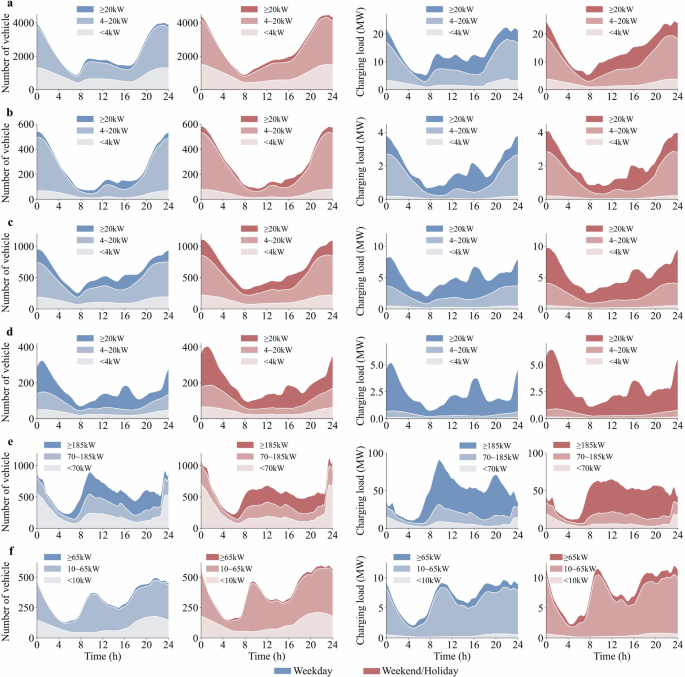
(a) private cars, (b) taxis, (c) official cars, (d) rental cars, (e) buses, and (f) SPVs. Each vehicle type is analyzed separately for weekdays (blue shades) and weekends & holidays (red shades). A high power level (P3) is shown in dark blue/red, medium (P2) in medium blue/red, and low (P1) in light blue/red.
We also analyze individual drivers’ charging preferences and found that some drivers rely exclusively on one type of charger while others use a combination of power levels (see Fig. 3 in Supplementary B). More than 40% of private passenger vehicles exclusively use one type of charger, while 30% use a combination of P2 and P3 chargers. For SPVs, P2 charger usage dominates (60%), while P1 chargers are also used, and P3 charger use is minimal. Taxi usage patterns indicate a strong preference for a combination of P2 and P3 chargers (>60%), suggesting a need for rapid charging to minimize downtime. Usage of P1 chargers by taxis is minimal, likely due to slow charging speeds being impractical for their operational needs.
As expected, low-energy rating charging (P1) requires the longest duration, whereas high-energy rating charging (P3) requires the shortest (Fig. 4 in Supplementary B). These observations highlight the efficiency benefits of higher energy rating charging methods, which substantially reduce the time required for charging events across all types of vehicles. This reduction is particularly significant for fleet and commercial vehicles, where minimizing downtime is critical. These observations underscore the importance of developing and deploying high-energy charging infrastructure to support the growing adoption of EVs beyond private passenger cars and to ensure practical and efficient vehicle operations of service- and commercial-vehicles.
Spatial charging patterns highlight energy resource management challenges
We divide cities into small hexagonal grids to analyze the spatial characteristics of charging load and charging demand profile within each city (See Methods for more description). Figure 4a shows the annual maximum charging power within each hexagonal grid across Beijing. We find that high-power hot spots are predominantly concentrated in the city’s central areas, especially at the intersections of the road networks. For the spatial distributions of maximum charging power in the other cities, see Figs. 7–12 in Supplementary C.
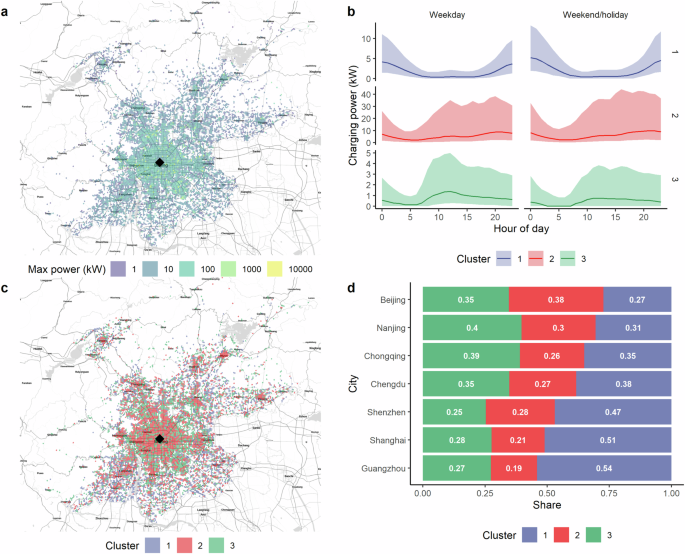
a Annual maximum charging power within each hexagonal grid across Beijing. The diamond markers indicate the center of Beijing. b Three unique clusters of daily temporal patterns of charging power (all cities). Solid lines represent the median values. Shaded areas indicate the range between 25th and 75th percentiles. c Distributions of the three clusters of temporal charging profiles in Beijing. d Share of clusters by city.
The temporal profiles of charging power demand in each hexagon are clustered based on their unique temporal patterns (See Methods for more description) and are shown in Fig. 4b for both weekdays and weekends & holidays. They show three distinct daily patterns: Cluster 1 (blue) experiences peak demand early morning and night, likely corresponding to residential charging areas with relatively low max power. The magnitude of charging power for Cluster 2 is higher overall, with persistent peaks from mid-morning to late afternoons. This temporal pattern likely indicates that Cluster 2 is located in bus depots or major commercial charging areas. In contrast, the charging power magnitude for Cluster 3 is lower (and slightly lower on the weekends & holidays), with peaks occurring in the morning after the rush hour. This temporal signature indicates that Cluster 3 is likely located in working areas.
Figure 4c maps the spatial distribution of the three clusters of temporal charging profiles in Beijing. It shows Cluster 1 is primarily situated in peripheral areas of the city, while Cluster 2 and Cluster 3 are concentrated in central urban zones. Not suprisingly, the red spots (Cluster 2) in Fig. 4c significantly overlap with yellow spots (highest power load) in Fig. 4a, and they are primarily distributed in central areas with the highest degree of travel and network accessibility. Figures 7–12 in Supplementary C show the distributions of the three clusters of temporal charging profiles in the other cities.
The prevalence of these three clusters varies by city (Fig. 4d). Guangzhou and Shanghai have a relatively large share of Cluster 3 (residential-like charging load profile), whereas Beijing exhibits equal shares of the three clusters. Coincidentally, Beijing has the highest share of Cluster 2, indicating either significant commercial and service-oriented load demands, work-related, or after-work charging. This is attributed to its relatively high adoption of multi-modal EVs, serving as a potential model for other cities as their EV adoption rates increase.
Discussion
Our findings reveal distinctive characteristics and usage patterns across different EV fleets, particularly among private cars vs. commercial- and service-oriented vehicles (taxis, rental cars, official cars, buses, and SPVs). Commercial- and service-oriented vehicles are driven more frequently throughout the day than private cars concentrated during peak hours. The driving patterns show distinctive peaks and troughs corresponding to specific operational needs, such as commuting hours for passenger cars and official vehicles, continuous high demand for taxis, and peak transit hours for buses. These variations underscore different EV fleets’ diverse usage behaviors and energy requirements.
Commercial- and service-orientated vehicles rely more strongly on high-power charging throughout the day to minimize downtime and provide sustained service. The contrasting difference between the number of charging events and the charging load is worth noting. Despite being fewer in number across most modes, high-power charging can impose significant loads on the grid. Electric buses, although comprising only 4.5% of the total fleet, place the greatest load demands on the grid, with high-power charging being the most favored level. This is especially evident in Beijing, where high-power charging is almost exclusively used26.
Empirical SOC levels provide valuable insights into users’ charging behavior, including how they plan their charging sessions, how often they charge, and their confidence levels with remaining battery capacity. The power levels at which different chargers are utilized and their specific usage times are critically important for infrastructure planning and grid impact assessments. Understanding these utilization patterns is essential for designing and managing charging infrastructure, as they reveal the diverse needs for charging speeds across various vehicle types. This knowledge informs the strategic deployment of charging solutions, ensuring that infrastructure can meet the specific demands of both private and commercial EVs, despite the ongoing technological changes and advancements. The energy density of EV batteries has increased by approximately 30% over the last five years27. China in 2023 leads EV supply equipment by supplying 85% of the world’s fast chargers and 60% of slow chargers28. Such developments could significantly influence future EV charging behaviors, leading to shorter charging times and shifts in the demand for charging infrastructure.
Future studies should take into account these evolving factors. For example, the deployment of high-power chargers might reduce the frequency of charging events while increasing the instantaneous load on the grid, which could create new challenges for grid management and infrastructure planning. Additionally, the increasing energy density of batteries may alter the SOC patterns observed in today’s EVs. A study by Li et al.7 simulating a future scenario with higher-power chargers and larger-capacity batteries showed that overloading conditions are highly diverse spatially, with feeders in residential areas requiring twice as much upgrade compared to commercial areas. Our ongoing study will explore how these technological advancements impact energy consumption patterns using models to predict infrastructure needs under various future scenarios. These evolving factors would certainly change utilization patterns and infrastructure needs in significant ways.
Nevertheless, Our empirical findings underscore the importance of strategically placing and scaling high-power charging stations to support commercial fleets, such as taxis and buses. Additionally, the variability in charging times and power demands across different vehicle categories suggests that dynamic grid management strategies will be essential to balance load and ensure grid stability. Understanding these distinct charging behaviors provides a foundation for optimizing charging infrastructure deployment and enhancing the overall efficiency of the EV ecosystem. This targeted approach to infrastructure planning is vital for supporting the widespread adoption of EVs and achieving sustainable transportation goals.
Moreover, analyzing SOC levels before and after charging events reveals critical insights into user behavior and charging strategies. The tendency of users to charge to 100% SOC, despite concerns about battery health, suggests a preference for maximizing driving range, which has implications for battery technology development and user education. For buses, the consistent practice of charging to nearly full capacity, regardless of initial SOC, highlights the operational priorities of maximizing range and minimizing service disruptions. These insights into SOC-related charging behaviors can inform the design of user-centric charging solutions and policies to enhance EV usage’s convenience and longevity.
The spatial and temporal patterns of EV charging demand present both challenges and opportunities for energy management. Flexible energy management systems, incorporating orderly charging and V2G technologies, are essential for enhancing urban grid resilience and efficiency. Integrating real-time data and predictive modeling and considering new solar and battery technologies can optimize resource allocation and minimize costs26. Our findings highlight the need for adaptive strategies that align infrastructure development with charging patterns to support sustainable electric mobility and reduce grid stress. Our insights regarding vehicle charging events’ spatial distribution and temporal patterns underscore the complexities of energy resource management in urban areas. This spatial clustering of high-power demands highlights potential stress points in the urban grid that require targeted infrastructural enhancements to ensure an adequate energy supply. This spatial segmentation can inform localized grid reinforcement efforts and the strategic placement of new charging infrastructure to optimize coverage and efficiency.
The inter-city variations presented in this study highlight the necessity for tailored approaches to energy resource management, considering each city’s unique urban dynamics and infrastructure capabilities. These patterns offer a comparative framework to benchmark and enhance urban charging networks.
Methods
Data
The dataset is obtained from the National Big Data Alliance of New Energy Vehicles Lab, and the data processing for determining vehicle state is in this paper29. We have access to a subset of data with 1.69 million EVs (representing 42% of China’s total EV fleet) collected from November 1, 2020, to October 31, 2021.
This dataset adheres to the standards outlined in the “Technical Specifications of Remote Service and Management System for EVs – Part 3: Communication Protocol and Data Format” (GB/T 32960.3-2016), encompassing 73 distinct data parameters. Key variables recorded for each vehicle include the Vehicle Identification Number (VIN), nominal energy capacity, driving range, timestamps marking the start and end of each trip, vehicle state (delineated as started, turned off, and other states), odometer readings at trip initiation and conclusion, SOC at both start and end, average power consumption, and the specific type of vehicle.
A “trip” within this dataset is defined as a single uninterrupted journey from an origin to a destination, with this granularity allowing for detailed analysis of driving and charging patterns. Parking time is calculated by subtracting the starting time of a new trip and the end time of the previous trip. A new parking database is created with parking start and end time, start time SOC (%) and end time SOC (%), and the parking location (coordinates).
The dataset contains vehicle activity in seven major Chinese metropolises: Beijing, Shanghai, Guangzhou, Shenzhen, Nanjing, Chengdu, and Chongqing. The dataset encompasses many vehicle categories, including private cars, taxis, rental cars, official vehicles, buses, and SPVs. SPVs include engineering, logistics, sanitation, and postal services vehicles. Table 1 shows the number of EVs by type and city. Beijing has the highest EV fleets, followed by Shenzhen, Shanghai, and Guangzhou. Private cars constitute roughly half of the total EV fleets, followed by SPVs, official cars, and rental cars.
Charging power levels
Given the lack of a consistent definition for charger power level and the absence of data on the charger type (rated power) in each charging event, we use empirical distributions of actual charging power delivered to vehicles and select three cutoff levels (P1, P2, P3) that roughly represent slow, medium and fast charging for each vehicle type (see more detailed discussion in Supplementary B). We employ the “valley-seeking method”, where cutoff points are determined by identifying the density valleys—natural troughs in the distribution of actual charging power delivered to vehicles30. This approach allows for the effective separation of charging power levels by focusing on the boundaries between distinct clusters of charging behavior. The histograms in Supplementary Fig. 2 show the distributions of power levels delivered to vehicles for all charging events and our selected cutoff points for each vehicle type. These empirically derived cutoff points allow for a nuanced analysis that is closely aligned with the charging capacities and operational patterns of different vehicle types, ensuring the analysis reflects actual needs. The numbers are also summarized in Table 2.
Spatio-temporal analysis of charging events
We analyze charging events in each city to reveal the spatio-temporal dynamics of EV charging demand. We select charging events within city boundaries based on their GPS coordinates (latitude, longitude) and then assign their corresponding H3 grid31 with Resolution 8 (~0.74 km2). We then filter out grids with an average of less than 5 charging events per month to have a reliable clustering process. We count the number of charging events in each grid at each hourly time interval for weekdays and weekends & holidays separately (Eq. (1)).
where c indicates the city, with c ∈ (Beijing, Shanghai, Guangzhou, Shenzhen, Nanjing, Chongqing, Chengdu); k is the index of the h3 grid; Dc,k represents the total charging power of the charging points in h3 grid k at the tth hour where the hours 1–24 indicate an average weekday, while the hours 25–48 indicate an average weekend/holiday. Dc,k is normalized by ({D}_{c,k,max }=max ({overrightarrow{p}}_{k,t}),t=1,2,ldots ,48) to formulate clusters of the temporal charging patterns that range between 0 and 1.
We conduct K-means clustering on the normalized charging power curves of all charging points in the h3 grids. The number of clusters is determined to be 3 using a combination of the Elbow Method and Silhouette Score32. The K-means algorithm clusters samples by minimizing the squared error between the empirical mean of each cluster and the vectors within that cluster. To determine the optimal number of clusters, values ranging from 2 to 10 are tested to maximize the Silhouette Score, a measure that assesses how well samples are clustered, ensuring that samples within the same cluster are similar and those in different clusters are distinct33. The Elbow method was applied so that further increasing the number of clusters from 3 doesn’t give much better data modeling, as quantified by the Silhouette Score. Finally, we show the spatial distributions of charging power in Fig. 4.

Responses