Light exposure differs by sex in the US, with females receiving less bright light
Introduction
Light is a salient environmental exposure, serving as the primary entraining cue for the circadian system and having other, non-circadian, effects on health1. While electric light is now common in the built environment, it wasn’t until the mid-1920’s that approximately half of U.S. households had access to indoor electric lighting2. Nearly one hundred years later, electric lighting is widespread but there is limited objective evidence characterizing personal light exposure patterns in the general population or the effect that this shift has had on human health3,4,5.
Just as air and water are environmental elements important for public health, light is an environmental exposure worthy of scientific measurement and attention. Light timing (and timing of light relative to the timing of body clocks), spectral distribution, brightness, duration of exposure, regularity of exposure, and exposure history are some of the biologically relevant dimensions of light exposure1,6,7. Unlike monitoring of other environmental exposures and pollutants, light exposure has not been well-integrated into biomonitoring efforts and environmental health research. Additionally, many prior studies of light exposure have been conducted in experimental or clinical settings or rely on satellite imagery to derive proxies of personal light exposure measures, and therefore may not capture indoor light exposure or personal behavior. For example, light at night (LAN) is suspected to be a possible factor in the development of cancer; however, to date, many studies of LAN and cancer are limited by reliance on satellite data for LAN exposure assessment, which may contribute to exposure misclassification if light in the (indoor) sleeping environment does not correspond to (outdoor) light as measured by satellite8. This is supported by prior work showing that satellite measures of LAN are poorly correlated with personal light exposure measures9,10. Because of these limitations, it is in the interest of public health to understand real-world light exposure patterns using objective, personal measures of light exposure.
Prior community-based studies of light exposure have utilized body-worn devices, such as with wrist-worn actigraphs, to investigate the influence of light on health, such as sleep11. The findings from these studies suggest that electrical lighting causes shorter sleep or delayed sleep timing3,4,12, associations between light and sleep timing or chronotype13,14,15, amplitude in daily light exposure is associated with sleep regularity16,17 and efficiency18, sleep architecture19, and sleep latency and wake after sleep onset20. However, personal light assessment in large cohort or population-based research is uncommon and greater integration of it is needed for future studies. Light exposure is implicated in numerous health conditions, such as vision and refractive error, sleep disorders, and mental health, and may be an important contributor to health disparities and/or differences. Interestingly, some light-related health conditions differ by sex and/or gender; for example, men have a higher prevalence of cutaneous melanoma21 and females show faster myopia progression22, higher prevalence of autoimmune disease23, and higher prevalence of insomnia24. These differences may be due to biology, or they may be due to environmental, sociocultural, and/or behavioral differences. For example, women have shorter intrinsic circadian periods (τ) and go to bed earlier and wake up earlier25 than men. It is also possible that gender and sex differences in light exposure patterns could contribute to gender and sex differences in health outcomes. Examining whether real-world light exposure differs by sex or gender would be valuable for multiple areas of public health research.
Therefore, to investigate whether sex differences in light exposure exist, we derive measures which reflect multiple dimensions of light exposure (timing of exposure in different light levels, duration of exposure in different light levels) using objectively measured personal exposure data from the 2011–2014 U.S.-based National Health and Nutrition Examination Survey (NHANES). Collected using light-sensing wrist-worn actigraphs26,27,28,29,30, this data can be used to understand real-world light exposure patterns in the non-institutionalized U.S. population. We test whether sex differences in light exposure patterns exist and explore whether differences are explained by occupational and/or behavioral activities. The results of this study may inform future health disparities research and promote the study of light as an important environmental exposure and component of the human exposome31.
Methods
Study population and characteristics
This analysis used cross-sectional data from the 2011–2012 and 2013–2014 cycles of the Centers for Disease Control and Prevention (CDC) National Health and Nutrition Examination Survey (NHANES), representative of the non-institutionalized U.S. population. Details on the NHANES study have been described elsewhere and are available at: https://www.cdc.gov/nchs/nhanes/about_nhanes.htm. Briefly, questionnaire data and health-related information were collected during physical examination in a Mobile Examination Center (MEC). Sex was either participant-reported or assumed and noted by the interviewer, with the options: “male”, “female”, “don’t know” or “refuse”32,33. Body mass index (BMI) was measured during the physical exam. Questionnaires and/or interviews were used to collect data on self-reported race and ethnicity, self-reported work and physical activities, and self-reported time spent outdoors. Race and ethnicity were included as a covariate in some models to attempt to account for the influence of racism and bias on factors that might impact light exposure, such as the built environment. Measures of actigraphy-derived average sleep duration and average activity were calculated from the same valid days as used for light measures. Time spent outdoors was only asked for participants aged 20–59. Further data processing details are described in Supplemental Materials. This analysis included participants with valid actigraphy and light data. The Ethics Review Board of the CDC National Center for Health Statistics approved NHANES. All participants provided informed consent.
Actigraphy measurement and data pre-processing
Following the physical exam, a subset of NHANES participants wore a wrist-worn GT3X+ ActiGraph device (ActiGraph, Pensacola, FL) for up to 9 days. This device concurrently measures light exposure and triaxial movement in 1-min epochs. NHANES collected activity and light data from wrist-worn GT3X+ ActiGraph devices (ActiGraph, Pensacola, FL) from a subset of the study sample following the MEC exam. Data processing steps are illustrated in Supplemental Fig. 1. Publicly available minute-level actigraphy data (including light) were downloaded from the NHANES 2011–2012 and 2013–2014 Physical Activity Monitor (PAM) files and processed. Individual-level minute-epoch timeseries data was processed by first (1) trimming the data to exclude the first partial day of measurement (prior to 12AM, the start of day 2) when device was given to the participants, then (2) applying quality criteria, then (3) deriving daily measures for the light and activity variables and averaging across days for a final individual-specific summary measure. For the data quality processing step (2), light and activity timeseries data were set to missing (for a specific 1-minute epoch) if any of these NHANES-provided quality control metrics occurred in the epoch: (a) if PAXFLGSM variable had a letter value; (b) if device was predicted34 to be off-wrist with PAXPREDM = 31 or unknown with PAXPRED = 4; and/or (c) if the triaxial activity value was <035. After this step, a day was considered invalid if there was more than 6 h of missing data or if the sum activity count for the day was <20036,37; this additional activity count threshold step was developed in prior work as an extra check to ensure data quality and that the device was being worn36,37. Light and activity measures were then derived from the first 6 valid days of wear. Because 2 of the 9 measurement days were partial (due to the participant receiving the device and dropping off the device), leaving 7 possible measurement days, the 6-day threshold was chosen to balance measurement of at least 1 weekend day while limiting loss of sample numbers. Participants with <6 valid days of measurement were excluded. Further details are provided in Supplemental Material.
Creation of light variables
Light metrics were calculated from valid days of included participants following the data quality processing steps (Supplementary Fig. 1). To calculate the duration of time spent in different light intensities (time above light threshold (TALT38), Fig. 2, Supplementary Fig. 1, Supplementary Table 1), a binary variable was first created to indicate whether an epoch’s lux value was within or above particular light level thresholds (≥1 and <100 lux, ≥100 and <1000 lux, or ≥1000 lux)36,39. These light levels were chosen to be consistent with prior observational studies and to approximately capture illuminance categories of dim or low (TALT1-100), moderate (TALT100-1000), and bright (TALT1000) light, respectively11,40. In general, light exposure ≥1000 lux likely represents outdoor light (i.e., daylight), 100–999 lux may represent indoor (e.g., electric light) or outdoor (e.g., daylight) environments for the GT3X+41, and light exposure <100 lux likely represents indoor (e.g., electric light) environments (or outdoor nighttime environments). For the first (FTL) and last (LTL) daily timing of light metrics, the first and last daily timestamp where there were 3 consecutive epochs (3 min) with a light value at or above a particular threshold (here, ≥10 lux, ≥100 lux, and ≥1000 lux) were identified and selected. The individual photoperiod (IP) duration (hours) was then calculated as the amount of time between the FTL and LTL. The mean light timing revised (MLiTR42) metric was calculated by taking the circular mean of the timestamps at which light exposure was at or above a particular threshold (here, ≥10 lux, ≥100 lux, and ≥1000 lux); there was a slight revision to the original measure to require at least 3 timestamps in the calculation of the MLiTR measure (time, Hour:Minute; Fig. 2, Supplemental Fig. 1, Supplementary Table 1).
These metrics were calculated from valid days (as described in the preceding section); if a light value within a valid day was missing (“NA”), it was treated as missing. However, a sensitivity analysis was conducted to impute missing light values within a valid day. To do this, the median light value for each 1-minute epoch (n = 1440) was calculated from that epoch’s non-missing values from the other valid days of data. If a light value was missing, it was replaced by its median value for that epoch. After this step, any additional remaining missing light values were imputed with linear interpolation using the “imputeTS”43 R package (this occurred for n = 2 participants, 6 minutes each).
Statistical analysis
The mean, 95% confidence interval (CI) of the mean, and/or standard deviation (SD) of light variables were calculated as summary measures. The “circular”44 R package was used for circular statistics calculations. The NHANES study uses a complex sampling design and NHANES sample weights are used to account for this design to obtain appropriate population estimates. Data were analyzed with 4-year (2011–2012, 2013–2014) combined NHANES MEC sample weights using the “survey” package45 to derive population-based estimates. Plots of both unweighted and sample-weighted data are shown. For variables related to timing (FTL, LTL, MLiTR), the circular (vector-based) mean and SD were calculated (without sample weights), but these variables were otherwise treated in the same way as linear variables in analyses. To test whether there were sex differences in light exposure, light metrics of males and females were compared using population-weighted two-sample t-tests; differences in group means and 95% CI were also calculated. Occupational and behavioral factors were also explored as possible mediators in the relationship between sex and bright light. First, occupational and behavioral factors were tested in linear regression models as predictors of TALT1000. Factors significantly associated with TALT1000 were then included (modeled individually, except for actigraphy-measured sleep duration and activity) as covariates in linear regression models with sex as the predictor and TALT1000 as the outcome to evaluate how their inclusion in the model affected the association between sex and TALT1000. All adjusted models included age, season, and race and ethnicity as covariates. P-values < 0.05 were considered statistically significant. All analyses were performed in R version 4.4.0
Results
There were 11,314 NHANES participants with valid light and actigraphy data included in this analysis (Fig. 1). The average age of participants was 38 years old (age range: 3–80+ years), with 52% females (Table 1). By race and ethnicity groups, approximately 4.6% of the sample self-reported belonging to the non-Hispanic (NH) Asian group, 11.7% to the NH Black group, 64.4% to the NH White group, 10.1% to the Mexican American group, 6.2% to the Other Hispanic group, and 3.0% to the Other or Multiracial group. The average duration of time spent in bright light (TALT1000) was 1.09 h daily (95% CI: 0.96, 1.21 h), moderate light (TALT100-1000) was 2.22 h daily (95% CI: 2.11, 2.33 h) and dim-low light (TALT1-100) was 5.51 hours daily (95% CI: 5.40, 5.61 h) among included participants.
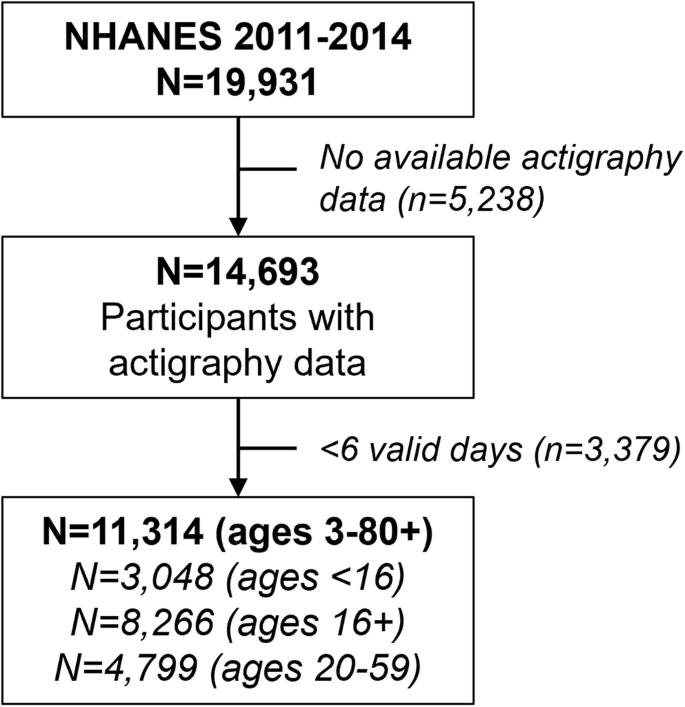
Flow chart showing the sample sizes of participants included in the analyses.
Females have less bright light exposure compared to males
Across all ages, males spent approximately 52% more time in bright light compared to females (male TALT1000 = 1.32 (95% CI: 1.16, 1.48 h); female TALT1000 = 0.87 (95% CI: 0.77, 0.98 h); difference in means = −0.45 h (95% CI: −0.53, −0.36), p = 1.37e−11; Fig. 2). Therefore, females received 39.6 min of bright light for every 60 min of bright light exposure that men received. This sex difference emerged in childhood but was greater for participants aged 16 and older (Table 2). The results were similar with (Supplementary Fig. 1) or without (Fig. 2) applied sample weights. Females also spent greater time in low or dim light environments, characteristic of the indoor environment, compared to males across all ages (male TALT1-100 = 5.15 (95% CI: 5.04, 5.27 h); female TALT1-100 = 5.83 (95% CI: 5.70, 5.95 h); difference in means = 0.67 h (95% CI 0.57, 0.77), p = 1.54e−14; Fig. 2), although this difference was most pronounced in participants 16 and older (Table 2). The sex gap in bright light existed across all race and ethnicity groups tested among participants aged 16 and older, except for the Other or Multiracial group; however, this group had a smaller sample size and may have been underpowered to detect a difference (Table 3). The mean difference in TALT1000 exposure between males and females aged 16 and older was greatest for the Mexican American group (mean difference = −0.73) followed by the Other Hispanic group (mean difference = −0.57), the NH White group (mean difference = −0.51), and the NH Black group (mean difference = −0.47; Table 3).
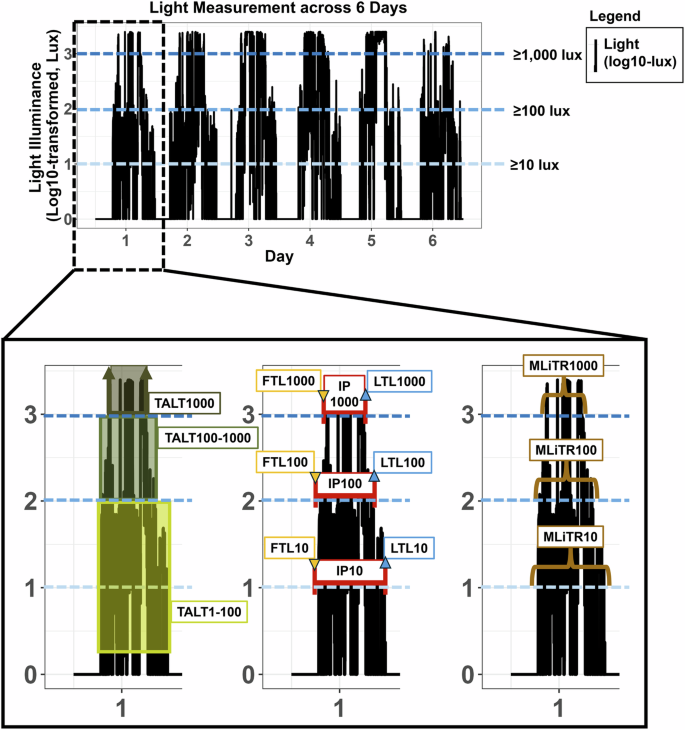
Figure showing an example of light data measured from a participantin NHANES, where black traces represent light data (plotted as log10-transformed lux+1) measured across 6 days. Horizontal blue dotted lines represent illuminance thresholds (≥10, ≥100, and ≥1000 lux). Lower inset of the data from Day 1 (shown 3 times to illustrate different light metrics) shows representations of the different light metrics, including time above light threshold (TALT) as the duration of time spent at different light levels (duration in ≥1 to <100, ≥100 to <1000, and ≥1000 lux, as indicated by green shading), first (FTL) and last (LTL) timing of light exposure at a particular threshold (indicated by the downward orange and upward blue arrows), individual photoperiod (IP) as the duration of time between the FTL and LTL at a particular threshold (indicated by the maroon band), and mean light timing revised (MLiTR, brown parentheses) as the mean of timestamps when light exposure is at or above a particular threshold.
The timing of light exposure also differs by sex
In addition to duration of time spent in different light environments, the IP and timing of light also differed by sex. Across all ages, bright light exposure began later and ended earlier in the day for females compared to males, resulting in a shorter individual photoperiod in bright light. Among participants aged 16 and older, on average, the IP1000 for females was approximately 18% shorter than that for males (male IP1000 = 4.71 h (95% CI: 4.31, 5.10); female IP1000 = 3.87 h (95% CI: 3.52, 4.22); Table 2, Fig. 3). The first daily timing of bright light exposure for females occurred 30 min after that for males (male FTL1000 = 11:10AM; female FTL1000 = 11:40AM; Table 2, Fig. 3) while the last daily timing of bright light exposure occurred approximately 21 minutes earlier (male LTL1000 = 3:44PM; female LTL1000 = 3:23PM; Table 2, Figs. 3 and 4). While the IP at the 10 lux light level did not show sex differences, some of the FTL and LTL measures did show differences, suggestive of later FTL and LTL for dim light for females (Table 2). Similar to the FTL metrics, MLiTR also differed by sex, although mean differences were smaller compared to other measures (Table 2). Mean timing of moderate and dim light, but not bright light, differed by sex in participants aged 16 and younger (MLiTR100 mean difference = 0.19 h (95% CI: 0.06, 0.32), p = 0.005; MLiTR10 mean difference = 0.24 h (95% CI: 0.12, 0.35), p = 0.0002). However, in participants 16 and older, mean timing of bright light, but not dim or moderate light, differed by sex, with males have earlier timing compared to females (MLiTR1000 mean difference = 0.09 (95% CI: 0.03, 0.15), p = 0.006; Table 2).
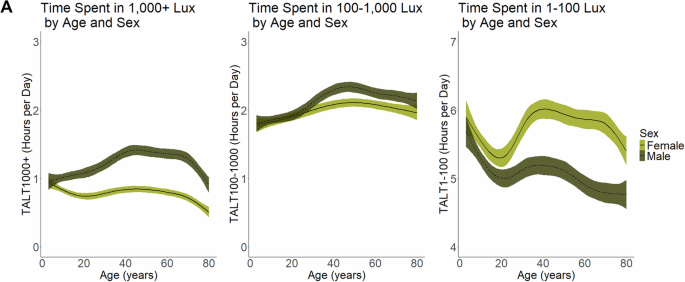
Plots showing the (A) daily average duration (hours) of time spent above a light threshold (TALT) at different illuminance levels (≥1000 lux, 100 to <1000 lux, and 1 to <100 lux) across ages and by sex (unweighted for sample weights). Dashed lines indicate males and solid lines indicate females. Colored shading around black line (mean) indicates the 95% CI.
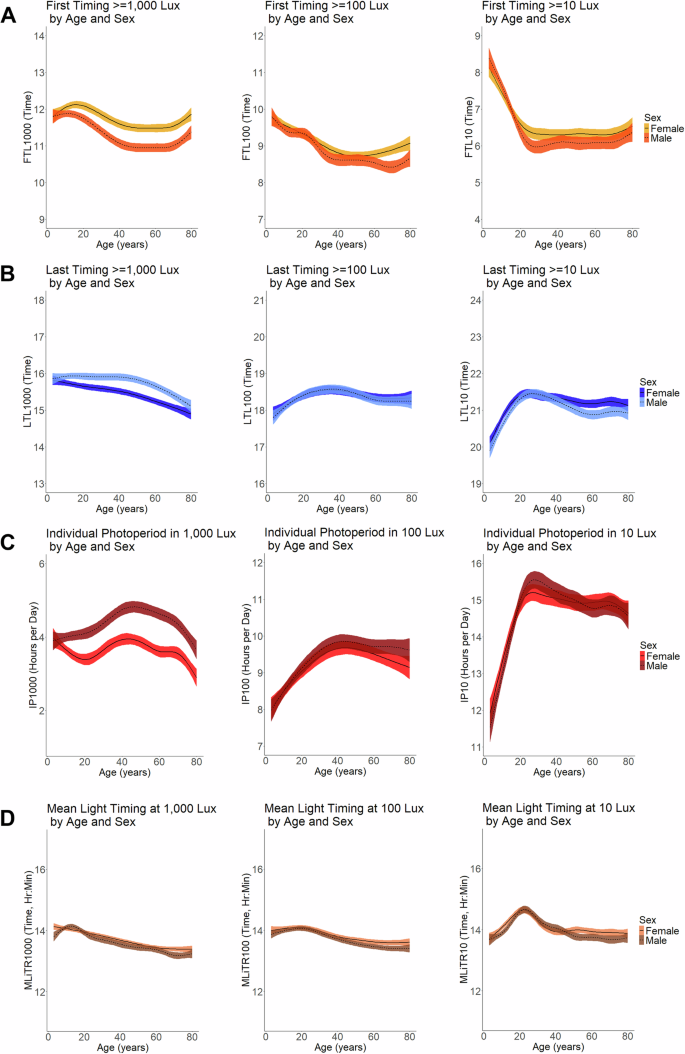
Plots showing the daily average A first timing of light (FTL) exposure, B last timing of light (LTL) exposure, C the individual photoperiod (IP), and D the mean light timing revised (MLiTR) by different light intensity thresholds (≥1000 lux, ≥100, and ≥10 lux) across ages and by sex (unweighted for sample weights). Y-axes for the FTL (A), LTL (B), and MLiTR (D) measures indicate time of day in Hour:Minute values (e.g., a value of 14 = 14:00 = 2PM); Y-axis for the IP (C) measures indicate duration (e.g., amount of time in number of hours). Dashed lines indicate males and solid lines indicate females. Colored shading around black line (mean) indicates the 95% CI.
Time spent outdoors due to occupation may partially explain sex differences in light exposure
To better understand the factors that may be related to sex differences in light exposure, self-reported data on time spent outdoors, work and physical activity, and actigraphy-measured sleep duration and activity were analyzed among participants 16 and older. Self-reported minutes spent outdoors from 9AM-5PM (workdays and non-workdays), self-reported vigorous or moderate work activity, self-reported vigorous or moderate recreational activity, and actigraphy-measured activity were each positively associated with greater time spent in bright light; conversely, greater self-reported time in sedentary activity and actigraphy-measured sleep duration were negatively associated with TALT1000 (Supplementary Table 3). Self-reported walking or biking to go places did not show an association with TALT1000. Males spent 94 more minutes outside from 9AM-5PM on workdays (male workday time outdoors = 187.5 min (95% CI: 170.2, 204.7); female workday time outdoors = 93.3 min (95% CI: 86.1, 100.5); difference in means = −94.2 min (95% CI: −111.6, −76.7), p = 3.12e−12) and 53 more minutes outside on non-workdays (male non-workday time outdoors = 194.3 minutes (95% CI: 186.3, 202.3); female non-workday time outdoors = 141.3 min (95% CI: 135.7, 146.9); difference in means = −53.0 min (95% CI: −61.7, −44.2), p = 1.65e−13) compared to females, for a total difference of >2 h greater outdoor time (9AM-5PM) for males than females during the week. When each of these variables was included as a covariate in separate linear regression models testing the association of sex with TALT1000, the greatest attenuation in the effect of sex occurred after adjusting for minutes spent outdoors from 9AM-5PM on workdays, followed by total minutes spent outdoors from 9AM-5PM (workdays and non-workdays). In contrast, adjustment for self-reported sedentary activity, vigorous or moderate work activities, vigorous or moderate recreational activities, or actigraphy-measured activity and sleep duration did not greatly attenuate the association (Supplementary Table 4), suggesting that time spent outside due to work at least partially explained sex differences in light exposure.
Discussion
Females spent less time in bright light and more time in dim or low light compared to males across age, with males having approximately 52% greater time spent in bright light. This sex difference in bright light exposure existed across most race and ethnicity groups. The average timing for the day’s first bright light was also later for females, occurring approximately 30 min after males. While the exact causes of these differences in light exposure remain to be determined, they likely reflect sex differences in time spent indoors vs. outdoors.
It is important to note that sex differences in light exposure appear to begin in childhood, with females spending less time in bright light than males. These findings align with prior U.S.-based research on sex and gender differences, which has reported that girls have 15% lower odds of being taken outside for playtime by their caregivers compared to boys46 and spend less time outside on weekdays and weekends47. Possible reasons for these early life differences in outdoor play may be due to the child’s preferences, caregiver perception48, sexed assumptions or ideas about cleanliness49, safety concerns, and/or behavior modeling. There are also gender gaps in outdoor recreation50, with women less likely to engage in outdoor physical activity. These differences in behavior may be due to social conditioning and gender norms as well as barriers that discourage girls and women from partaking in outdoor activities. These differences in early-life light and indoor-outdoor exposure could plausibly influence developmental outcomes, such as vision51 and immune function52, as well later life health53. However, research on the developmental impacts of light exposure is in its early stages54.
While the data show clear differences in light exposure patterns for females and males, the specific reasons for these differences are difficult to ascertain from the available data. When factors related to work activity and physical activity were explored as potential reasons to explain the differences in bright light exposure, adjusting for minutes spent outdoors from 9AM-5PM on workdays showed the greatest attenuation of the effect of sex on TALT1000. In support of this, workers who are occupationally exposed to ultraviolet light (and have higher occupationally-related risk of skin cancer) are more likely to be male55. However, workday minutes outdoors did not fully explain the association between sex and bright light, suggesting that there are additional factors behind this relationship. For example, other characteristics of the workplace, such as proximity to windows, could contribute to occupational light exposure56,57. It is also unlikely that work or occupational factors are the sole explanation, as sex differences in light exposure also occurred in childhood and in older age (after general retirement age). Therefore, there are likely other factors at play that were not captured by the study design.
The finding that females spend more time in dim-moderate light environments (1–100 lux) likely reflects greater time spent indoors. This may be due to occupational factors (i.e., if males are more likely to work outside) or to other factors related to indoor activity (such as household chores). Males and females did not exhibit as much difference in the 100–1000 lux range, perhaps because this light level represents a mixture of indoor and outdoor environments for the GT3X+ device41. While the reported findings support occupational outdoor time as a partial mediator of sex differences in light exposure, additional work is needed to understand in more detail how occupational and leisure time relate to light exposure patterns and related sex differences.
The finding that light exposure is patterned by sex in a nationally-representative study has important implications for sleep and circadian research6,7,58,59,60,61,62,63,64,65 and the health effects of LAN. Because light exposure history can affect subsequent responses to light (such as the degree of melatonin suppression and phase shift64,66,67), sex differences in light exposure could lead to sex differences in physiological responses to light. It may also explain inconsistent results among studies. For example, research investigating sex differences in sensitivity to light exposure (assessed with dim light melatonin onset (DLMO)) have been mixed. some studies have shown a stronger suppression of DLMO in women compared to men after a ≥ 400-lux stimulus (but no difference at lower light intensities)68,69. In contrast, other studies have reported no effect of sex on DLMO light sensitivity70,71. Importantly, however, none of these prior studies examined pre-experiment light exposure history, which may be an important moderator of the effect of light on DLMO and could explain the discrepancies in results if light exposure history is associated with sex or gender. In support of this, a small experimental crossover study (n = 6 females, n = 6 males) did not report sex differences in melatonin suppression, perhaps because the study design attempted to maintain similar light exposure history in both males and females in the week prior to testing72. Because greater exposure to bright light during the day is believed to be protective against detrimental effects of exposure to LAN62,73, these findings also suggest that females may also be more vulnerable to LAN, although further investigation is needed. Future research on sex or gender differences in the response to light should consider evaluating light exposure history (and possible group differences) in the study design and analysis.
This study has several strengths and limitations. This analysis used objective light data measured at the individual level in real-world community-based settings from a large sample of participants. The data analyzed in this study is from a nationally-representative sample of the non-institutionalized U.S. population and includes a wide range of ages. However, light exposure in this study was measured from a wrist-worn device (ActiGraph GT3X+), which may not accurately capture light at the eye level. The GT3X device also has a red casing41, which may reduce its light measurement sensitivity74. Location and exact date data of measurement were not available, so the influence of location and specific time of year on the results was not thoroughly investigated. Time-related (circular) measures were compared in the same way as linear variables, which may introduce some bias. There were also limited variables available to explore more nuanced reasons for the sex differences in light exposure. Additionally, information regarding timing of work, workdays versus free or non-workdays, or shiftwork was not available. The findings from this study also reflect the U.S. population and may not be generalizable to other countries.
In summary, light exposure patterns differ by sex in the U.S., with females receiving less bright light and later timing of bright light than males. These sex differences exist across age and race and ethnicity, with sex differences in bright light exposure emerging in childhood. While the causes of these sex differences in light exposure are unclear, they may be related to sex differences in time spent indoors vs. outdoors. Further work is necessary to validate these findings in other populations and to investigate the upstream causes driving these sex differences in light exposure. These findings have important implications for public health, health disparities, and sleep and circadian research and underscore the importance of considering light as a fundamental component of the environment and the human exposome.
function: approaches for future therapeutics")

Responses