Local structural flexibility drives oligomorphism in computationally designed protein assemblies
Main
Polyhedral protein assemblies have evolved in nature to shield macromolecules from the surrounding environment, to spatially control chemical reactions and to display macromolecules. These sophisticated functions have inspired the scientific community to explore natural protein assemblies for biotechnological and medical applications such as drug delivery, enzyme encapsulation and structure-based vaccine design1,2,3. However, the portfolio of natural protein assemblies is limited and often resistant to substantial modification, restricting their use in target applications.
In the last decade, protein engineering methods have been developed that allow the generation of new polyhedral protein assemblies with structural properties tailored to specific applications. In particular, computational protein design can be used to generate novel self-assembling proteins with atomic-level accuracy4. Symmetric protein docking followed by protein–protein interface design has been used to generate polyhedral protein assemblies across a range of sizes, from small homomeric assemblies (~10 nm) to cage-like architectures constructed from up to four components larger than some viruses5,6,7,8,9,10,11,12. Powerful new machine learning-based methods for protein backbone13,14,15 and sequence16,17,18,19 generation promise to make the design of custom self-assembling proteins faster and easier, enabling the generation of protein-based nanomaterials of increasing sophistication by researchers in a variety of disciplines.
Since their emergence, computationally designed polyhedral protein assemblies have been customized for numerous applications, such as encapsulation of cargos of different sizes and hydrophobicities9,20,21,22 improved circulation and tissue targeting in vivo20,23, cellular delivery9,24,25, enhanced receptor-mediated signaling14,26,27, molecular scaffolding for structure determination28,29,30, enzymatic colocalization31,32 and multivalent antigen presentation33,34,35,36,37,38, including in multiple vaccines currently in clinical development39,40 or licensed for use in humans41,42,43. Although these examples showcase the practical utility of computationally designed protein assemblies, all of them used rigid building blocks that assemble with strict point group symmetry, a feature that may limit their use in certain applications. For example, the packaging capacities of such assemblies are predefined by their sizes and inner volumes; thus appropriate self-assembling protein scaffolds must be chosen or designed for each encapsulation problem.
By contrast, many naturally occurring protein assemblies involved in cargo packaging and transport are constructed from building blocks with inherent structural flexibility, enabling them to adapt to target cargos by adopting a range of architectures. For example, the capsid proteins of many viruses can assume several closely related folds that break local symmetry and form different types of protein–protein contacts to self-assemble into multiple architectures44,45,46,47,48. This polymorphism has been previously exploited to encapsulate a variety of cargos in virus-like particles, including large DNA origami nanostructures49,50,51. Clathrin provides another clear example of protein coat adaptability: flexible clathrin triskelia interact with one another to drive the formation of coats that enclose membrane vesicles of varied curvatures and thus transport cargos of varied sizes52,53. Indeed, clathrin coats explore a vast assembly space and are observed to form fullerene cages (polyhedra containing 12 pentagonal faces and variable numbers of hexagonal faces) spanning multiple symmetry groups.
Beyond natural protein assemblies, flexibility and the resulting polymorphism have been recurring themes in bioengineering approaches from DNA nanotechnology to protein engineering. Symmetric five-point star DNA motifs containing central single-stranded loops have been shown to assemble into icosahedra or larger polymorphic architectures in a flexibility- and concentration-dependent manner that requires in-plane asymmetric deformations of the five-point star tiles54. Similar observations were made for a pair of complementary trimeric coiled-coil peptides that self-assemble into cage-like particles when mixed55,56. In MS2 bacteriophage virus-like particles it has been shown that engineered changes in the interconversion of symmetric to asymmetric capsid protein dimers, arising from conformational changes in the FG-loop, shift the assembly toward larger architectures50. In a remarkable tour de force, a polymorphic nonviral protein capsid derived from a bacterial lumazine synthase was evolved to form a monodisperse assembly that encapsulates its own RNA and protects it from degradation57. Reduced porosity and increased loading capacity arose during evolution through the acquisition of structural flexibility within individual subunits that could accommodate four related but distinct folds. Finally, the pioneering approach of designing novel protein assemblies by genetically fusing the subunits of two distinct protein oligomers in predefined orientations has also been shown to result in polymorphic assemblies when semiflexible linkers are used58,59,60. Indeed, in some cases, the assemblies can be locked into a single conformation by rigidifying the linker between the two domains61.
In spite of the examples described above, there are currently no computational protein design methods that controllably integrate structural flexibility to achieve multiple assembly outcomes. Here we characterize three designed self-assembling proteins that form multiple unanticipated structures that substantially deviate from the intended architectures. We find that the observed architectures can be explained by constrained structural flexibility within each building block. These observations, and the successful rescue of monomorphic assembly on redesign of the identified flexible region in one building block, suggest that modulating structural flexibility may be a general route to the controllable design of oligomorphic protein assemblies.
Results
During the course of our work designing novel protein nanoparticles, we observed that while most experimentally validated designs accurately assemble into the intended architecture, in a small number of cases the assemblies deviate from the design model. To understand the cause of these deviations, we set out to characterize in detail three such cases. KWOCAs 18 and 70 are two one-component assemblies intended to form icosahedral and octahedral architectures from trimeric building blocks, respectively62, while I32-10 is a two-component assembly designed to form an icosahedral nanoparticle from trimeric and dimeric building blocks7 (Fig. 1a). Dynamic light scattering (DLS) and size-exclusion chromatography (SEC) of the purified proteins suggested that in all three cases, self-assembly resulted in mostly homogeneous assemblies (Fig. 1b,c). However, the measured average hydrodynamic diameter was substantially larger (25, 32 and 37 nm for KWOCA 18, KWOCA 70 and I32-10, respectively) than expected from the design models (21, 13 and 25 nm, respectively). Furthermore, small-angle X-ray scattering (SAXS) profiles revealed that the experimentally observed architectures possessed structural features that markedly deviate from the design models (Fig. 1d). Negative stain electron microscopy (nsEM) confirmed that each design assembles into well-defined, finite architectures, but that the assembly outcomes did not conform to the design models and in the case of I32-10 were clearly heterogeneous (Fig. 1e). Two-dimensional (2D) class averages defined unexpected structural aspects of the resulting assemblies: small nonspherical assemblies in the averages of KWOCA 18 did not match projections calculated from the icosahedral design model, KWOCA 70 exhibited apparent pentagonal pores that are inconsistent with the designed octahedral assembly and averages of I32-10 contained unexpected hexagonal pores in addition to the pentagonal pores expected for the intended icosahedral symmetry. Although we have previously observed that deviations in designed protein interfaces can lead to large architectural deviations62, here the coexistence of features with different apparent symmetries led us to speculate that the observed architectures arise from structural flexibility within the building blocks. All three assemblies are formed from trimeric scaffolds with a similar two-domain topology: a central helical bundle that functions as a trimerization domain and a separate helical domain that contains the protein–protein interface driving assembly at the twofold axis of symmetry of the intended polyhedral architecture (Fig. 1f and Extended Data Table 1). In KWOCAs 18 and 70, the trimeric scaffolds were designed by helical fusion and sequence redesign between the two domains63, which may introduce packing defects at the junction. In I32-10, the naturally occurring trimeric scaffold (Protein Data Bank (PDB) ID 1SED) contains a small interface and hinge-like loop between the two domains that closely resembles the architecture of collectins, in which flexibility between the two domains is known to be related to carbohydrate binding64. We thus hypothesized that flexibility within each trimeric building block drives assembly toward the observed alternative and heterogeneous conformations.
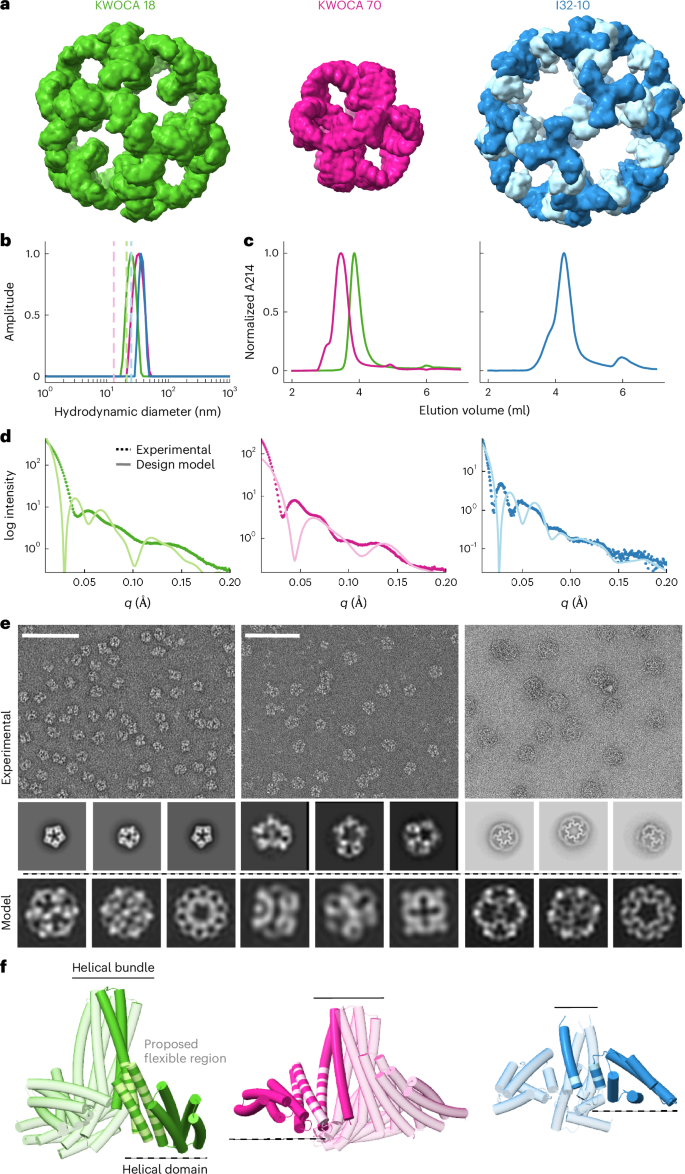
a, Design models of the de novo one-component assemblies KWOCA 18 and KWOCA 70 (ref. 62) and the two-component assembly I32-10 (ref. 7). b–e, DLS (b), SEC traces (c), SAXS profiles (d) and nsEM micrographs and representative 2D class averages (e) obtained for each design. Hydrodynamic diameters, SAXS profiles and 2D projections calculated from the computational design models are shown in light color in b, d and e. Scale bars in e, 50 nm. Each measurement was repeated at least three independent times. f, Representation of the two-domain structure of each trimeric building block. One subunit of each trimer is shown in a darker shade with the regions proposed to be structurally flexible highlighted in light color.
To determine whether structural metrics used during novel protein nanoparticle design could detect potential sites of flexibility, we first analyzed the interdomain region of each of the trimeric scaffolds using AlphaFold2 (AF2)65 and the Rosetta software suite66. Overall, AF2 predicted all scaffolds with high confidence (Fig. 2a), as assessed by the average predicted local distance difference test (pLDDT) (93, 95 and 94 for KWOCA 18, KWOCA 70 and I32-10, respectively). Previous work has correlated the degree of flexibility and the presence of unstructured regions with AF2 pLDDT at the residue level67,68,69. We thus compared in more detail the prediction accuracy within the hypothesized regions of flexibility (that is, the junction and hinge regions) with that of core regions within each scaffold, and observed that the former present on average lower pLDDT scores. Rosetta-calculated solvent accessible surface area and average degree (that is, the number of neighboring residues within 10 Å) additionally revealed that the junction and hinge regions appear to be more exposed to solvent and less well embedded in the protein structure than the core regions, further supporting our flexibility hypothesis (Fig. 2b).

a,b, AlphaFold2 multimer predictions (a) and Rosetta-calculated SASA and average degree (b) suggest that the hinge regions hypothesized to be flexible are under-packed. Average per-residue values with standard deviation for the regions defined in Extended Data Table 1 are plotted. c–e, Cryo-EM micrographs and density maps obtained for KWOCA 18 (c), KWOCA 70 (d) and I32-10 (e). The number of building blocks making up each assembly and its overall symmetry are indicated above each density map. Scale bars: cryo-EM micrographs, 50 nm; density maps, 5 nm. f–i, Native MS (f,g) and charge detection mass spectra (h,i) obtained for KWOCAs 18 (f,h) and 70 (g,i). Each peak is labeled with a symbol indicating the number of trimers in the corresponding assembly species. j, Distributions of internal angles in wireframe representations of the expected and observed assemblies. Wireframe assemblies are colored as in c–e, and an example internal angle is indicated for the designed icosahedral assembly of KWOCA 18.
To understand the assemblies further, we characterized them by cryogenic-electron microscopy (cryo-EM) (Fig. 2c–e). Micrographs of each assembly embedded in vitreous ice confirmed our assessment that they all form well-defined, finite, but apparently heterogeneous assemblies. Three-dimensional (3D) reconstructions at resolutions of 7–8 Å (Extended Data Figs. 1 and 2 and Table 1) revealed that KWOCAs 18 and 70 do not assemble into the originally intended architectures, but instead form two distinct assemblies each, comprising both square- and pentagon-like pores: KWOCA 18 forms species with D5 and D2 symmetry assembled from 10 and 12 trimers, respectively (Fig. 2c), while KWOCA 70 forms species with D2 and D3 symmetry assembled from 12 and 14 trimers, respectively (Fig. 2d). For I32-10 we obtained six different cryo-EM maps at resolutions between 7 and 15 Å (Extended Data Fig. 3), revealing even greater heterogeneity: in addition to the originally intended icosahedral architecture (20 trimers + 30 dimers), I32-10 was also observed to form one tetrahedral (28 trimers + 42 dimers), three dihedral (26, 32 and 36 trimers + 39, 48 and 54 dimers, respectively) and one low-symmetry cyclic (30 trimers + 45 dimers) architectures all belonging to the series of fullerene cages (Fig. 2e). The internal angle distributions within wireframe models of each observed architecture highlights the flexibility required to form them (Fig. 2j). Specifically, although all internal angles are identical in the original design models due to their perfect symmetry, each of the other architectures requires a unique set of multiple internal angles. It is also important to note that in these architectures, trimeric building blocks often delineate neighboring pores of different shapes, breaking local symmetry. These observations establish that the trimeric building blocks of KWOCAs 18 and 70, and potentially the trimeric building block of I32-10, are capable of adopting multiple quasisymmetric conformations.
We then turned to native mass spectrometry70 (nMS) to determine whether species beyond those observed by EM were present. Consistent with the numerous assemblies observed by cryo-EM, I32-10 yielded a broad spectrum with no resolvable peaks and was not analyzed further. For KWOCA 18, three distinct assemblies containing 28, 30 and 36 subunits were readily identified in the m/z range between 12,000 and 16,500 (Fig. 2f). After charge-state deconvolution, the acquired masses of these three architectures were 827, 886 and 1,064 kDa, respectively. These measured masses are highly consistent with the calculated masses (<0.3% deviation). In the case of KWOCA 70, two different assemblies formed by 36 and 42 subunits were abundantly present in the m/z range between 14,000 and 18,500 (Fig. 2g). After deconvolution of charge states, masses of 1,137 and 1,327 kDa were obtained, respectively, both within 0.1% of the expected masses for these assembly states. Simulated mass spectra composed of three or two architectures accompanied by the calculated mass shifts fit very well the measured native mass spectra for KWOCA 18 and 70, respectively (Extended Data Fig. 4a). Our stoichiometry assignments were further confirmed by both Orbitrap-based single molecule charge detection MS for directly acquiring mass distribution histograms (Fig. 2h,i)71,72 and tandem MS experiments, in which precursor ions within a certain m/z range were specifically selected by a quadrupole linear ion trap for the higher-energy collisional dissociation (HCD) fragmentation (Extended Data Fig. 4b). Both nMS spectra additionally showed a wide distribution of less abundant peaks in the lower m/z range (Extended Data Fig. 4c). For KWOCA 18, all oligomers from trimer to decamer could be assigned, suggesting the addition or ejection of single subunits from assembly intermediates rather than trimeric building blocks. By contrast, the number of subunits observed in smaller assembly intermediates of KWOCA 70 were all multiples of three, suggesting that the trimeric building block of KWOCA 70 is more stable than that of KWOCA 18. The relative instability and continuous distribution of assembly states may explain the presence of the 28-mer species observed for KWOCA 18. Overall, these results support our observation that each design, despite its intrinsic structural flexibility, does not form disordered aggregates but instead assembles into multiple highly ordered architectures.
Intrigued by these oligomorphic assemblies, we used a combination of molecular dynamics and rigid-body fitting to cryo-EM density to investigate the origin of the flexibility. We hypothesized that there could be three main sources of flexibility: (1) around the threefold axis (trimeric helical bundle), (2) around the twofold axis between neighboring trimers (designed protein–protein interface) and (3) within the subunit, at the connection point between the two domains (junction or hinge region). To identify inherent structural fluctuations, we performed molecular dynamics simulations for each trimeric and dimeric building block as well as the interfaces formed between them (Fig. 3a,e,i and Extended Data Fig. 5). While the simulations suggest that the individual domains are rigid, with average root mean square deviations (r.m.s.d.s) of approximately 1 Å (Extended Data Fig. 5), large fluctuations between trimer arms were observed. Indeed, root mean square fluctuations along the sequence of each monomer, which measure the average deviation of each residue from its reference position, revealed that small fluctuations within the subunit add up to large deviations at the ends of the trimer arms, the sites of the designed protein–protein interfaces that drive nanoparticle assembly (Fig. 3b,f,j and Extended Data Table 1). The fluctuations observed in the interface and I32-10 dimer trajectories were overall lower in magnitude than those observed in the trimer simulations. Given the observed fluctuations, we speculated that it should be possible to reconstruct each of the observed assemblies using a small number of structural snapshots from the molecular dynamics trajectories. Indeed, one and two trimeric and two and five interface snapshots were sufficient to build well-fitting models for the cryo-EM densities of the D5 and D2 assemblies of KWOCA 18, respectively (Fig. 3c,d and Extended Data Fig. 6a). Modeling the D2 and D3 assemblies of KWOCA 70 required four and four trimeric and five and four interface snapshots, respectively (Fig. 3g,h and Extended Data Fig. 6b). Analyzing the internal angles within the snapshots used to build the models further revealed that a considerable proportion deviate from the average angles observed in the molecular dynamics trajectories, highlighting that the subunits must flex to form each architecture. More specifically, superpositions of individual chains revealed that the main source of flexibility is not at the three- or twofold protein–protein interfaces, but rather the junction region within the subunit between them (Extended Data Fig. 6a,b). Notably, using rigid bodies extracted from the original, perfectly symmetric design models yielded structures that fit worse to the experimental cryo-EM densities, with large alignment defects and clashes that would prevent assembly (Extended Data Fig. 6c–f). Given the lower resolution of the cryo-EM maps obtained for I32-10 it was more difficult to accurately dock α helices, so we took a simpler approach to model construction. Instead of structural snapshots from the molecular dynamics trajectories, we used two building blocks extracted from the original design model, specifically chosen to introduce degrees of freedom at the main point of flexibility in the trimeric subunit: the hinge region. These building blocks comprised (1) the central three-helix bundle of the trimeric component and (2) the entire dimeric component along with the two interacting globular domains of the adjacent trimeric components (Extended Data Fig. 6a). Rigid-body fitting using these building blocks recovered all six of the observed architectures (Fig. 3l and Extended Data Fig. 7). Our ability to reconstruct the experimentally observed architectures for all three systems using building blocks that introduce flexibility at the junction or hinge region, as opposed to perfectly symmetric rigid building blocks, strongly implicates this flexibility as the source of oligomorphic assembly.

Overlaid molecular dynamics trajectories obtained for trimeric (dark) and dimeric (light) building blocks and the interfaces between them (a,e,i), respective root mean square fluctuations (r.m.s.f.) (b,f,j), internal angle distributions (c,d,g,h,k) and assembly models (c,d,g,h,l) for each observed species for KWOCA 18 (a–d), KWOCA 70 (e–h) and I32-10 (i–l). Internal angles within the molecular dynamics trajectory snapshots used to build the KWOCA 18 and KWOCA 70 models are highlighted with dashed lines in the respective angle distributions in c,d,g,h.
Given the limited number of architectures we detected by nMS and cryo-EM for KWOCAs 18 and 70, we asked what other structures might be present and at what frequency, focusing on the KWOCAs since I32-10 adopts a wider variety of architectures, likely forming even more than we were able to visualize by cryo-EM. To do so, we enumerated polyhedral architectures with regular pentagonal and square faces and evaluated their compatibility with the respective building blocks of the two systems. The key assumption behind our approach was that the geometric features of the most populated species detected by nMS and cryo-EM represent the most energetically favorable conformations of the constituent proteins. We focused on two geometric features in particular. First, we defined S as the sum of the internal angles α, β and γ between the three subunits of each trimeric building block (Fig. 4a). S therefore depends on the shape of the trimer and would equal 360° if the trimer were ‘flat’, becoming smaller (since α, β and γ become more acute) as the trimer ‘stretches’ due to flexibility within its subunits (Fig. 4b). We calculated S for each trimeric building block in the KWOCA models fit into the cryo-EM reconstructions in Fig. 3c,d and found that it ranged from 278° to 288° in KWOCA 18 and from 305° to 312° in KWOCA 70 (Fig. 4c). In each case, these ranges deviated from the single values expected from the originally designed icosahedral (277°) and octahedral (318°) architectures, respectively.

a, Hypothetical KWOCA architectures can be described by the sum of internal angles between the subunits of the trimer, S (left) and the dihedral angle δ at the interface between neighboring trimers (right). The internal angle between neighboring local threefold symmetry axes, φ, is characteristic of each polyhedral architecture. b, The trimer subunits of KWOCA 18, KWOCA 70 and I32-10 (shown for comparison) differ in S. c, The multiple values of S observed experimentally for KWOCAs 18 and 70, compared to the single values of the perfectly symmetric design models, highlight the flexibility of these proteins. d, The average δ necessary to obtain each architecture is shown. Green and pink ranges highlight the regime in the experimentally observed architectures. The 16-trimer architecture cannot be formed without extreme asymmetry (that is, θ values well beyond the experimentally observed ranges). The dashed lines indicate the δ of the design models for KWOCA 18 (20 trimers) and KWOCA 70 (eight trimers). In both cases, S is outside the range of the experimentally observed architectures.
We used these experimentally observed ranges of S to approximate the structures of hypothetical KWOCA 18 and 70 assemblies in a series of polyhedral architectures comprising 8, 10, 12, 14, 16 and 20 trimers that includes the experimentally observed architectures for each protein (Fig. 4d). We placed ‘trimers’ (Methods) on each vertex of these architectures with α, β and γ reflecting the angles of the underlying scaffold polyhedron. From these structures we calculated the second key geometric feature, δ, which represents the ‘interface angle’ defined by the internal angle between the two ‘subunits’ that meet at the interface between two neighboring trimeric building blocks (Fig. 4a). δ therefore also depends on the shape of the trimeric building block, namely S, as well as φ, the fixed internal angle between neighboring vertices in each polyhedral architecture. There is a further degree of freedom affecting α, β and γ that stems from two contacting trimer arms rotating about an edge by an angle θ (Extended Data Fig. 8a), which asymmetrizes the trimer angles away from those of the underlying scaffold. θ both affects the value of S and creates a twist in the concerned trimer arms. The estimated accessible range of θ, gauged from the cryo-EM structures of each protein, was 0–20° in KWOCA 18 and 0–12° in KWOCA 70 (Extended Data Fig. 8b). We posit that substantial deviations in δ from the values observed in the cryo-EM models in Fig. 3c,d would not be tolerated, as this would require distortion of the designed interfaces that drive assembly. We therefore estimated the feasibility of realizing each architecture by comparing the averaged values of δ calculated across each type of vertex to those derived from the most populated architectures observed experimentally. The range of average δ in the experimentally observed KWOCA 18 architectures was 56–60°, while average δ ranged from 74–79° in the KWOCA 70 architectures (Fig. 4d). However, δ fell outside the observed ranges for each of the other polyhedral architectures. For KWOCA 18 the average δ would have to shrink by 9° or expand by 3° to access the next architectures in the series, whereas for KWOCA 70 δ would have to shrink by 3° to access the 10-trimer architecture and no angle was found to satisfy the 16-trimer architecture without requiring extreme asymmetry of the trimer arms. The latter would only be feasible if θ increased by at least 119% for KWOCA 18 and 148% for KWOCA 70 above the maximal value in the observed range. Combined with our experimental data, these results indicate that flexibility of the trimeric building blocks and the designed interfaces between them is constrained, leading to the formation of a small number of distinct, well-defined architectures rather than a wide variety of polymorphic assemblies.
Our modeling predicted that eliminating flexibility in the junction region of our trimeric building blocks would allow us to recover monomorphic, fully symmetric assemblies. To test this hypothesis, we redesigned the trimeric building block of KWOCA 70 to rigidify its junction region by generating alternative backbone conformations with RFdiffusion13, followed by ProteinMPNN19 sequence redesign (Fig. 5a and Methods). Initial experimental screening of 15 designs (Supplementary Table 1) identified KWOCA 70 D7 as particularly promising: DLS and SEC suggested the presence of mostly homogeneous assemblies of smaller hydrodynamic diameter than KWOCA 70 (19 versus 32 nm, respectively) (Fig. 5b,c). nsEM revealed that KWOCA 70 D7 formed the intended assembly with octahedral geometry, as indicated by the clear fourfold projections observed in 2D class averages that closely resembled those calculated from the original design model (Fig. 5d; compare to Fig. 1e). While Rosetta analysis did not show appreciable differences in the per-residue solvent accessible surface area (SASA) or average degree of the KWOCA 70 D7 junction compared to the original KWOCA 70 design, we did observe an improvement in the average pLDDT such that it was indistinguishable from the core region (Fig. 5e). Together, these results support our hypothesis that modulating local structural flexibility can be used as a design principle to control polyhedral assembly outcome.

a, Model of an individual subunit of KWOCA 70 D7, highlighting changes relative to the original KWOCA 70 design at both the backbone and sequence levels. b–d, DLS (b), SEC traces (c) and nsEM (d) representative 2D class averages for KWOCA 70 D7. The hydrodynamic diameter calculated from the computational design model is shown in gray in b, while the experimentally observed diameter of KWOCA 70 is shown in dark pink. Scale bar in d, 100 nm. e, AlphaFold2 multimer confidence prediction (pLDDT), but not Rosetta-calculated SASA and average degree, suggest packing improvements in the junction region of KWOCA 70 D7. Average per-residue values with standard deviation for the regions defined in Extended Data Table 1 are plotted.
Discussion
Here we describe how inherent structural flexibility within protein building blocks leads to the formation of a small number of well-defined architectures in computationally designed protein assemblies. While excessive flexibility is expected to result in off-target incomplete assembly or disordered aggregates73,74, our results indicate that constrained flexibility results in oligomorphic rather than polymorphic assembly outcomes. This has been previously demonstrated in DNA nanotechnology, where introducing flexibility in the form of short single-stranded segments within trimeric tiles enabled the generation of several distinct polyhedral architectures54. While current computational protein design methods mostly focus on combining symmetry with rigid building blocks to accurately design specific target structures4, the assemblies we describe here are quasisymmetric in that their protein building blocks have multiple related but distinct conformations. Among the best-studied quasisymmetric protein assemblies are icosahedral virus capsids, many of which are fullerene-like architectures constructed from a single capsid protein that forms pentameric and hexameric substructures consistent with icosahedral symmetry by adopting slightly different backbone conformations75. KWOCAs 18 and 70 and I32-10 employ quasisymmetry in a different way: the flexibility within each subunit allows for local asymmetry within the building blocks that enables the formation of assemblies with ring-like substructures of various sizes, shapes and numbers of subunits. In turn, this allows the formation not only of collapsed architectures as previously observed in fusion-based design approaches59,76, but also expanded ones that incorporate a larger number of subunits than originally intended. When compared to quasisymmetric viruses, which retain global icosahedral symmetry, these architectures are symmetrically and morphologically distinct, including several that to our knowledge have not been previously observed in natural protein assemblies. The latter observation highlights how this design principle could be applied prospectively to explore a large space of quasisymmetric architectures previously inaccessible to design (Fig. 6).

Each point represents a hypothetical sequence–structure pair. Points are clustered to represent different types of architecture. Ferritin and O3-33 are provided in the fully symmetric assembly space as examples of natural and designed self-assembling proteins with octahedral symmetry. KWOCAs 18 and 70 and I32-10 form multiple distinct architectures, as indicated by the several highlighted points for each. For comparison, we highlight clathrin, which shares multiple architectures with I32-10. The unbounded nature of the quasisymmetric space represents the essentially infinite possible architectures.
Such architectures and the unusual oligomorphism we observed suggest intriguing prospects for designing adaptable protein assemblies tailored to specific applications. For example, naturally occurring self-assembling systems built of intrinsically flexible scaffolds, best exemplified by clathrin, adapt to and encapsulate cargos of different sizes52,53. Clathrin assembles on the cytoplasmic side of intracellular vesicles, forming a coat that facilitates vesicle formation and transport. Designed proteins that form adaptable clathrin-like assemblies with defined size ranges could potentially be used as bio-orthogonal systems for encapsulating membrane-bounded vesicles, or could conceivably encapsulate other classes of biomolecules such as nucleic acids or ribonucleoprotein complexes9,25,77. It is intriguing to consider that interactions between such cargos and oligomorphic protein coats may shift the distribution or even type of architectures formed by the coats, allowing them to adapt to cargos of various kinds and sizes. The design principles that we have outlined here will allow this and other hypotheses to be tested, potentially leading to novel adaptable designed protein nanomaterials that can be tailored to specific applications.
Methods
Protein purification and low-resolution characterization
Bacterial expression and purification have been performed as previously described for each nanoparticle7,62. Briefly, pET29b plasmids containing the genes encoding for each design were transformed in Lemo21(DE3) E. coli (NEB) competent cells. Single colonies from agar plate with 100 mg l−1 kanamycin were inoculated in 50 ml of TB II media supplemented with 50 mg l−1 of kanamycin (Sigma). For I32-10, protein expression was induced by addition of 0.5 mM isopropyl-thio-β-d-galactopyranoside (Sigma) when cell growth reached and optical density of 0.8 nm (OD0.8) at 37 °C and was allowed to proceed for 3–5 h. For the KWOCAs, proteins were expressed by autoinduction by additionally supplementing the media with 50×5052, 20 mM MgSO4 and trace metal mix, at 18 °C for 24 h after initial growth for 6–8 h at 37 °C. Cells were gathered by centrifugation at 4,000g and lysed by sonication or microfluidization after resuspension in lysis buffer (50 mM Tris pH 8.0, 250 mM NaCl, 20 mM imidazole, 5% glycerol), followed by addition of bovine pancreatic DNaseI (Sigma-Aldrich) and protease inhibitors (Thermo Scientific). Clarified lysate supernatants were batch bound with equilibrated Ni-NTA resin (QIAGEN). Washes were performed with 5–10 column volumes of lysis buffer, and then eluted with 3 column volumes of the same buffer containing 500 mM imidazole. Concentrated or unconcentrated elution fractions were further purified using a Superose 6 Increase 10/300 GL (Cytiva) on an AKTA Pure (Cytiva) into 25 mM Tris pH 8.0, 150 mM NaCl and 5% glycerol.
SEC profiles for each purified assembly (Fig. 1) were obtained by high-pressure liquid chromatography on an Agilent Bio SEC-5 500 Å (for KWOCA assemblies), 1,000 Å column (for I32-10) (Agilent) at a flow rate of 0.35 ml min−1 by injection of 10 μl of purified eluate using a mobile phase of Tris-buffered saline (50 mM Tris pH 8, 150 mM NaCl, 5% v/v glycerol). For KWOCA 70 D7, a Superose 6 Increase column (Cytiva) was used instead.
DLS measurements were performed using the default Sizing and Polydispersity method on the UNcle (UNchained Labs). Then 8.8 μl of SEC-purified elution fractions was pipetted into the provided glass cuvettes. DLS measurements were run with ten replicates at 25 °C with an incubation time of 1 s; results were averaged across runs. Other DLS measurements were also obtained using a DynaPro NanoStar (Wyatt) or Zetasizer (Malvern Panalytical) setup, with ten acquisitions per measurement and three measurements per protein sample.
To identify the molecular mass of each protein, intact mass spectra were obtained via reverse-phase liquid chromatography with MS on an Agilent 6230B TOF on an AdvanceBio RP-Desalting column, and subsequently deconvoluted by way of Bioconfirm using a total entropy algorithm. For liquid chromatography, buffers were water with 0.1% formic acid and acetonitrile with 0.1% formic acid; the proteins were eluted using a gradient of 10 to 100% acetonitrile buffer over 2 min.
Selected SEC fractions were concentrated to 1–5 mg ml−1 in buffer containing 2% glycerol. The flowthrough was used as a blank for buffer subtraction during SAXS analysis. Samples were then centrifuged (13,000g) and passed through a 0.22 µm syringe filter (Millipore). These proteins and buffer blanks were shipped to the SIBYLS High-Throughput SAXS ALS Advanced Light Source in Berkeley, CA, USA to obtain scattering data78,79,80,81. Scattering traces were analyzed and fit to theoretical models using the FOXS 15 server (https://modbase.compbio.ucsf.edu/foxs/)82,83.
For nsEM, samples were diluted to 0.1–0.02 mg ml−1 and 3 µl was negatively stained using Gilder Grids overlaid with a thin layer of carbon and 2% uranyl formate as previously described84. Data were collected on an Talos L120C 120 kV electron microscope equipped with a CETA camera. Grids containing KWOCA 70 D7 were imaged on the BioTalos 120 microscope at the Interdisciplinary Center for Electron Microscopy at the École Polytechnique Fédérale de Lausanne (EPFL). The microscope operated at 120 kV and the magnification was set to ×57,000 with a resulting pixel size of 2.44 Å. All processing steps were performed in cryoSPARC v.3.2.0 (ref. 85).
Cryo-EM
Cryo-EM grids with KWOCA 18 and 70 samples were prepared on Vitrobot mark IV (Thermo Fisher Scientific). Chamber settings were as follows: T = 10 °C, humidity 100%, blotting force 0, wait time 10 s and blotting time 4–7 s. The KWOCA 18 sample was at a concentration of 4.93 mg ml−1 in 25 mM Tris pH 8.0, 150 mM NaCl and 2% glycerol, while KWOCA 70 was at a concentration of 4.58 mg ml−1 in 25 mM Tris pH 8.0, 150 mM NaCl and 5% glycerol. These samples were applied onto UltrAuFoil R 1.2/1.3 grids (Au, 300-mesh; Quantifoil Micro Tools GmbH). Before sample application, the grids were glow discharged using Ar/O2 plasma for 10 s on a Solarus 950 plasma cleaner (Gatan). 0.5 μl of 0.04 mM lauryl maltose neopentyl glycol stock solution was mixed with 3.5 μl of each KWOCA sample and 3 μl were immediately loaded onto the grids. Following the blotting step, the grids were plunge-frozen into liquid ethane cooled by liquid nitrogen.
KWOCA-containing grids were imaged on autoloader-equipped Talos Arctica transmission electron microscope (Thermo Fisher Scientific) operating at 200 kV. Raw video micrographs were collected on K2 summit direct electron detector (Gatan) operating in counting mode. Nominal exposure magnification was ×36,000 resulting in a pixel size of 1.15 Å at the specimen level. Automated data collection was performed using the Leginon package86. Data collection information is provided in Table 1.
Raw frames were aligned and dose weighted using MotionCor2 (ref. 87) and contrast transfer function parameters were estimated using GCTF88. Particle picking, 2D classification and generation of initial models were performed in cryoSPARC v.3.2.0 (ref. 85). Clean particle stacks were then transferred to Relion v.3.0 (ref. 89) for subsequent 3D classification and refinement steps. The KWOCA 18 dataset comprised 1,803 micrographs and yielded 300,970 clean particles going into 3D. This particle subset was subjected to three rounds of 3D classification without symmetry imposition (C1), resulting in two major classes comprising 10 or 12 trimeric building blocks with apparent D5 or D2 symmetry, respectively. These classes were subjected to 3D refinement with corresponding symmetry imposed. For KWOCA 70, we collected 2,364 micrographs and obtained 360,972 particles after initial processing in cryoSPARC. Following one round of 3D classification without symmetry imposition (C1) we resolved two subsets of particles featuring 12 and 14 trimeric building blocks with apparent D2 and D3 symmetry, respectively. These classes were also subjected to 3D refinement with corresponding symmetry imposed. The 3D refined maps of different assemblies of KWOCA 18 (D5 or D2) and KWOCA 70 (D2 and D3) were postprocessed (solvent masking and B factor sharpening) and used for docking of atomic models and subsequent interpretation. Data processing workflows and relevant map statistics are displayed in Extended Data Fig. 1.
The I32-10 specimen was initially prepared at a concentration of 2 mg ml−1 and was frozen using Lacey Carbon grids, coated with a thin layer of additional carbon. To ensure even distribution of particles in ice, the sample underwent two rounds of centrifugation, first for 20 min and then for an additional 30 min in the presence of 100 mM glycine. This was done before dilution and freezing, as these steps were shown to substantially reduce the presence of aggregated and/or flocculating nanoparticles. Grids were glow discharged for 25 s at 15 mA, and were subsequently blotted using conditions that included a 2–2.5 s blot time, maintaining 100% humidity in the chamber and using 1:30 and 1:50 dilution factors with a 10-s delay before blotting. After dilution, but before freezing, samples were kept on ice for approximately one additional hour to allow for further equilibration of this system, which manifested as a further reduction in the amount of visible aggregation and/or flocculation of I32-10.
Cryo-EM data for the I32-10 nanoparticle were collected using a Thermo Fisher Glacios 200 kV transmission electron microscope. The microscope was equipped with a direct electron detector camera and operated at a nominal magnification of ×36,000. A total of 3,381 videos were recorded during data collection. Micrographs were acquired at a defocus range of −0.8 to −1.8 µm to ensure optimal contrast. The data collection was performed using a pixel size of 1.16 Å per pixel. Data were collected in a single-hole, one-shot-per-hole mode with stage movement for each acquisition. A total measured dose of approximately 75 electrons per angstrom squared (e−/Å2) was measured during data collection.
Data processing and statistical analysis for I32-10 were conducted using a suite of computational tools and sorting methods. Initial 2D class averages and 3D ab initio models were generated using CisTEM. The preliminary symmetry classification identified the predominant nanoparticle species as likely having tetrahedral symmetry, resembling a truncated triaxis tetrahedra. The data were then imported into Relion, where a series of sequential and iterative 3D classification jobs were performed, with the truncated triakis tetrahedra map used as the input reference model for the first round of 3D classification. These initial iterations revealed the additional presence of a diverse set of nanoparticle assembly configurations that deviated from the reference tetrahedra and were supported by a large amount of heterogeneity visible in both the raw cryo-EM micrographs and subsequent cryo-EM 2D class averages. For further 3D reconstructions, an iterative approach was adopted to parse out probable alternative assembly geometries. Initial references for 3D classifications were always derived from previous iteration outputs, focusing on intact maps of nanoparticles displaying varying symmetry groups. Notably, all 3D classification steps were executed without applying symmetry operators and in the presence of one or more initial models to help guide classification. This iterative process occasionally necessitated revisiting 2D class averages, allowing for the selective removal of particles (based on their measured 2D diameters) to help more accurately 3D classify between nanoparticle assembly states. Throughout the data processing pipeline, a comprehensive suite of software tools was harnessed, including Relion, CisTEM and CryoSPARC. Following 3D classification and/or heterogeneous refinements within each software package, gold-standard 3D refinements were always performed, using the symmetry groups identified through a visual analysis of the outputs from asymmetric 3D classification runs. The resulting refined maps were then subjected to a final round of gold-standard 3D refinement, without applying any symmetry constraints. It is noteworthy that during this final refinement stage, the initial models underwent rigorous low-pass filtering. Maps and particles that did not reach a geometry resembling the symmetrically refined input map at this stage were promptly discarded. This decision stemmed from a reduced level of confidence due to the system’s flexibility, which led to the lower-than-expected resolution cryo-EM maps reported here and the inconsistency in achieving reproducible final map data.
Sample preparation for native and charge detection MS
KWOCA 18, 51 and 70 samples were buffer-exchanged into 150 mM aqueous ammonium acetate solution (pH 8) using Amicon 50 kDa molecular-weight cutoff centrifugal filters (Merck Millipore). Then, an aliquot of ~2 μl from each sample was directly introduced into a gold-coated borosilicate capillary (prepared in-house) for nano-electrospray ionization in positive ion mode. Eventually, all samples were analyzed on an Orbitrap Q Exactive UHMR mass spectrometer (Thermo Fisher Scientific).
Native MS data acquisition
Instrument parameters were optimized for the transmission of high-mass ions. Therefore, ion transfer target m/z and detector optimization was set to high m/z mode. The in-source trapping function was enabled with a desolvation voltage of −75 V. Nitrogen was used as the collision gas with pressure ranging from 2 to 5 × 10⁻¹⁰ mbar (ultrahigh vacuum readout). Particles were desolvated in the HCD cell with HCD energies between 100 and 125 V. For tandem MS measurements, charge-state distributions were isolated through a quadrupole linear ion trap and then those subunits from selected precursor ions were ejected with relatively high HCD energies ranging from 150 to 175 V. All data were recorded either at resolution settings corresponding to 16 or 32 ms of ion transients. A couple of scans were summed in the Xcalibur Qualbrowser to the final displayed mass spectra.
Charge detection MS data acquisition
A resolution of 200,000 at 400 m/z was set for 1 s ion transient. The noise level parameter was fixed at 0 and the pressure level was adjusted to about 1 × 10⁻¹⁰ mbar (ultrahigh vacuum readout). An in-source trapping voltage of −75 V was applied with optimized HCD voltage ranging from 100 to 150 V for maximal ion transmission. After the multi-scan acquisition, an appropriate calibration factor was applied, which correlates the measured intensities to the charges of individual single ions as previously described90. According to the determined charge state, the resulting formula mass = m/z × z − z was processed to calculate the mass of each particle, separately.
Molecular dynamics simulations
Each model was solvated in an octahedral periodic box of optimal point charge water and 150 mM NaCl using AmberTools18 (ref. 91) (for further details see Supplementary Table 3). Simulations were run at constant pressure (1 bar) and temperature (298 K) using the Monte Carlo barostat, the Langevin thermostat, a nonbonded cutoff of 10 Å and the ff19SB forcefield92. Using the CUDA enabled version of Amber18, four parallel simulations for each model were equilibrated using the AmberMDprep protocol93. Once equilibrated, the production simulations were run at 2 fs timestep for a total of 240 ns each, yielding an aggregate simulation time of 960 ns for each model simulations were processed using cpptraj91.
Model reconstruction for observed architectures
To generate reconstructed assemblies for KWOCA 18 and KWOCA 70 from the molecular dynamics simulations, snapshots from the production runs at 2 ns timesteps were fitted into the cryo-EM maps using the colores function in Situs v.3.1 (ref. 94). For each map, each unique trimer and dimer interface was masked and used for fitting across all snapshots. Snapshots were scored by cross-correlation, and the top 100 fits were used for stitching. The selected snapshots were then attempted for full reconstruction of the cage and adjacent trimer and dimers were scored by r.m.s.d. of an 20-residue helical region between the trimer and the assembly interface. Overall cages were then scored by overall r.m.s.d. of all stitched regions, and the cages with the lowest overall r.m.s.d. were selected for each unique nanocage.
To reconstruct each observed I32-10 architecture, we took a different approach to introduce flexibility in the system. Two building blocks extracted from the original design model were consequently fitted into the cryo-EM maps. First, the entire dimeric component along with the two interacting globular domains of the adjacent trimeric components were fitted into the maps using the colores function in Situs v.3.1 (ref. 94). Next, unique fits not overlapping with the vertices of the maps and correctly oriented were used to position the central three-helix bundles of the trimeric component, by minimizing the r.m.s.d. between the overlapping loop region between the two building blocks that were then stitched together.
All constructed models were finally relaxed, guided by the cryo-EM densities using Rosetta 3 (refs. 95,96).
Classification of polyhedral scaffolds for KWOCA cages
The scaffolds of KWOCA assemblies are polyhedra formed from regular pentagonal and square faces. They can be classified using Euler’s formula. Denoting by V, E and F the numbers of vertices, edges and faces in any given convex polyhedron, respectively, then V − E + F = 2. Let F4 and F5 be the number of squares and pentagons on the surface of the cage. Thus, V = (4F4 + 5F5)/3, E = (4F4 + 5F5)/2 and F = F4 + F5. Thus 2F4 + F5 = 12, implying the following solutions:
-
(1)
F4 = 6, F5 = 0: cube made of eight trimers
-
(2)
F4 = 5, F5 = 2: an assembly with D5 symmetry made of ten trimers
-
(3)
F4 = 4, F5 = 4: an assembly with D2 symmetry made of 12 trimers
-
(4)
F4 = 3, F5 = 6: an assembly with D3 symmetry made of 14 trimers
-
(5)
F4 = 2, F5 = 8: an assembly with D4 symmetry made of 16 trimers
-
(6)
F4 = 1, F5 = 10: it is not possible to form an assembly with these values
-
(7)
F4 = 0, F5 = 12: a dodecahedron (icosahedral symmetry) made of 20 trimers
All possible architectures are shown in Fig. 4d. Architectures are rendered using the Carbon Generator (CaGe) program97.
Mathematical reconstruction of assembly architectures
Mathematical models of KWOCA assemblies were reconstructed from the polyhedral scaffolds described above. In KWOCAs models, every trimeric protein building block is represented by three lines connecting the center of mass of its central helical bundle (Fig. 4a, shown in dark pink) with the centers of mass of the helices forming the interfaces to neighboring timers. To construct these models also for the cases when PDB files of the cages are not available, the vertices representing the centers of mass of the central helical bundles are positioned on the vertices of the polyhedral scaffold such that the helical bundle, when later mapped onto the mathematical model, aligns with the axis connecting the polyhedral center with its vertices. They are then rotated about and radially translated along this axis, such that lines in neighboring trimers meet on the lines bisecting the polyhedral edges at angle δ. We characterize the degree of flatness of the trimer in terms of the angle sum S = α + β + γ, where α, β and γ denote the angles between any two neighboring lines (Fig. 4a). The larger S, the flatter the trimer. To account for the flexibility of individual arms in the trimer, we introduce the angle θ (Extended Data Fig. 8). By rotating the triangle given by the arms meeting at δ and the corresponding polyhedral edge around that edge, we can obtain distinct decompositions of S.
A polyhedral scaffold is characterized by the angle φ between the axis connecting neighboring polyhedral vertices with the center of the polyhedral frame (Fig. 4a). Given values of S at any two neighboring vertices, δ at the connecting edge is completely determined and vice versa. Thus, by varying δ and θ we can determine the corresponding value of S.
KWOCA 70 redesign
To design rigid variants of KWOCA 70, we took two alternative approaches: (1) redesign the sequence only of the junction region (Extended Data Table 1) using ProteinMPNN19 (48 sequences); (2) partial diffusion of the junction region (as defined above or with flanking five residues both up and downstream) using RFdiffusion13 (24 backbones per definition) followed by sequence redesign of the diffused residues and five flanking residues using ProteinMPNN19 (48 sequences per backbone). Designed sequences were predicted using AF2 (ref. 65) (single sequence, no template and one recycle). From all designs with r.m.s.d. < 1 Å, the top five designs from approach 1 (KWOCA 70 OG 1–5) and top ten designs from approach 2 (KWOCA 70 D1–10) based on highest pLDDT scores and lowest ProteinMPNN score were selected (Supplementary Tables 1 and 2) for experimental validation as described above.
Reporting summary
Further information on research design is available in the Nature Portfolio Reporting Summary linked to this article.


Responses