Localized corrosion behavior and surface corrosion film microstructure of a commercial dual-phase LZ91 Mg alloy

Introduction
Owing to the low density of magnesium (Mg) (1.74 g/cm3), Mg alloys are important lightweight materials for applications that require weight reduction, such as consumer electronics, transportation, and military1,2,3,4,5. When alloyed with lithium (Li) (density 0.53 g/cm3), it not only further reduces the alloy density but also improves the plasticity of the Mg alloys6,7,8,9. In the binary Mg–Li alloy system, the phase constituent of the alloy is determined by the Li content6,9,10,11. When the Li content is between 5.5 and 10.3 wt%, the Mg alloy has a dual-phase structure composed of the HCP α-Mg and the BCC β-Li phases.
Even though the addition of Li and the presence of the BCC β phase improve the mechanical properties and formability of Mg–Li alloys6,7,8,9,12,13, the standard electrochemical potential of Li (−3.04 V vs. standard hydrogen electrode (SHE)) is even lower than that of Mg (−2.37 V vs. SHE)9,14, which increases the reactivity of Mg–Li alloys. Additionally, the dual-phase α + β structure further complicates the alloy corrosion behavior. It has been reported that binary Mg–Li alloys with a dual-phase structure (α + β) have faster corrosion rates than the single-phase (α or β) counterparts when tested in sodium chloride (NaCl) solutions15,16. The faster corrosion rates were attributed to the electrochemical activity difference between the α and β phases17,18 and the resultant microgalvanic effect.
Binary Mg-8 wt% Li alloys with a dual-phase α + β structure have been tested in 0.1 M NaCl solution to study the corrosion behavior17,18,19,20. Song et al.19 found that the localized (filiform-like) corrosion of Mg-8 wt% Li alloy initiated from the α and β phase boundaries and propagated towards the β phase. In contrast, Dong et al.18 reported that the localized corrosion preferentially propagated towards the α phase after initiation at the α/β interface. In the report by Wang et al.20, the corrosion process of Mg-8 wt% Li alloy showed two stages. In the early stage (less than 6 h of immersion), corrosion mainly occurred in the β phase. But with prolonged immersion (more than 6 h), the corrosion attack transferred to the α phase. This transition in the corrosion preference was attributed to the competition between the microgalvanic effect between the α and β phases and the gradual formation of a protective lithium carbonate (Li2CO3) surface film on the β phase17,18,20. Similar corrosion behavior was also reported for other binary Mg–Li alloys, including Mg-7.5 wt% Li15,16 and Mg-9 wt% Li21, that the localized corrosion initiated at the α/β interface or in the β phase, but more severe corrosion damage was observed in the α phase with prolonged immersion.
It is clear that the corrosion behavior of Mg–Li alloys is highly related to the surface corrosion film. Most studies13,16,22,23,24,25,26 in the literature focused on the microstructure of the surface corrosion film formed on β phase Mg–Li alloys because of its superior corrosion resistance. The surface corrosion film formed on a model β phase Mg–Li–aluminum (Al)-yttrium (Y)-zirconium (Zr) alloy was deeply investigated after being immersed in 0.1 M NaCl solution13,22,23,25. Through microstructure characterizations, the surface corrosion film formed on the Mg–Li–Al–Y–Zr alloy was shown to have a multilayer structure with an outermost Li2CO3 layer, an outer porous needle-shaped magnesium hydroxide (Mg(OH)2) layer, an Al-rich intermediate layer, and a compact inner layer that may contain Mg(OH)2, magnesium oxide (MgO), Li2CO3, and Mg hydroxy-carbonate13,22,23. Furthermore, Li was found to enrich in the outer portion of the surface corrosion film13,22,23, and Li2CO3 signals are stronger with prolonged air exposure22,25. The Li2CO3 was proposed to form through the reaction between lithium oxide (Li2O) and atmospheric carbon dioxide (CO2)13,25, and the protectiveness of the surface corrosion film was attributed to the presence of Li2CO313 or the improved stability of Li-doped MgO25. Similar results were also observed for β phase Mg-11 wt% Li26 and Mg-14 wt% Li16,24 alloys after being immersed in 0.1 M NaCl solution that Li2CO3 enriched in the outer portion of the surface corrosion film. Nevertheless, Li et al.16,26 proposed that the protectiveness of the surface corrosion film comes from the sealing of porous Mg(OH)2 by the Li-containing compounds, such as Li2CO3 or lithium hydroxide (LiOH). In contrast to the single-phase β Mg–Li alloys, the microstructure of surface corrosion films formed respectively on the α and β phases in dual-phase Mg–Li alloys is less understood and needs further characterization.
Even though extensive research has been performed on the corrosion behavior of dual-phase Mg–Li alloys, most studies used binary Mg–Li alloys15,16,17,18,19,20,21 or model Li-containing Mg alloys27 in a less aggressive 0.1 M NaCl solution. It is yet to be confirmed if commercially available dual-phase Mg–Li alloys show a similar corrosion behavior as the model alloys and how they perform in a more aggressive and commonly used test condition, i.e., 3.5 wt% NaCl solution. Therefore, in this study, a commercial LZ91 Mg alloy designed for portable electronics, which contains 9 wt% Li and 1 wt% zinc (Zn), was tested in a 3.5 wt% NaCl solution. The relationship between the localized corrosion behavior of the LZ91 alloy and the microstructure of the surface corrosion films formed on the α and β phases was investigated by combining electrochemical measurements, in situ optical microscopic (OM) observations, and microstructure characterizations.
Results
LZ91 alloy substrate analysis
A representative optical metallographic (OM) image of the studied LZ91 alloy after etching is shown in Fig. 1. The LZ91 alloy has a dual-phase microstructure consisting of the α (white regions) and β (dark regions) phases10,17,19,20,28,29,30. The two phases distribute irregularly in the alloy, with the α phase surrounded by a continuous β phase. From the appearances of the two phases, the phase fraction of the β phase in the LZ91 alloy was quantified as 66.2 ± 1.8%, which is close to the expected phase fraction calculated by the lever rule10,21,31.

OM image of the LZ91 alloy (etched with acetic glycol for 3 s).
The Volta potential difference between the α and β phases in the LZ91 alloy was measured by scanning Kelvin probe force microscopy (SKPFM), and the results are shown in Fig. 2. The SKPFM scanning area was marked by the red square in the optical microscopic (OM) image in Fig. 2a, in which the α phase is on the left, and the β phase is on the right. Figure 2b shows the Volta potential map of the scanning area. Similar to previous reports17,18, the α phase, which appears brighter in Fig. 2b, has a higher Volta potential than the β phase, indicating that the β phase should be more active than the α phase during immersion in the corrosion test solution. The Volta potential line profile across the α/β interface (arrow in Fig. 2b) shows that the Volta potential of the α phase is about 300 mV higher than that of the β phase (Fig. 2c). The Volta potential difference between the two phases can be related to the corrosion behavior and will be discussed in the “Discussion” section.
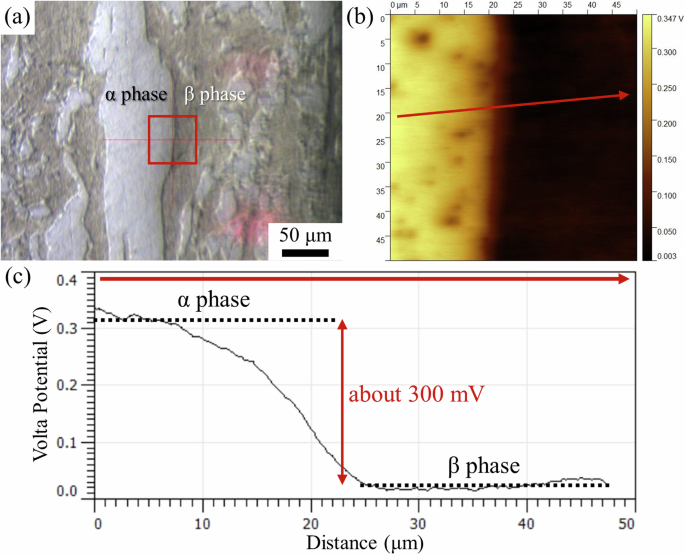
a OM image of the LZ91 alloy with the red square showing the SKPFM scanning area (left: α phase, right: β phase), b SKPFM Volta potential map across the α/β interface, and c Volta potential line profile along the arrow in (b).
Electrochemical tests and localized corrosion behavior
A representative open circuit potential (OCP) evolution of the LZ91 alloy immersed in 3.5 wt% NaCl solution is shown in Fig. 3a. In the early stage of immersion (before 12 h), the OCP of the LZ91 alloy gradually increases from −1.74 V vs. SCE to −1.63 V vs. SCE. After 12 h and 3 min of immersion, there is a sudden drop in OCP from −1.63 V vs. SCE to about −1.65 V vs. SCE, and the OCP oscillates vigorously until the end of immersion.
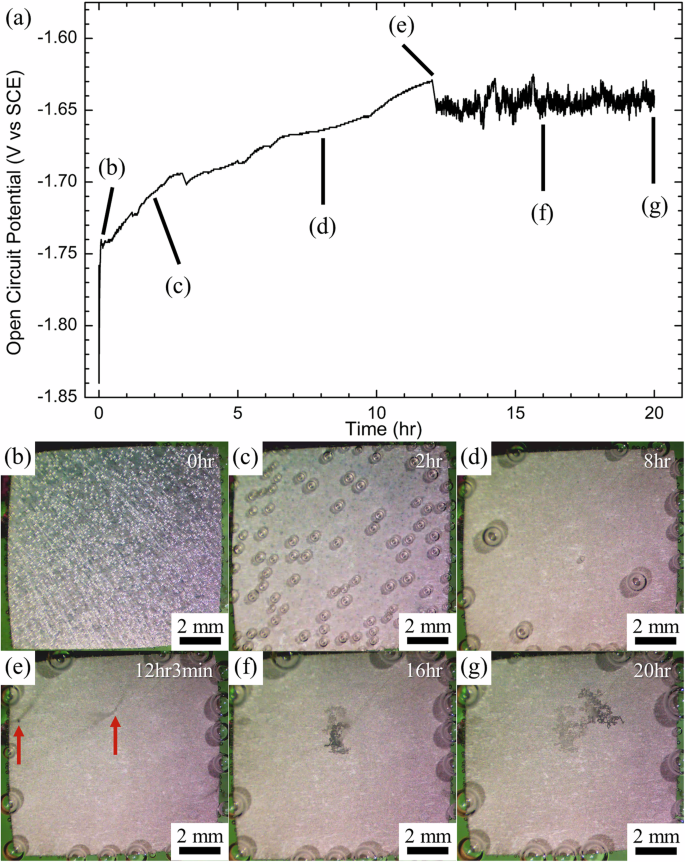
a OCP evolution of the LZ91 alloy immersed in 3.5 wt% NaCl solution. A sudden OCP drop occurs at about 12 h and 3 min of immersion, which matches the occurrence of localized corrosion in (e). In situ stereomicroscope observations of the LZ91 alloy immersed in 3.5 wt% NaCl solution for b 0 h, c 2 h, d 8 h, e 12 h 3 min (occurrence of localized corrosion pointed by the arrows), f 16 h, and g 20 h.
During OCP measurements, the surface corrosion morphology of the LZ91 alloy was in situ monitored with a stereomicroscope, and the snapshots at different immersion times are shown in Fig. 3b–g. Upon immersing the LZ91 alloy in the test solution (0 h, Fig. 3b), the alloy surface is covered with many small hydrogen bubbles from the reaction between the alloy and the test solution. With increasing immersion time, the number of hydrogen bubbles decreases with a few large hydrogen bubbles left (2 h and 8 h, Fig. 3c, d). Also, the surface of the alloy turns gray, indicating the formation of the surface corrosion films. After 12 h and 3 min of immersion, a few localized corrosion regions initiate on the alloy surface (arrowed in Fig. 3e), accompanied by rising streams of hydrogen bubbles from the regions. The initiation of localized corrosion regions matches when the OCP suddenly dropped (Fig. 3a). The localized (filiform-like) corrosion regions then expand with increasing immersion time while rising streams of hydrogen bubbles evolved at the propagation fronts (16 h and 20 h, Fig. 3f, g)32. Similar results were observed in repeated experiments, in which the sudden drop in OCP and initiation of localized corrosion occur after 8 to 12 h of immersion.
Electrochemical impedance spectroscopy (EIS) and potentiodynamic polarization curve measurements were performed on samples after 6 and 24 h of immersion, and the results are shown in Fig. 4. These two immersion times were selected to compare the electrochemical behavior of the alloy before and after the occurrence of localized corrosion. EIS Nyquist plots after 6 and 24 h of immersion are shown in Fig. 4a. At an immersion time of 6 h, the Nyquist plot displays two capacitive loops, with the low-frequency capacitive loop corresponding to the presence of protective surface corrosion films on the alloy16,24,30,33. In contrast, after 24 h of immersion, the Nyquist plot shows a single capacitive loop with some data points in the fourth quadrant, indicating a low-frequency inductive behavior coming from the dissolution of the alloy substrate after the occurrence of localized corrosion15,16,19,20,21,24,26,28,33,34,35.

a EIS Nyquist plots and b potentiodynamic polarization curves of the LZ91 alloy immersed in 3.5 wt% NaCl solution for 6 h and 24 h, which are before and after the occurrence of localized corrosion.
As shown in the insets of Fig. 4a, two different electrochemical equivalent circuits33 were used to fit the EIS data at the two immersion times, with the border colors matching the fitted EIS data. In both equivalent circuits, R1 is the solution resistance (Rs). Before the occurrence of localized corrosion (6 h), the constant phase element CPE1 represents the non-homogeneous double-layer capacitance, R2 represents the charge-transfer resistance (Rct), the other constant phase element CPE2 represents the non-ideal capacitance of the surface corrosion films, and R3 represents the surface corrosion film resistance (Rf). After the occurrence of localized corrosion (24 h), the interfacial properties and surface corrosion film are described together by CPE1 and R2, and the low-frequency inductive behavior is described by R4 and L1. The equivalent circuit fitting results and the calculated polarization resistances (Rp) are summarized in Table 1. The polarization resistance of the LZ91 alloy decreases substantially after the occurrence of localized corrosion, indicating an increase in the corrosion rate.
Potentiodynamic polarization curves of the LZ91 alloy after 6 and 24 h of immersion are shown in Fig. 4b. A passivation region was observed in the anodic branches for both polarization curves. Nevertheless, the passivation region for the alloy after 24 h of immersion is smaller than that after 6 h of immersion, indicating the protectiveness of the surface corrosion film reduces after the localized corrosion occurs. By Tafel extrapolation on the cathodic branches, the corrosion potentials (Ecorr), corrosion current densities (icorr), and estimated corrosion rates (Pcorr) were determined and shown in Table 2. The corrosion rate of the LZ91 alloy after 24 h of immersion is about twice that after 6 h of immersion, indicating the corrosion reaction rate accelerates after the occurrence of localized corrosion.
To further investigate the propagation of localized corrosion regions and their relationship to the α and β phases, in situ observations were performed with a high magnification OM, and a representative result is shown in Fig. 5. Before immersion (Fig. 5a), a region of interest containing a chunk of α phase was identified (enclosed by the red dashed lines in Fig. 5). In the early stage of immersion (Fig. 5b–d), the alloy surface turns darker with the formation of surface corrosion films. With further immersion, some localized corrosion regions initiate outside the OM field of view. Nevertheless, after being immersed for 13 h and 20 min (Fig. 5e), a localized corrosion region propagates upwards into the field of view and towards the identified α phase. Interestingly, when the localized corrosion region touches the α phase, it preferentially propagates inside the α phase region (Fig. 5f). After completely consuming the α phase, the localized corrosion region continues to propagate upwards in the alloy (Fig. 5g). After 24 h of immersion and removal from the test solution, the identified α phase region is clearly covered by corrosion products (Fig. 5h). The preferential propagation of localized corrosion in the α phase can be related to the alloy and surface corrosion film microstructure and will be discussed later in the “Discussion” section.
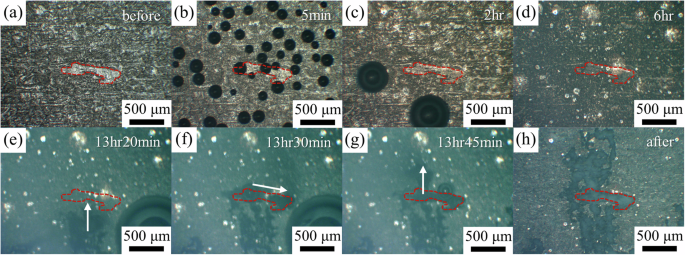
a Before immersion and after being immersed for b 5 min, c 2 h, d 6 h, e 13 h 20 min, f 13 h 30 min, and g 13 h 45 min. h After immersed for 24 h, the LZ91 alloy was removed from the solution.
Surface corrosion film microstructure characterizations
To understand the microstructure of the surface corrosion films and their relationships to localized corrosion behavior, LZ91 alloy was immersed in the test solution for 6 h, which was before localized corrosion occurred. Grazing incidence X-ray diffraction (GI-XRD) analysis of the surface corrosion film is shown in Fig. 6. Diffraction peaks of the α and β phases coming from the LZ91 alloy substrate were observed in the diffraction pattern. Besides, diffraction peaks corresponding to Mg(OH)2 and Li2CO3 were also identified, indicating that the surface corrosion films formed during immersion contain Mg(OH)2 and Li2CO3, similar to the reports in the literature22,23,29.
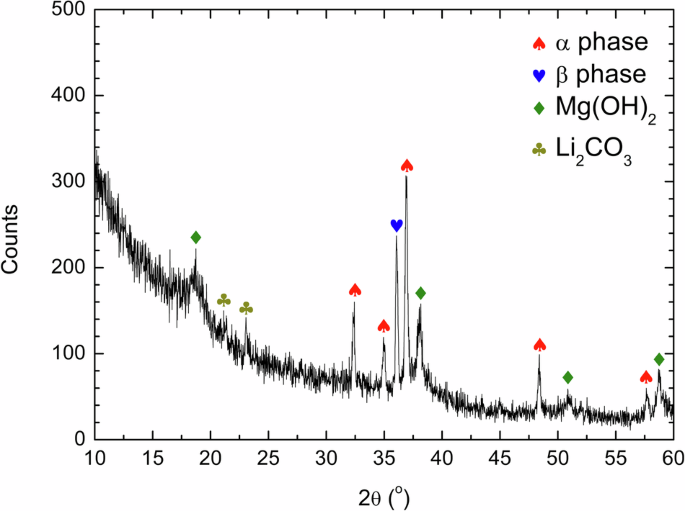
GI-XRD analysis of the surface corrosion film on the LZ91 alloy after immersion in 3.5 wt% NaCl solution for 6 h.
To further understand the chemistry and the binding states of the elements in the surface corrosion film, X-ray photoelectron spectroscopy (XPS) analysis was performed on the LZ91 alloy after immersion for 6 h, and the results were summarized in Fig. 7. At the surface of the corrosion films (Ar+ sputtering time 0 s, Fig. 7a, b), the carbon (C) 1 s and Li 1 s/Mg 2p ranges show signals of Li2CO3 (C 1 s 289.8 eV13,35,36 and Li 1 s 55.2 eV13,16,36) and Mg(OH)2 (Mg 2p 49.5 eV34,37), agreeing with the XRD analysis. The C 1 s range was also fitted with adventitious carbon38 that formed during sample transfer. However, after Ar+ sputtering, the C 1 s and Li 1 s signals quickly disappear, suggesting that Li2CO3 primarily exists near the surface of the corrosion films. After Ar+ sputtering for 1092 s (Fig. 7c), the Mg 2p range shows only the signal of Mg(OH)2, which should be the main component of the corrosion films. With further Ar+ sputtering (Ar+ sputtering time 3640 s, Fig. 7d), signals of magnesium oxide (MgO) (Mg 2p 50.8 eV39) and metallic Mg (Mg 2p 49.4 eV34,40) also show up in the Mg 2p range, indicating a gradual transition into the alloy substrate. In summary, XPS analysis shows that the outermost layer of the corrosion film contains Li2CO3 and Mg(OH)2, and the corrosion film underneath has a typical bi-layered Mg(OH)2/MgO structure on Mg alloys41,42,43,44.
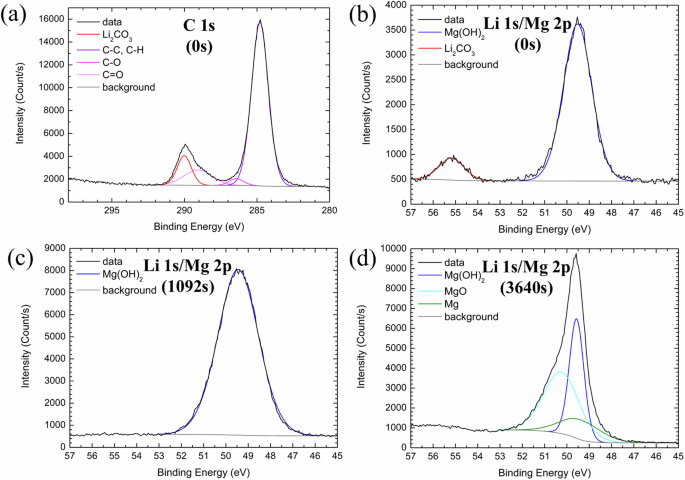
a C 1 s (0 s), b Li 1 s/Mg 2p (0 s), c Li 1 s/Mg 2p (1092 s), and d Li 1 s/Mg 2p (3640 s). The time in the parentheses indicates the Ar+ sputtering time.
The above GI-XRD and XPS analyses reveal the overall information about the surface corrosion films on both the α and β phases in the LZ91 alloy. To understand the differences in the surface corrosion films formed on the α and β phases, site-specific cross-sectional transmission electron microscope (TEM) samples were prepared with a scanning electron microscope/focused ion beam (SEM/FIB) system on the α phase, on the β phase, and across an α/β interface of the LZ91 alloy after immersion for 6 h. The SEM image of the cross-sectional TEM sample prepared across an α/β interface is shown in Fig. 8. From the cross-sectional SEM image (stage tilt = 52°), it can be found that the β phase corrodes deeper, and the surface corrosion film formed on the β phase (935 ± 47 nm) is thicker than that on the α phase (681 ± 75 nm).
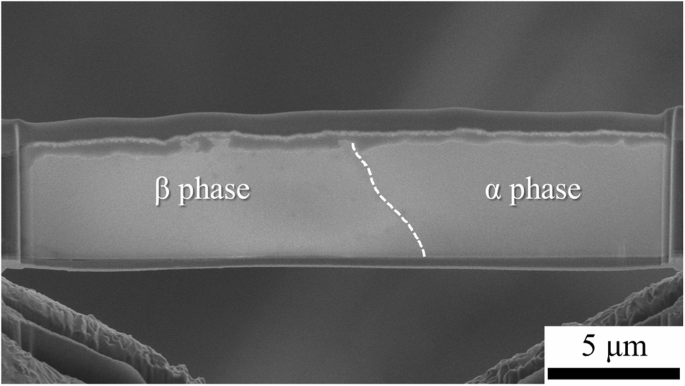
The dashed line marks the α/β interface in the alloy substrate.
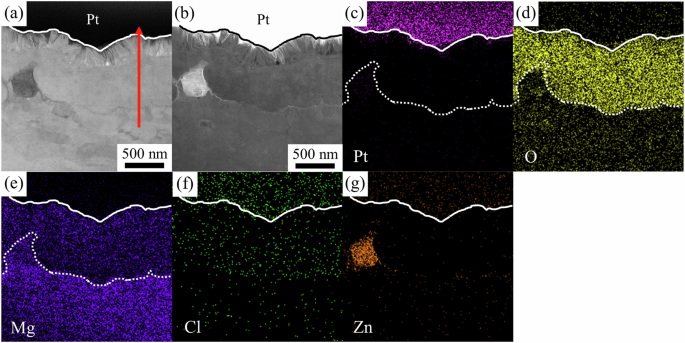
Cross-sectional scanning transmission electron microscope (STEM) and energy dispersive X-ray spectroscopy (EDS) analysis were performed on the samples prepared on the α and β phases, respectively. Figure 9 shows the results for the surface corrosion film on the α phase. Based on the contrasts of the bright field (BF) (Fig. 9a) and high-angle annular dark field (HAADF) (Fig. 9b) STEM images, the Pt/corrosion product interface is outlined with the solid lines, and the interface between the surface corrosion film/alloy substrate is outlined with the dotted lines in Fig. 9c–e. The surface corrosion film formed on the α phase can be divided into three layers: an outer needle-shaped layer, a thick middle layer, and a thin interfacial layer adjacent to the alloy substrate.
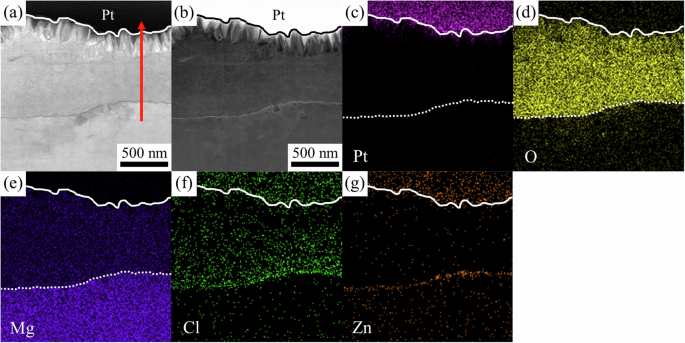
a BF- and b HAADF-STEM images and EDS mappings of c Pt, d O, e Mg, f Cl, and g Zn.
Figure 9c–g show the EDS mappings of individual elements in the sample. Pt signal (Fig. 9c) shows up mainly in the top Pt protection layer deposited during the TEM sample preparation. Some Pt signal was also detected in the outer needle-shaped layer owing to the penetration of Pt precursor gas into the needle-shaped structure during Pt deposition. The Pt precursor gas also contains C, so the C distribution is very similar to that of Pt; to avoid misinterpretation, the C map is not included in this report. The outer needle-shaped layer and the thick middle layer are mainly composed of O (Fig. 9d) and Mg (Fig. 9e), while the thick middle layer also contains some chlorine (Cl) (Fig. 9f). At the surface corrosion film/alloy substrate interface, the thin interfacial layer is rich in Zn (Fig. 9g). The Cl signal is also stronger close to this interfacial layer. Unfortunately, due to the limitation of EDS, the Li signal cannot be effectively collected, so the Li map is not included in this report.
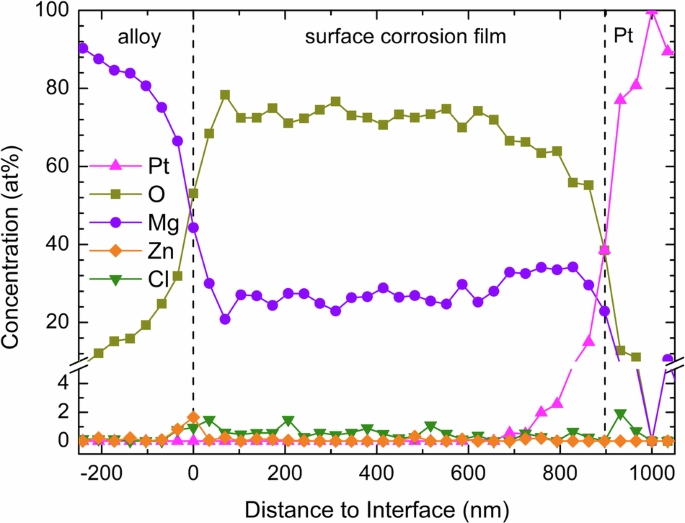
A quantitative concentration profile of the surface corrosion film on the α phase was generated from the EDS spectral image along the arrow in Fig. 9a and is shown in Fig. 10. Both the outer needle-shaped layer and the thick middle layer are mainly composed of O and Mg, and the O:Mg ratio is close to 2:1, indicating the surface corrosion film is primarily composed of Mg(OH)2, agreeing with the above XRD and XPS results. The Cl content in the middle layer is about 1–2 at% and close to 4 at% near the interfacial layer. At the surface corrosion film/alloy substrate interface, the Zn content is about 3 at%, and the O:Mg ratio is close to 1:1, agreeing with the XPS results that MgO presents near the alloy substrate.
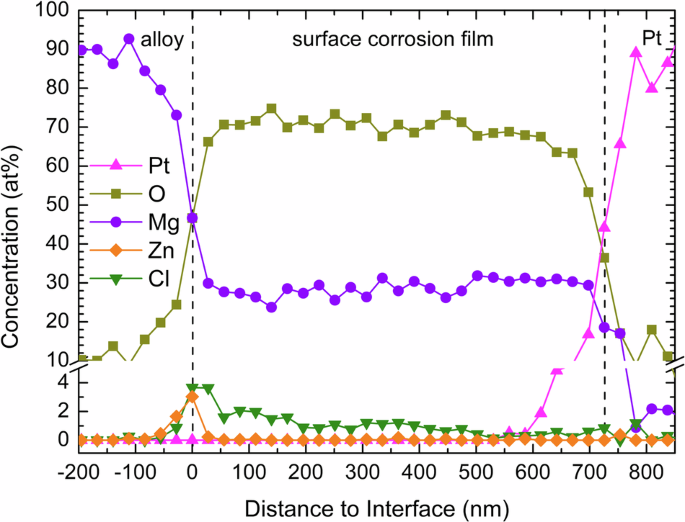
Concentration profile generated from the EDS spectral image along the arrow in Fig. 9a of the surface corrosion film on the α phase of the LZ91 alloy after immersion in 3.5 wt% NaCl solution for 6 h.
Figure 11 shows the cross-sectional STEM and EDS analysis for the surface corrosion film on the β phase. Again, from the contrasts of the BF (Fig. 11a) and HAADF (Fig. 11b) STEM images, the Pt/corrosion product interface is outlined with the solid lines, and the interface between the corrosion film/substrate is outlined with the dotted lines in Fig. 11c–e. The surface corrosion film on the β phase can also be divided into three layers: an outer needle-shaped layer, a thick middle layer, and a thin interfacial layer, which is very similar to that on the α phase. Furthermore, a Zn-rich particle was also found in the TEM lamellae.
a BF- and b HAADF-STEM images and EDS mappings of c Pt, d O, e Mg, f Cl, and g Zn.
Figure 11c–g show the EDS mappings of the sample. Similarly, Pt signal (Fig. 11c) shows up mainly in the top Pt protection layer and some in the outer needle-shaped layer. Again, the C distribution is similar to that of Pt, so it is not included in this report. The needle-shaped layer and the thick middle layer are mainly composed of O (Fig. 11d) and Mg (Fig. 11e). Some Cl signal (Fig. 11f) was also detected in the thick middle layer. Zn signal (Fig. 11g) shows up mainly in the Zn-rich particle. Nevertheless, enrichment of Zn at the thin interfacial layer can also be observed and confirmed by the concentration profile below.
The observed Zn-rich particle protrudes from the alloy substrate after corrosion and contains little O, indicating that the Zn-rich particle was locally protected due to the higher standard electrochemical potential of Zn (−0.76 V vs. SHE). However, Zn-rich particles are scarcely observed in the studied alloy and should play a relatively minor role in the corrosion behavior of the LZ91 alloy.
A quantitative concentration profile of the surface corrosion film on the β phase was generated from the EDS spectral image along the arrow in Fig. 11a and is shown in Fig. 12. Again, both the needle-shaped layer and the thick middle layer are mainly composed of O and Mg with a ratio close to 2:1 (Mg(OH)2). The Cl content in the middle layer is also about 1–2 at% but with less obvious enrichment towards the interfacial layer. At the corrosion film/substrate interface, similar to the sample on the α phase, the Zn content increases to about 2 at%, and the O:Mg ratio is close to 1:1 (MgO).
Concentration profile generated from the EDS spectral image along the arrow in Fig. 11a of the surface corrosion film on the β phase of the LZ91 alloy after immersion in 3.5 wt% NaCl solution for 6 h.
In summary, the surface corrosion films formed on the α and β phases in the dual-phase LZ91 alloy are very similar in the microstructure. The most significant difference between the surface corrosion films is the difference in the overall thicknesses (681 ± 75 nm for α phase and 935 ± 47 nm for β phase). The following section will discuss the relationship between the surface corrosion film microstructure and the localized corrosion behavior of the LZ91 alloy.
Discussion
Results of electrochemical measurements (Figs. 3a and 4) and in situ stereomicroscope observations (Fig. 3b–g) reveal the evolution of corrosion behavior of the LZ91 alloy immersed in 3.5 wt% NaCl solution within 24 h. Upon immersion in the NaCl solution, the LZ91 alloy reacts with the solution immediately, and many hydrogen bubbles form on the alloy surface from the reduction of water45,46 (Fig. 3b). As the immersion time increases, the OCP gradually increases (Fig. 3a), and the number of hydrogen bubbles on the alloy surface decreases (Fig. 3c, d), indicating the LZ91 alloy passivates with the formation of surface corrosion films. This corresponds to the two capacitive loops in the EIS Nyquist plot (Fig. 4a)16,24,30,33 and the anodic passivation region in the polarization curve (Fig. 4b) after 6 h of immersion that the formed surface corrosion films provide certain protection for the LZ91 alloy.
With prolonged immersion to 8–12 h, localized corrosion initiates on the alloy surface (Fig. 3e), which matches the time of sudden OCP drop (Fig. 3a), similar to the report on cast Mg-9 wt% Li in 0.1 M NaCl solution21. The initiation of localized corrosion is possibly due to the potential difference between the α and β phases, as revealed by SKPFM (Fig. 2). The localized corrosion regions propagate on the alloy surface afterward, with rising streams of hydrogen bubbles observed at the propagating fronts (Fig. 3f, g), which is similar to the localized corrosion behavior of other Mg alloys32. The fluctuation of OCP after the occurrence of the localized corrosion regions (Fig. 3a) can be related to the dynamic equilibrium between the active dissolution of the alloy and the formation of corrosion products in the localized corrosion regions26,47. The EIS Nyquist plot after 24 h of immersion (Fig. 4a), which is after the occurrence of localized corrosion, changes to a single capacitive loop with low-frequency inductive behavior, relating to the dissolution of the alloy15,16,19,20,21,24,26,28,33,34,35 and/or the relaxation of adsorbed ions33,48 in the localized corrosion regions. Also, after the initiation and propagation of localized corrosion on the LZ91 alloy, the polarization resistance measured by EIS decreases (Table 1), the anodic passivation region in the polarization curve shrinks (Fig. 4b), and the corrosion rate estimated by Tafel extrapolation accelerates (Table 2), indicating the protection of the surface corrosion films is overwhelmed by the acceleration of corrosion reaction in the localized corrosion regions.
The localized corrosion behavior of the LZ91 alloy is highly related to the microstructure of the surface corrosion films, which were characterized by different techniques before the occurrence of localized corrosion (6 h of immersion in 3.5 wt% NaCl solution). Combining GI-XRD (Fig. 6), XPS (Fig. 7), and cross-sectional STEM/EDS (Figs. 9–12) analyses, the surface corrosion films formed on the α and β phases both have a multilayer structure with an outer needle-shaped Li2CO3/Mg(OH)2 layer, a middle Mg(OH)2 layer, and a thin Zn-enriched MgO layer adjacent to the alloy substrate. Nevertheless, the β phase corrodes deeper, and the thickness of the surface corrosion film is thicker (935 ± 47 nm) than that on the α phase (681 ± 75 nm) (Fig. 8). The difference in corrosion depth and thickness can be attributed to the potential difference measured by SKPFM (Fig. 2) that the β phase with a higher Li content is more active than the α phase with a lower Li content upon immersion, resulting in a faster corrosion reaction and a thicker surface corrosion film on the β phase.
Even though Li cannot be effectively detected by EDS, GI-XRD (Fig. 6) and XPS (Fig. 7) revealed the presence of Li2CO3 in the surface corrosion films. However, C and Li XPS signals quickly disappear after Ar+ sputtering (less than 600 s), indicating that Li2CO3 primarily exists near the surface of the corrosion films. From cross-sectional STEM/EDS (Figs. 9–12), the outermost part of the surface corrosion film is the needle-shaped Mg(OH)2 layer. Therefore, the Li2CO3 should be at the surface or incorporated in the needle-shaped Mg(OH)2 layer, which is similar to the reports in the literature for binary Mg–Li alloys16,24,29,35 and Li-containing model alloys13,22,23,25,27 in 0.1 M NaCl solution.
Since the β phase in the LZ91 alloy has a relatively higher Li content (about 30 at% from the phase diagram10,21,31), it is believed that the surface corrosion film on the β phase has more Li incorporation in the outer needle-shaped Mg(OH)2 layer, thereby elevating the protectiveness of the surface corrosion film13,16,24,25,26. In contrast, even though Li incorporation in the needle-shaped Mg(OH)2 layer on the Li-containing α-Mg has been reported35, the Li content (about 15–16 at% from the phase diagram10,21,31) is close or slightly below the proposed minimum requirement (15–18 at% Li) based on Pilling-Bedworth ratio estimation25 to effectively improve the surface corrosion film stability and protectiveness. Therefore, combining the film thickness and the amount of Li incorporation, the surface corrosion film formed on the α phase should be less protective than on the β phase because it is thinner and has less Li incorporation in the outer needle-shaped layer.
Underneath the needle-shaped Li2CO3/Mg(OH)2 layer, a bi-layered Mg(OH)2/MgO structure was revealed by XPS (Fig. 7) and cross-sectional STEM/EDS (Figs. 9–12), which is typical for Mg alloys41,42,43,44. The MgO layer is very thin and adjacent to the alloy substrate. Noteworthily, Zn enrichment was found in the interfacial MgO layer for both corrosion films formed on the α and β phases (Figs. 9g, 10, 11g, and 12). The Zn enrichment is possibly due to selective dissolutions of the lower-potential Mg and Li that the higher-potential Zn was left at the corrosion film/alloy interface, similar to the reports on Zn-containing Mg alloys32,43,49,50,51. According to the literature, a small amount of Zn addition can effectively reduce the corrosion rates of Mg alloys52,53, including a BCC Mg-11 wt% Li alloy26, which could be related to the interfacial enrichment of Zn and possible interference with the corrosion reaction. Further investigation is required to clarify the role of Zn in these alloys.
In the literature, localized (filiform-like) corrosion was repeatedly reported for dual-phase Mg–Li alloys15,17,18,19,20,21,27,28,30. For binary Mg–Li alloys (e.g., Mg-7.5 wt% Li15 and Mg-8 wt% Li17,18,19,20), localized corrosion occurred and propagated across the alloy surface extensively in less than 4 h of immersion in 0.1 M NaCl solution. In this study, localized corrosion initiated on the LZ91 alloy not until 8–12 h of immersion (Fig. 3) in a more aggressive 3.5 wt% NaCl solution. Even after 24 h of immersion (Fig. 3g), most of the alloy surface was still intact from localized corrosion attack. The better resistance to localized corrosion initiation and propagation of the LZ91 alloy could be owing to the formation of protective surface corrosion films on both the α and β phases and the addition of Zn that interferes with the corrosion reaction. Additionally, keeping the impurity levels in the LZ91 alloy (Table 3) lower than the tolerance limits45,46,54,55 should also contribute to the better corrosion resistance of the alloy.
Still, the LZ91 alloy is not immune to localized corrosion due to the inherent potential difference between the α and β phases (SKPFM in Fig. 2) and the destabilization of the surface corrosion films from the chloride (Cl−) ions in the test solution. Cross-sectional STEM/EDS (Figs. 9f and 11f) revealed the presence of Cl in the surface corrosion films. After initiation, localized corrosion propagates across the alloy surface, consuming both the α and β phases. Nevertheless, from in situ OM observations (Fig. 5), when the localized corrosion encounters a chunk of α phase, it preferentially propagates inside the α phase region until complete consumption. The preferential propagation of localized corrosion in the α phase can be related to the discussion above that the surface corrosion film on the α phase is less protective than on the β phase. This preferential corrosion of the α phase after prolonged immersion is similar to previous reports on binary Mg–Li alloys15,16,17,18,20,21.
This study investigates the relationship between the localized corrosion behavior and the microstructure of surface corrosion films formed on the α and β phases in a commercial dual-phase LZ91 alloy immersed in 3.5 wt% NaCl solution by combining electrochemical measurements, in situ observations, and microstructure characterizations. The main findings can be summarized as follows:
First, from electrochemical measurements and in situ observations, the surface corrosion films on the LZ91 alloy formed during immersion in the test solution provide certain protection for the alloy substrate. However, localized corrosion initiates after being immersed for 8 to 12 h, and the corrosion rate accelerates after the occurrence of localized corrosion.
Second, the surface corrosion films formed on the α and β phases in the LZ91 alloy are similar and both composed of an outer needle-shaped Li2CO3/Mg(OH)2 layer, a middle Mg(OH)2 layer, and a thin Zn-enriched interfacial MgO layer. Nevertheless, the lower Volta potential and higher activity of the β phase results in a thicker and more protective surface corrosion film than on the α phase.
Last but noteworthily, during propagation, localized corrosion preferentially propagates in the α phase because of the thinner and less protective surface corrosion film.
Methods
Material
A commercial extruded LZ91 (Mg-9 wt% Li 1 wt% Zn) alloy, provided by Amli Materials Technology, was used in this study. The chemical composition of the LZ91 alloy was analyzed by inductively coupled plasma mass spectrometry (ICP-MS) and shown in Table 3. The impurity levels of common detrimental elements to Mg, such as iron (Fe), nickel (Ni), and copper (Cu), are fairly low in the alloy. The received LZ91 alloy plates have a dimension of 30 cm × 2 cm × 0.4 cm and were cut into 1 cm × 1 cm × 0.4 cm coupons for all experiments. The corrosion test solution was a 3.5 wt% NaCl solution prepared with reagent grade NaCl and deionized (DI) water.
Alloy substrate analysis
For metallographic observations, the LZ91 alloy was first ground with 400 grit sandpapers and mounted in a Buehler EpoThin 2 epoxy resin. The mounted sample was ground with sandpapers up to 2500 grit, polished with 3 μm and 1 μm diamond suspensions, and cleaned with DI water and ethanol. The sample was then etched with an acetic glycol etchant (1 mL nitric acid (HNO3) + 20 mL acetic acid + 20 mL DI water + 60 mL ethylene glycol) for 3 s56. After etching, the sample was observed by a SAGE Vision XP60 optical microscope (OM), and the image was analyzed by ImageJ software for phase fraction quantification.
To reveal the Volta potential difference between the α and β phases, the LZ91 alloy was ground with sandpapers up to 2500 grit, polished with 3 μm and 1 μm diamond suspensions, and cleaned with DI water and ethanol. Scanning Kelvin probe force microscopy (SKPFM) was performed with a Bruker Dimension ICON scanning probe microscope (SPM) with a 50 μm × 50 μm scanning area. The probe was a platinum (Pt)-coated silicon (Si) cantilever (Olympus OMCL-AC240TM) with a tip radius of 15 nm. The SKPFM results were analyzed and visualized using Gwyddion software.
Corrosion and electrochemical tests
For corrosion and electrochemical tests, the LZ91 alloy was first ground with 400 grit sandpapers and mounted in a Buehler EpoThin 2 epoxy resin with a Teflon-coated wire connected to the back. Before the tests, the sample was ground with sandpapers up to 2500 grit to expose an area of 1 cm × 1 cm. 150 mL of 3.5 wt% NaCl solution was used for all the tests. A Bio-Logic SP-150e potentiostat/galvanostat controlled by EC-Lab was used for open circuit potential (OCP), electrochemical impedance spectroscopy (EIS), and potentiodynamic polarization curve measurements. The electrochemical tests were performed with a three-electrode setup with the LZ91 alloy as the working electrode, a saturated calomel electrode (SCE) as the reference electrode, and a graphite bar as the counter electrode. All electrochemical tests were repeated at least three times to confirm the reproducibility of the measurements.
During the OCP measurements, an AmScope stereomicroscope or a SAGE Vision XP60 OM was used to in situ monitor the surface corrosion morphology. At different immersion times, EIS measurements were scanned from 100 kHz to 10 mHz with a perturbation amplitude of 10 mV. Electrochemical equivalent circuit fitting of the EIS data was performed with ZView software.
For potentiodynamic polarization curve measurements, the LZ91 alloy was immersed in the test solution for different immersion times and was polarized from OCP −0.5 V to OCP +0.5 V with a scan rate of 1 mV/s. The corrosion potentials (Ecorr) and corrosion current densities (icorr) were determined by Tafel extrapolation on the cathodic branches from Ecorr −0.1 V to Ecorr −0.2 V. The corrosion rates (Pcorr) of the alloy at different immersion times were estimated from the corrosion current densities by considering the density of LZ91 alloy and the average equivalent weight of the constituent elements:
Surface corrosion film microstructure characterizations
To understand the surface corrosion film microstructure, grazing incidence X-ray diffraction (GI-XRD) was performed with a Bruker D8 X-ray diffractometer (XRD) on an LZ91 sample immersed in the test solution for 6 h. The incidence angle of the Cu Kα X-ray (wavelength 1.541 Å) is 0.5° with a scanning angle (2θ) from 10° to 60° at a scan rate of 4°/min. X-ray photoelectron spectroscopy (XPS) was also performed on an LZ91 sample immersed in the test solution for 6 h with a Thermo Scientific K-Alpha X-ray Photoelectron Spectrometer. An argon ion (Ar+) gun with an energy of 3 keV was used to gradually remove the surface corrosion film for depth analysis. The XPS data were analyzed and fitted with CasaXPS software.
For site-specific cross-sectional analysis of the surface corrosion films, the LZ91 sample was immersed in the test solution for 6 h. A SAGE Vision XP60 OM was used to in situ monitor the sample surface before and during the immersion tests to identify the locations of the α and β phases. The regions of interest were identified in the scanning electron microscope (SEM), and cross-sectional transmission electron microscope (TEM) samples were prepared with standard liftout procedure57 using an FEI Helios NanoLab 600i dual-beam scanning electron microscope/focused ion beam (SEM/FIB) system. Cross-sectional scanning transmission electron microscopy (STEM) analysis was performed with a JEOL JEM-F200 operating at 200 kV. An Oxford X-MaxN energy dispersive X-ray spectroscopy (EDS) detector was used to analyze the elemental distribution in the surface corrosion films.


Responses