Long non-coding RNA AC133552.2: biomarker and therapeutic target in osteosarcoma via PANoptosis gene screening

Introduction
Osteosarcoma is children’s and adolescents’ most common primary bone malignancy1,2,3,4. Over the past few decades, advancements in multimodal therapies, including neoadjuvant chemotherapy, limb-salvage surgeries, and improved imaging techniques, have significantly enhanced localized disease management, increasing the five-year survival rate for non-metastatic cases to approximately 60–70%. However, these therapeutic advances have shown limited efficacy in addressing metastatic or recurrent disease, which continues to have dismal survival rates of less than 30%5,6. Furthermore, the molecular mechanisms underlying osteosarcoma progression and therapy resistance remain poorly understood. These challenges underscore the critical need for further research to elucidate the molecular biology of osteosarcoma, identify novel therapeutic targets, and develop more effective treatment strategies to improve outcomes for this vulnerable population.
PANoptosis, a recently characterized regulated cell death mechanism, integrates pyroptosis, apoptosis, and necroptosis and plays a critical role in maintaining cellular homeostasis7. Emerging evidence suggests that PANoptosis dysregulation contributes to tumorigenesis, tumor progression, and resistance to therapy in several cancers8,9,10,11,12. For example, pyroptosis-associated inflammasomes can influence the immune microenvironment in colorectal cancer, apoptosis modulation has been linked to therapeutic resistance in breast cancer, and necroptosis activation was found to regulate tumor progression in glioblastoma10,11,12. However, the role of PANoptosis in osteosarcoma remains poorly understood.
Long non-coding RNAs (lncRNAs) have gained recognition for their critical roles in regulating various cellular processes, including gene expression, cell cycle progression, and apoptosis13. Increasing evidence has implicated lncRNAs in the regulation of cell death pathways, including those associated with PANoptosis14. For example, lncRNAs have been shown to modulate apoptosis by interacting with crucial apoptotic regulators, while others influence pyroptosis and necroptosis through their effects on inflammasome components and signaling pathways15. The ability of lncRNAs to coordinate multiple cell death pathways suggests their potential as pivotal regulators in cancer progression, particularly in treatment resistance and metastasis16. Despite this, the specific mechanisms by which lncRNAs regulate PANoptosis-related processes in osteosarcoma are unexplored, presenting an essential area for further investigation.
This study comprehensively analyzed osteosarcoma mRNA and lncRNA expression profiles to identify PANoptosis-related molecular patterns associated with tumor progression and prognosis. A novel lncRNA-based signature was developed to predict patient outcomes and elucidate its mechanistic contributions to osteosarcoma pathogenesis. Furthermore, we validated the expression and functional roles of the identified lncRNA AC133552.2 using in vitro and in vivo models, providing critical insights into its potential as a diagnostic and therapeutic target.
Result
Osteosarcoma-related differentially PRGs and functional enrichment analysis
Five pyroptosis-related genes (PRGs) associated with osteosarcoma were identified. Analysis of the GSE16088 dataset revealed 6119 differentially expressed genes (DEGs), including 2553 up-regulated and 3566 down-regulated. A box plot and PCA plot were employed to illustrate the distribution of the hybridization data and the extent of dispersion. Following log2 normalization, no anomalous data distributions were detected (Fig. 1a,b). Volcano plots and heatmap visualizations of the top 50 DEGs were generated using R (Fig. 1c,d). Further analysis identified five PRGs (CASP6, Table 2, CASP7, GSDMD, and TRAIDD) with significant differential expression in osteosarcoma (Fig. 1e,f). Functional enrichment analysis of these PRGs highlighted their considerable involvement in pyroptosis, the inflammasome complex, tertiary granule lumen, TNF signaling pathway, and apoptosis (Fig. 1g,h).

Identification of panoptosis-associated genes in osteosarcoma. (a) Box plots were employed to illustrate the distributions of genes for the two groups. Following normalization, the distributions of the log2 ratios were almost identical. (b) PCA plot analysis of osteosarcoma database. (c) Volcano plot visualizing differential gene expression between the two groups.Red: up-regulated genes; Blue: down-regulated genes. (d) The heatmap of DEGs with elevated expression depicted in red and diminished expression in blue. (e) The intersection of DEGs and panoptosis-related genes yielded osteosarcoma-associated differentially expressed PRGs. (f) The heatmap of five osteosarcoma related PRGs. (g) A bar plot showing the results of GO and KEGG enrichment analysis. (h) A network plot showing the results of GO and KEGG enrichment analysis of osteosarcoma related PRGs.
Development of risk prognostic signature
Through co-expression analysis, a total of 2696 PRLs linked to osteosarcoma were identified (Table S1). Univariate COX regression analysis revealed that 39 PRLs were significantly correlated with the prognosis of osteosarcoma. This cohort comprised 1 high-risk PRL (LINC01612) and 38 low-risk PRLs (AC004803.1, AC004812.2, AC004943.2, AC005229.4, AC006213.4, AC007881.3, AC008267.5, AC011933.3, AC022007.1, AC026691.1, AC068620.1, AC091057.3, AC091132.5, AC104825.1, AC109347.1, AC133552.2, ADCY6-DT, AL356599.1, ASB16-AS1, CEP83-DT, CETN4P, DLG5-AS1, DUBR, FAM66C, FGD5-AS1, ITPR1-DT, KRT8P12, LINC01914, LINC02328, MIR4453HG, NBR2, NRAV, PAXIP1-AS2, SBF2-AS1, SRP14-AS1, TMPO-AS1, TTC28-AS1, and UGDH-AS1) (Fig. 2a). Utilizing the optimal penalty parameter (λ) value, LASSO regression analysis determined that the ideal number of PRLs for model construction was 2 (Fig. 2b,c). Risk score = (− 0.262103429566348)*AC133552.2 + (-0.541272027571127)*LINC02328. The prognostic model formula was employed to compute the risk score for each sample. Consequently, the entire sample cohort was stratified into a high-risk group (N = 44) and a low-risk group (N = 44). The training cohort was further divided into high-risk (N = 22) and low-risk (N = 22) groups, while the testing cohort was categorized into high-risk (N = 22) and low-risk (N = 22) groups.
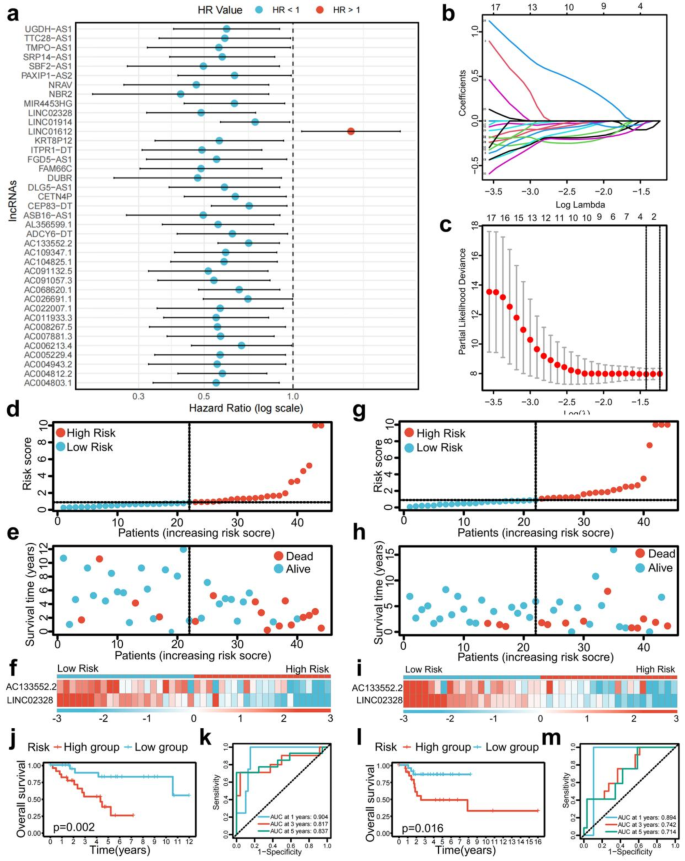
Construction of a risk prognostic model and survival prediction validation in training and testing cohorts. (a) Univariate Cox regression showed 39 PRLs related to osteosarcoma survival (P < 0.05). (b,c) Lasso regression for PRLs in univariate Cox regression. Coefficients refer to the risk coefficient corresponding to each gene. (d–f) Distribution of risk score, survival status, and heatmap of the two PRLs signature in training cohort. (g–i) Distribution of risk score, survival status, and heatmap of the two PRLs signature in testing cohort. (j) The Kaplan–Meier survival curve effectively demonstrates that patients in the high-risk group exhibited a substantially lower overall survival rate compared to those in the low-risk group in training cohort. (k) Time-dependent ROC curves, 1 year (AUC = 0.904), 3 years (AUC = 0.817), and 5 years (AUC = 0.837) in training cohort. (l) The Kaplan–Meier survival curve effectively demonstrates that patients in the high-risk group exhibited a substantially lower overall survival rate compared to those in the low-risk group in testing cohort. (m) Time-dependent ROC curves, 1 year (AUC = 0.894, 3 years (AUC = 0.742), and 5 years (AUC = 0.714) in testing cohort.
Risk prognostic signature forecasts the outcome for patients with osteosarcoma
The risk score and survival status maps for the training, testing, and overall cohorts, revealed a significant rise in the mortality rate of patients as they moved through the risk-related categories (Figs. 2d,e,g,h, 3a,b). Moreover, the risk heatmaps about the entire sample, training, and testing groups depicted that the expression levels of low-risk PRLs, such as AC133552.2 and LINC02328, gradually diminished (Figs. 2f,i, 3c).
The survival analysis of the training cohort (p = 0.002, Fig. 2j), test cohort (p = 0.016, Fig. 2l), and the complete sample cohort (p < 0.001, Fig. 3d) revealed significant differences in survival outcomes between patients classified as high-risk and low-risk. The ROC curve for the training cohort exhibited an even higher AUC at 1 year (AUC = 0.904), 3 years (AUC = 0.823), and 5 years (AUC = 0.851) (Fig. 2k). Conversely, the ROC curve for the test cohort showed a relatively lower AUC at 1 year (AUC = 0.897), 3 years (AUC = 0.731), and 5 years (AUC = 0.679) (Fig. 2m). The receiver operating characteristic (ROC) curve for the entire sample cohort demonstrated an impressive area under the curve (AUC) at 1 year (AUC = 0.876), 3 years (AUC = 0.787), and 5 years (AUC = 0.794, Fig. 3e).
Moreover, the ROC curve for the complete sample cohort demonstrated a significant AUC for metastasis (AUC = 0.905) and risk score (AUC = 0.877) (Fig. 3f). The univariate independent prognostic analysis performed on the entire sample cohort revealed that both the risk score (p = 0.006, HR = 1.073) and tumor metastasis (p < 0.001, HR = 4.770) are independent prognostic determinants, categorized as high-risk components (Fig. 3g). Additionally, the multivariate independent prognostic analysis of the total sample group validated that the risk score (p = 0.002, HR = 1.093) and tumor metastasis (p < 0.001, HR = 5.398) can be regarded as independent prognostic markers, also classified as high-risk factors (Fig. 3h). In summary, our risk prognostic model suggests that the risk score and tumor metastasis may function as independent prognostic factors for osteosarcoma patients, with both being designated high-risk components.
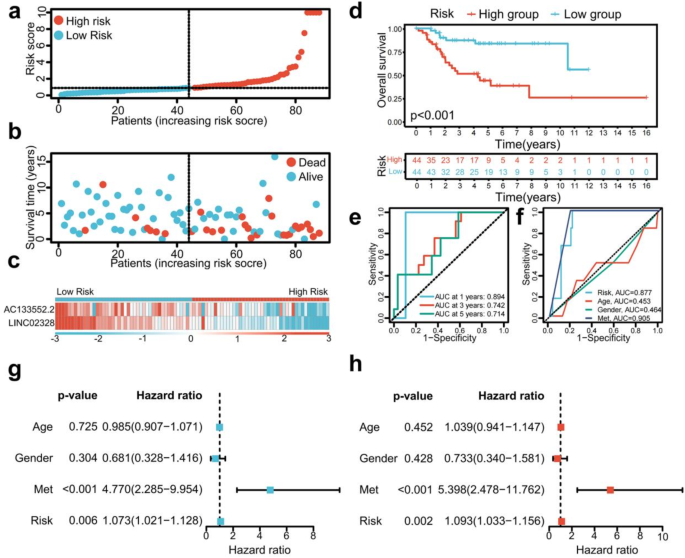
Survival prediction validation of risk models in total samples. (a–c) Distribution of risk score, survival status, and heatmap of the two PRLs signature in total samples. (d) The Kaplan–Meier survival curve effectively demonstrates that patients in the high-risk group exhibited a substantially lower overall survival rate compared to those in the low-risk group in total samples. (e) Time-dependent ROC curves, 1 year (AUC = 0.894), 3 years (AUC = 0.742), and 5 years (AUC = 0.714) in total samples. (f) Clinical ROC curves, Risk score (AUC = 0.877), Age (AUC = 0.453), Gender (AUC = 0.464), and Met (AUC = 0.905). (g,h) Univariate and multivariate COX regression analyses in the total sample group.
Single gene survival analysis and expression validation
The Kaplan-Meier survival analysis conducted for AC133552.2 and LINC02328 demonstrated notable differences in survival outcomes when comparing patients categorized by high and low lncRNA expression levels (Fig. 4a,c). The ROC curve for AC133552.2 exhibited a commendable AUC at 1 year (AUC = 0.641), 3 years (AUC = 0.617), and 5 years (AUC = 0.589) (Fig. 4b). In contrast, the ROC curve for LINC02328 showed a relatively lower AUC at 1 year (AUC = 0.749), 3 years (AUC = 0.656), and 5 years (AUC = 0.658) (Fig. 4d). The result of RT-qPCR validation demonstrated that compared to the control group (hFOB cells), AC133552.2 exhibited a diminished expression level in osteosarcoma cell lines (Fig. 4e). Meanwhile, LINC02328 was expressed higher in osteosarcoma cell lines than in hFOB cell lines (Fig. 4f). Subsequently, our PCR results in human osteosarcoma tissue and paired control tissue showed that AC133552.2 was significantly downregulated in osteosarcoma tissue (Fig. 4g). The Kaplan-Meier survival analysis revealed that the overall survival of high risk score group was lower than low risk score group in our dependent valuation cohort (Fig. 4h). The Kaplan-Meier survival analysis conducted for AC133552.2 and LINC02328 demonstrated notable differences in survival outcomes when comparing patients categorized by high and low lncRNA expression levels in our dependent valuation cohort (Fig. 4i,j). Thus, AC133552.2 was selected for further study.
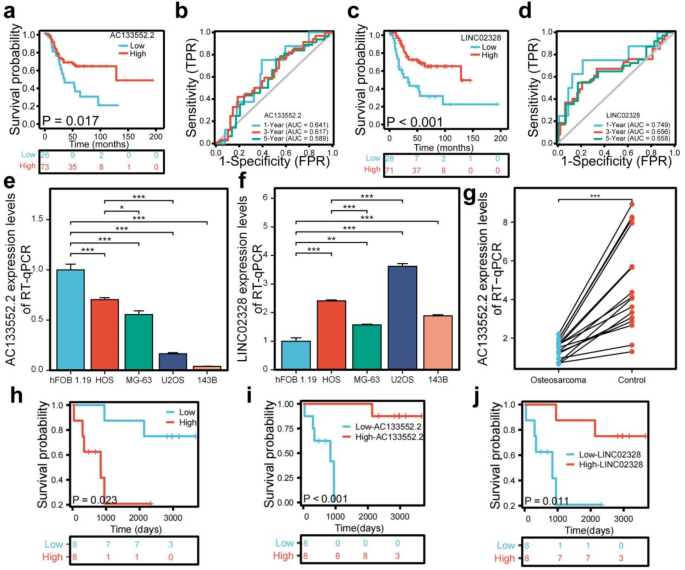
Analysis of the prognostic prediction ability of single genes from the risk model. (a) The effect of high AC133552.2 expression on the prognosis of osteosarcoma overall survival is statistically significant. (b) The effect of high AC133552.2 expression on the prognosis of osteosarcoma overall survival is statistically significant. (c) Kaplan–Meier survival curve analysis indicates that the expression level of LINC02328 cannot be used to predict the survival prognosis of osteosarcoma patients. (d) The effect of low LINC02328 expression on the prognosis of osteosarcoma overall survival is statistically significant. (e) The expression of AC133552.2 was significantly reduced in the osteosarcoma cell lines. (f) The expression of AC133552.2 in hFOB 1.19 and osteosarcoma cell lines. (g) In validate cohort, the expression level of AC13352.2 between osteosarcoma and control tissues. (h) The effect of high risk score on the prognosis of osteosarcoma overall survival is statistically significant in our independent validation cohort. (i) The effect of low AC133552.2 expression levels on the prognosis of osteosarcoma overall survival is statistically significant in our independent validation cohort. (j) The effect of low LINC02328 expression levels on the prognosis of osteosarcoma overall survival is statistically significant in our independent validation cohort. The data were presented as the mean ± SD with n = 3. ***p < 0.001, **p < 0.01, *p < 0.05.
AC133552.2 guide immune microenvironment of patients with osteosarcoma
The results from the ssGSEA analysis indicated a marked upregulation of various immune cell types, including immature dendritic cells (iDC) and NK CD56dim cells in the high-AC133552.2-expression group (Fig. 5a). A comparative analysis of immune functionality indicated significant upregulation of several factors in the high-AC133552.2-expression cohort, including cytolytic activity and T-cell co-inhibition (Fig. 5b). The examination of disparities within the tumor microenvironment indicated notable differences in immune cell scores (p < 0.05) (Fig. 5d). Meanwhile, stromal cell and ESTIMATE scores were up-regulated in the high-AC133552.2-expression group, but the p-value was more than 0.05 (Fig. 5c,e).
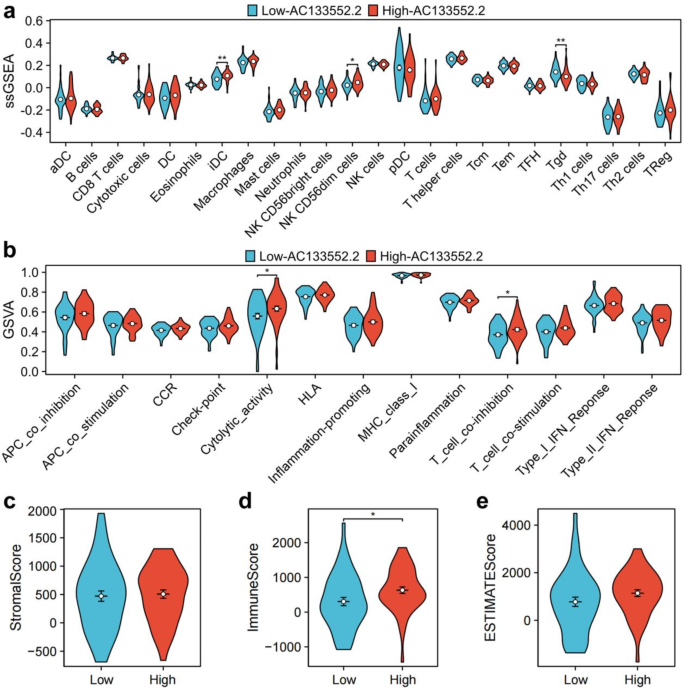
Immune cell infiltration and immune microenvironment analysis of AC133552.2. (a) A violin plot of immune cell infiltration differences analyzed using ssGSEA. (b) A violin plot of immune function differences analyzed using GSVA. (c,e) Violin plots of the differences in StromalScore, ImmuneScore, and ESTIMATEScore between high-AC133552.2 and low-AC133552.2 groups.
Silencing AC133552.2 expression promoted the proliferation and migration while inhibiting apoptosis in osteosarcoma cell lines
We utilized lncRNA bright silence transfection to inhibit AC133552.2 (Fig. 6a,c) expression and subsequently evaluated its impact on the proliferation, apoptosis, and migration of osteosarcoma cells. These results of CCK-8 assays and EdU staining indicated that downregulated AC133552.2 expression significantly promoted cell proliferation (Fig. 6b,d,e,f). Furthermore, transwell assays and wound healing outcomes enhanced migratory capabilities and were associated with lower expression of AC133552.2 (Fig. 6g–j). Additionally, Annexin V/PI staining analysis revealed that decreased expression of AC133552.2 significantly diminished apoptosis in osteosarcoma cells (Fig. 6k,l).
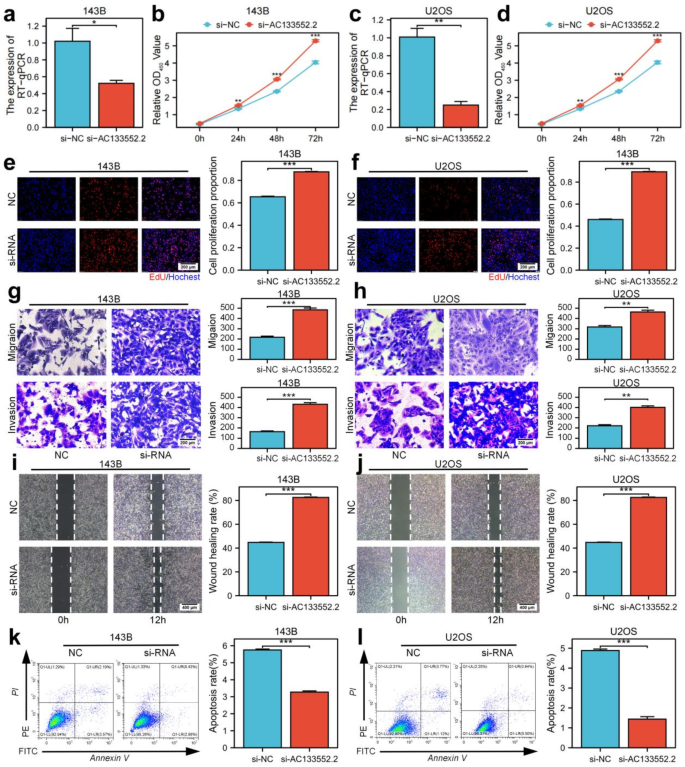
Downregulation of AC133552.2 markedly enhances osteosarcoma cell proliferation and migration while inhibiting apoptosis. (a,c) The expression of AC133552.2 was significantly reduced in the 143B and U2OS cell lines. (b,d,e,f) CCK-8 and EdU assays demonstrated that the knockdown of AC133552.2 markedly promoted the proliferation of 143B and U2OS cells. (g,h) Transwell assays indicated a significant increase in the migration capacity of 143B and U2OS cells following AC133552.2 knockdown. (i,j) Scratch assays further confirmed that the migration ability of 143B and U2OS cells was significantly enhanced after AC133552.2 knockdown. (k,l) Apoptosis assays revealed a substantial decrease in the apoptosis rate of 143B and U2OS cells following the knockdown of AC133552.2. The data were presented as the mean ± SD with n = 3. ***p < 0.001, **p < 0.01, *p < 0.05.
Overexpression of AC133552.2 inhibited the proliferation and migration while promoting apoptosis in osteosarcoma cell lines
Utilizing plasmid transfection, we successfully elevated AC133552.2 expression in the 143B and U2OS osteosarcoma cell lines (Fig. 7a,c). CCK-8 and EdU analysis revealed that elevated AC133552.2 expression significantly inhibited cell proliferation (Fig. 7b,d,e,f). Transwell and wound healing assays demonstrated that the upregulation of AC133552.2 reduced the migratory abilities of osteosarcoma cells (Fig. 7g–j). Additionally, Annexin V/PI staining analysis demonstrated that increased expression of AC133552.2 significantly promoted apoptosis in osteosarcoma cells (Fig. 7k,l). In summary, these findings suggest that the upregulation of AC133552.2 negatively impacts the proliferation and migration.
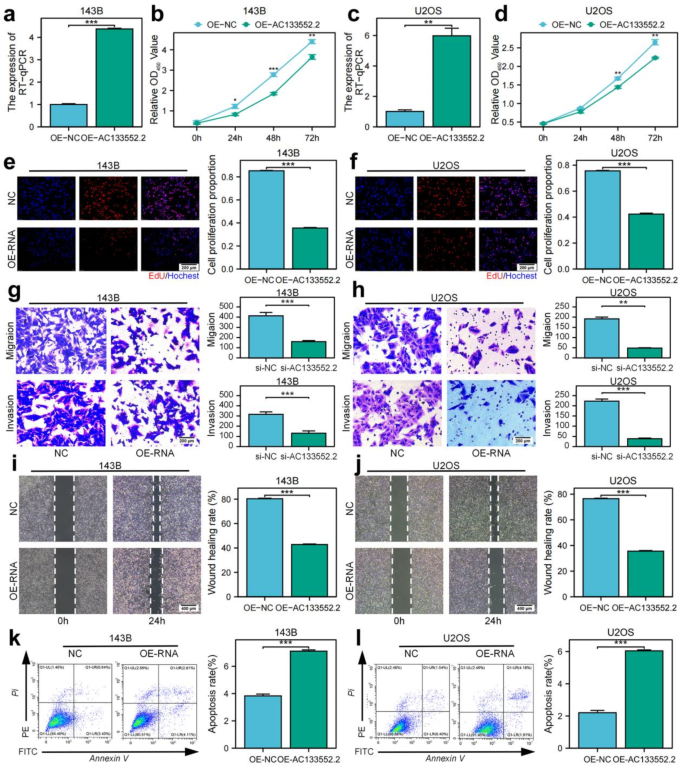
Upregulation of AC133552.2 significantly suppresses osteosarcoma cell proliferation and migration while promoting apoptosis. (a,c) AC133552.2 expression was significantly increased in the 143B and U2OS cell lines. (b,d,e,f) CCK-8 and EdU assays demonstrated that upregulation of AC133552.2 significantly inhibited the proliferation of 143B and U2OS cells. (g,h) Transwell assays indicated a significant decrease in the migration capacity of 143B and U2OS cells following AC133552.2 upregulation. (i,j) Scratch assays further confirmed that the migration ability of 143B and U2OS cells was significantly reduced after upregulation of AC133552.2. (k,l) Apoptosis assays revealed a significant increase in the apoptosis rate of MG63 and U2OS cells following the upregulation of AC133552.2. The data were presented as the mean ± SD with n = 3. ***p < 0.001, **p < 0.01, *p < 0.05.
Overexpression of AC133552.2 suppressed osteosarcoma tumorigenesis in vivo
To further validate the role of AC133552.2 in the proliferation of osteosarcoma, we subcutaneously injected cells with ectopic expression of AC133552.2, along with control cells, into nude mice to establish xenograft models. These findings indicated that elevated AC133552.2 expression suppressed tumor proliferation (Fig. 8a,b). Tumors exhibiting AC133552.2 overexpression demonstrated reduced size and diminished weight compared to control tumors (P < 0.01) (Fig. 8c). In addition, the result of RT-qPCR determined that AC133552.2 expression were upregulated in OE-AC133552.2 group (Fig. 8d). These outcomes suggested that the increased AC133552.2 expression inhibited osteosarcoma progression.
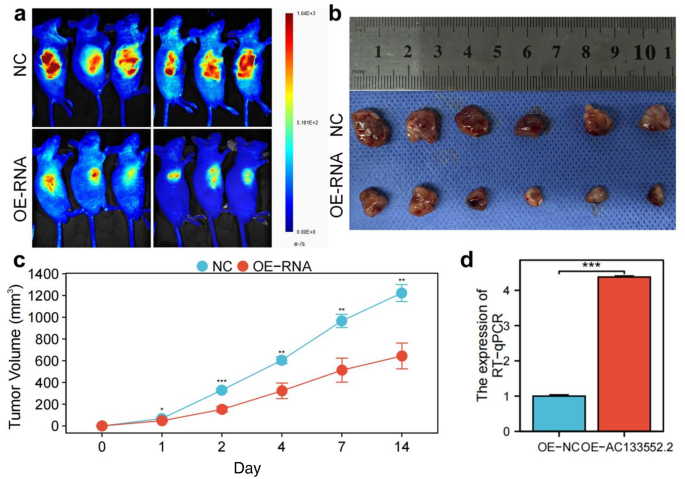
Upregulation of AC133552.2 inhibited osteosarcoma cell proliferation in vivo. (a) Bioluminescence imaging revealed that the fluorescence signals of tumors in the AC133552.2 overexpression group were significantly diminished compared to those in the control group. (b) The tumor size in nude mice was significantly reduced in the AC133552.2 over-expression group compared to the control group. (c) AC133552.2 overexpressing tumors were reduced in size and weight compared to controls. (d) RT-qPCR showed that AC133552.2 expression was upregulated in the nude mice of AC133552.2 overexpression. The data were presented as the mean ± SD with n = 3. ***p < 0.001, **p < 0.01, *p < 0.05.
Evaluation of therapeutic responses in low-AC133552.2 and high-AC133552.2 groups
To evaluate the therapeutic responses in the low-AC133552.2 and high-AC133552.2 cohorts, we performed an analysis utilizing the oncoPredict R package to investigate the drug therapy data accessible in the Genomics of Drug Sensitivity in Cancer (GDSC) database, focusing on the half-maximal inhibitory concentration (IC50). The high-AC133552.2 cohort exhibited markedly greater sensitivity to Ribociclib in comparison to the low-risk cohort, while the low-risk group exhibited higher sensitivity to 4 drugs, including BI-2536, AZD1208, Crizotinib, and ZM447439 (Fig. S1). These findings imply that these small molecule drugs may possess potential as therapeutic alternatives for osteosarcoma. Nevertheless, additional analysis and exploration are necessary in subsequent studies. Overall, these results signify that AC133552.2 has pragmatic implications for directing drug treatment selection in patients with osteosarcoma.
Discussion
In this study, we performed differential expression analysis of mRNA profiles from osteosarcoma and normal tissues using data from the GEO database, identifying five PANoptosis-related genes—CASP6, Table 2, CASP7, GSDMD, and TRADD—associated with osteosarcoma survival. Interestingly, a recent study by Peng et al. (November 2024)17 also constructed a survival-predicting signature for osteosarcoma based on five PANoptosis-related genes: CRYBA1, CASP5, PIK3R5, CASP6, and PRKACB. Although our analysis utilized a different dataset, both studies identified CASP6 as a critical gene, highlighting its importance in osteosarcoma prognosis.
CASP6 plays a crucial role in regulating cell death processes in various cancers, including pyroptosis and necroptosis18. It significantly contributes to tumor progression and survival by influencing cell fate under stress conditions. For instance, studies in glioblastoma have demonstrated that CASP6 activation can promote necroptosis, which enhances tumor cell survival19. Similarly, in colorectal cancer, CASP6 activates pyroptosis-related inflammasomes, shaping the immune microenvironment and supporting tumor progression20. In osteosarcoma, CASP6 dysregulation has been linked to both tumor progression and therapeutic resistance. Yang et al.21 showed that CASP6 and other pyroptosis-related genes serve as a prognostic indicator for osteosarcoma. Furthermore, León et al.22 observed that CASP6’s dysregulation in osteosarcoma further underscores its pivotal role in disease progression. These consistent findings reinforce the significance of CASP6 in osteosarcoma prognosis.
Beyond CASP6, we systematically characterized four PANoptosis-associated genes in osteosarcoma pathogenesis. Table 2 coordinates IL-1 receptor-mediated inflammatory cascades through NF-κB/MAPK activation while paradoxically driving tumorigenesis via microenvironmental remodeling23. CASP7 demonstrates dual functionality in apoptotic execution and pyroptosis induction through GSDME cleavage24, with its osteosarcoma-specific regulatory networks remaining underexplored. GSDMD exhibits structural-functional dichotomy: its pore-forming N-domain executes pyroptosis25, whereas the intact protein demonstrates paradoxical tumor-promoting effects via death pathway interplay26. TRADD emerges as a latent metastasis facilitator, operating through apoptosis evasion circuits and metastatic niche formation27.
Long non-coding RNAs (lncRNAs) have emerged as valuable biomarkers with significant implications in the progression of various cancers, particularly osteosarcoma. Numerous studies indicate that the expression levels of specific lncRNAs in osteosarcoma tissues are strongly correlated with clinical characteristics and patient prognosis28,29,30. Notably, lncRNAs such as PVT1, NDRG1, and CIR have been identified as crucial regulators of osteosarcoma cell proliferation, migration, and invasion. Elevated expression levels of these lncRNAs are typically associated with poor clinical outcomes28,29,30.
Emerging evidence reveals that lncRNAs serve a dual role: they not only act as indicators of disease progression but also actively influence tumor behavior by modulating key signaling pathways. For instance, lncRNA NDRG1 promotes osteosarcoma cell proliferation and migration through the PI3K/AKT signaling pathway, while lncRNA CCAT2 exerts tumor-suppressive effects by targeting miR-143 to inhibit cell proliferation and metastasis29,31. Moreover, recent findings suggest that certain lncRNAs, such as HIF2PUT, can hinder tumor development by suppressing the self-renewal capacity of osteosarcoma stem cells32.
In this study, we focused on the co-expression of lncRNAs with five PANoptosis-related genes. Our analysis identified two lncRNAs, AC133552.2 and LINC02328, as significantly associated with osteosarcoma progression. Furthermore, the prognostic prediction model based on these two lncRNAs demonstrated robust predictive accuracy, as validated by Kaplan–Meier survival analysis and time-dependent ROC analysis.
Our experiments demonstrated that AC133552.2 expression was significantly reduced in osteosarcoma tissues compared to normal controls. This downregulation was inversely associated with low immune infiltration scores, decreased NK CD56dim cells, and diminished cytolytic activity, as shown in the GSEA and GSVA results. Consequently, osteosarcoma patients with low AC133552.2 expression exhibited poor survival outcomes, highlighting its potential as a prognostic biomarker for osteosarcoma.
Functional assays further revealed that silencing AC133552.2 promoted osteosarcoma cell proliferation, invasion, and metastasis while inhibiting apoptosis. Conversely, AC133552.2 overexpression suppressed tumor growth, enhanced apoptosis, and mitigated metastatic potential. These results were validated in vivo, where overexpression of AC133552.2 significantly inhibited tumor growth in xenograft models. These findings collectively underscore the crucial role of AC133552.2 in osteosarcoma progression and its promise as a prognostic marker and therapeutic target.
Mechanistically, the role of AC133552.2 in regulating PANoptosis pathways warrants further investigation. As a potential modulator of tumor cell fate, AC133552.2 may influence key signaling pathways associated with pyroptosis, apoptosis, and necroptosis. A deeper understanding of the molecular interactions between AC133552.2 and PANoptosis could pave the way for developing targeted therapeutic strategies for osteosarcoma.
In addition, our study identified 5 compounds: Ribociclib, BI-2536, AZD1208, Crizotinib, and ZM447439. The high-AC133552.2 group displayed significantly higher sensitivity to Ribociclib compared to the low-risk group, while the low-risk group exhibited higher sensitivity to 4 others. These findings indicate that these small-molecule agents may serve as potential therapeutic options for osteosarcoma, varying efficacy according to patients’ risk profiles.
Despite the promising findings of this study, several limitations should be considered. First, the relatively small sample size in the validation cohorts may limit the generalizability of the results to larger, more diverse populations. Additionally, while we identified two lncRNAs, AC133552.2 and LINC02328, as significantly associated with osteosarcoma progression, the exact molecular mechanisms through which these lncRNAs influence tumor behavior remain poorly understood. Future studies should aim to clarify the specific signaling pathways and molecular interactions involved. Furthermore, although lncRNA AC133552.2 holds potential as a therapeutic target, challenges in its effective delivery to osteosarcoma cells persist. Exosomes and liposomes may offer viable strategies for targeted delivery of lncRNAs. Lastly, the integration of this therapeutic approach with current adjuvant chemotherapy and immunotherapy strategies warrants further exploration.
In conclusion, our differential expression analysis identified five PANoptosis-related genes and their co-expressed lncRNAs in osteosarcoma. Among the 39 survival-associated lncRNAs, AC133552.2 emerged as a key prognostic marker, significantly downregulated in osteosarcoma tissues, and linked to poor clinical outcomes. Functional studies demonstrated that AC133552.2 inhibits tumor cell proliferation, invasion, and metastasis while promoting apoptosis. These findings suggest its potential as a diagnostic biomarker and a therapeutic target.
Methods
Study approval
The current study received approval from the Ethics Committee of the Second Affiliated Hospital of Nanchang University [Review (2020) No. (115)]. And the animal experiment ethics for this study have been approved by the Ethics Committee of Nanchang University (Approval No: NCULAE-20221031059). We confirm that all experiments were conducted following the relevant guidelines and regulations. All procedures in this study adhered to the ARRIVE guidelines. The flowchart of this study is shown in Fig. S2.
Data collection
RNA expression profiles from normal tissues were sourced from the GEO database (GSE16088, https://ftp.ncbi.nlm.nih.gov/geo/series/GSE16nnn/GSE16088/matrix/). The fragments per kilobase of transcript per million mapped reads (FPKM) values in the expression dataset were transformed using the log2(x + 0.001) method to facilitate analysis. Furthermore, RNA sequencing data and clinical characteristics of osteosarcoma patients were obtained from the TARGET database https://portal.gdc.cancer.gov/projects/TARGET-OS). Previous studies on PANoptosis have indicated using 19 genes associated with PANoptosis (PRGs) for further investigation33. The FPKM values were utilized as indicators of gene expression levels.
Tissues and clinical data from 16 patients diagnosed with osteosarcoma were supplied by the Second Affiliated Hospital of Nanchang University between January 2012 and December 2016, serving as an external validation cohort. The clinical information of the patients is presented in Table S2. The current study received approval from the Ethics Committee of the Second Affiliated Hospital of Nanchang University [Review (2020) No. (115)]. Written informed consent was acquired from all participants. All tissue samples were preserved in liquid nitrogen until RNA extraction.
Identification of osteosarcoma-related PRGs
A comparative analysis assessed the PRGs of the genes identified within the osteosarcoma transcriptome dataset to identify PRGs associated with osteosarcoma. The differential expression analysis was performed using the limma package in R, specifically applied to the GSE16088 dataset, to detect differentially expressed genes (DEGs). The criteria for selection included a false discovery rate (FDR) threshold of less than 0.05 and an absolute log2 fold change (|log2FC|) greater than 0.5. Following this, a Venn plot was drawn between the PRGs and DEGs to identify the differentially expressed PRGs relevant to osteosarcoma.
Functional enrichment analysis of PRGs
This study employed the ClusterProfiler package within the R programming environment to conduct KEGG enrichment analysis on the differentially expressed PRGs, applying a significance criterion of p < 0.05.
Identified PRLs and construction of risk prognostic signature
The limma package in the R programming environment was employed to perform a co-expression analysis of PRGs and PRGs-related lncRNAs (PRLs) in a transcriptomic dataset associated with osteosarcoma. This analysis aimed to identify PRLs significantly associated with osteosarcoma, applying stringent selection criteria of |Pearson correlation coefficient| > 0.4 and p < 0.001.
To further investigate PRLs significantly linked to osteosarcoma prognosis, univariate Cox regression analysis was conducted using the survival package in R, with a significance threshold set at p < 0.05. This analysis facilitated the calculation of hazard ratio (HR) values. In addition, the glmnet package was employed to perform LASSO regression analysis, which was instrumental in minimizing overfitting and determining the optimal number of PRLs for model construction.
The dataset was partitioned into training and testing cohorts to evaluate model accuracy. Subsequently, a risk prediction model was established for the entire dataset and the training and testing subsets. Risk scores were computed by multiplying the expression levels of osteosarcoma prognosis-related PRLs by their corresponding regression coefficients, followed by summation. Based on the median risk score, samples from the total dataset and those from the training and testing groups were stratified into high- and low-risk categories.
Validation of risk prognostic signature
Survival outcomes, receiver operating characteristic (ROC) curves, and independent prognostic evaluations were analyzed using the risk predictive models across the entire sample and the training and testing cohorts. The statistical software R was employed to produce the survival status map and the risk heatmap associated with the predictive model, facilitating the assessment of differences in patient survival times and overall survival prognoses across high- and low-risk groups. The survival and survminer packages in R were utilized to construct survival curves, while the survival, survminer, and timeROC packages were applied to generate ROC curves. Furthermore, the survival package in R was leveraged to carry out independent prognostic evaluations through univariate and multivariate Cox regression analyses, aiming to ascertain whether the risk score could function as an independent prognostic factor.
Tumor microenvironment analysis and single-sample gene set enrichment analysis
To elucidate the immune environment function of AC133552.2, the cohort of 88 patients was categorized into two groups based on their expression levels of AC133552.2. Specifically, the patients were classified into a high-expression group (n = 44) and a low-expression group (n = 44), utilizing the median expression value as the threshold for this classification. The R packages limma and ggpubr were utilized to evaluate the variations in immune, stromal, and overall scores throughout the risk prognostic model across the extensive sample cohort. Furthermore, this study employed the GSVA, limma, and GSEABase packages in R to calculate enrichment scores associated with different immune cell types and their functional capabilities based on the transcriptomic data of osteosarcoma. The limma, reshape2, and ggpubr packages in R examined the differences in immune cell populations and immune functionality related to the risk prognosis model applied to the two groups.
Drug sensitivity analysis
The sensitivity score for each small molecule compound was computed for individual patients in both the high-risk and low-risk groups using the oncoPredict package.
Cell culture and transfection
The control cell line (hFOB 1.19) and four human cell lines (HOS, MG-63, U2OS, 143B) were acquired from the National Collection of Authenticated Cell Cultures (Shanghai, China). The 293T, MG-63, 143B, and U2OS cell lines were cultivated in complete DMEM (10% FBS and 1% penicillin/streptomycin) at 37 ℃ in a humidified environment with 5% CO2. The HOS was maintained in a modified Eagle’s medium (MEM) culture medium (containing 10% FBS and 1% penicillin/streptomycin) at 37 ℃ with 5% CO2. The osteoblast cell lines were nurtured in the same complete medium at 34℃ in a humidified atmosphere containing 5% CO2.
AC133552.2 innovative silencer and lncRNA smart silencer NC were purchased from RiboBio (Guangzhou). The plasmid and lentivirus for the overexpression of AC133552.2 were purchased from HANBIO (Fig. S3). According to the manufacturer’s guidelines, transient transfections were conducted with riboFECTTM CP Transfection Kit (RiboBio) and Lipofectamine 2000 regent (ThermoFisher Scientific, Cat. No 11668019).
293T cells at 70–80% density were transfected with AC133552.2 plasmid, PSPAX2 plasmid and PMDSG plasmid in a 10:6:3 ratio and assisted transfection with Lipofectamine 2000 regent (ThermoFisher Scientific, Cat. No 11668019). After 12 h of transfection, the supernatant was removed and complete DMEM (10% fetal bovine serum and 1% penicillin/streptomycin) was added, and the supernatant virus was collected after 48 h. The collected viral supernatant was concentrated by Universal Virus Concentration Kit (Beyotime, C2901).
RT-qPCR
Total RNA was extracted from cells or human tissues using the Trizol reagent (Invitrogen, Carlsbad, CA). For cDNA synthesis, 2 µg of RNA was used with the All-in-One™ First-Strand cDNA Synthesis Kit (GeneCopoeia, Cat. No QP006). The reverse transcription conditions were as follows: 2 min at 28 ℃, 30 min at 42 ℃, and 5 min at 85 ℃. For qPCR, cDNA underwent an initial denaturation at 94 ℃ for 2 min, followed by 40 cycles of denaturation at 95 ℃ for 15 s, and annealing/extension at 60–68 ℃ for 30 s. After completing the cycles, a melting curve analysis was performed from 65 to 95 ℃, with a stepwise increase of 0.5 ℃ per second, using the BeyoFast™ SYBR Green qPCR Mix (Bio-Rad, Cat. No 1708882AP). The primers used in qRT-PCR are listed in Table S3. Relative quantification was conducted with GAPDH as the internal reference.
Cell proliferation assays
EdU incorporation and CCK-8 assays were conducted to ascertain the proliferative capability of osteosarcoma cells. In the EdU assay, cells were plated into 96-well plates at a density of 2 × 10⁴ cells per well. Following an 8-hour incubation at 37 °C, the cells underwent EdU labeling, fixation, and staining according to the manufacturer’s guidelines for the YF®594 Click-iT EdU staining kit (UE, Shanghai, China). Images were subsequently captured using a fluorescence microscope for evaluation.
Simultaneously, the CCK-8 assay was performed by seeding 5000 cells per well in a 96-well plate. At specified time intervals (0 h, 24 h, 48 h, and 72 h), 10% CCK-8 solution (TransGen, Beijing, China) was introduced to each well. After a 2-h incubation at 37 °C, the absorbance at 450 nm was recorded for each well using a spectrophotometer. The resulting data were analyzed to evaluate the proliferative potential of the osteosarcoma cells.
Wound healing assays
U2OS and 143B cells transfected with plasmids and siRNAs, along with their respective controls, were plated in six-well culture dishes. Once the cells attained approximately 90% confluency, a 200 µl pipette tip generated a scratch or gap in the cell monolayer. After that, the cells were maintained in a serum-free medium for 12 h. The gaps were examined and photographed at 0 h and 12 h utilizing an inverted microscope.
Transwell assays
Following the manufacturer’s instructions, transwell migration and matrigel invasion assays were performed using a modified Boyden chamber (Corning, Cat. No. 3422) and matrigel invasion chambers (BD BioCoat™, Cat. No. 354234). After a 24-h culture in a serum-free medium, the cells were resuspended and diluted in a serum-free medium containing 0.1% BSA (Saiguo Biotech, Cat. No. 9045-46-8). Two hundred microliters of serum-free medium containing 4 × 10⁵ treated cells were added to the upper chambers for migration and invasion assays. In comparison, 500 µl of complete medium were placed in the lower chambers. The cells were incubated for 30 h for the migration assay and 48 h for the invasion assay.
After incubation, a 10% formaldehyde solution was added to each well for fixation at 28 °C for 30 s, after which the adhering cells were rinsed once with 1× PBS. Next, 0.5% crystal violet was applied at a volume of 1 ml per well for 20 min, followed by three washes with 1× PBS. Once dried, the stained cells were examined in three independent fields under an inverted microscope (CHONGQING OPTEC INSTRUMENT, Cat. No. BDS300).
Cell apoptosis assays
A suspension of 104 cells per milliliter was plated in a 6-well plate to assess cellular apoptosis. Once the cells reached 60–70% confluence, they were harvested and washed with chilled phosphate-buffered saline (PBS) free of Ca2+ and Mg2+. After centrifugation, the cells were stained with Annexin V and Propidium Iodide (PI) in the dark for 15 min. Following this, 400 µL of buffer was added to resuspend the cells, and their apoptotic status was evaluated using flow cytometry.
Tumor growth in mice
The animal study was approved by the Animal Ethics Committee of Nanchang University (Approval No: NCULAE-20221031059). Four-week-old nude mice were sourced from Hunan Slack King Laboratory Animal Co., Ltd. (Changsha, China) and were kept under controlled laboratory conditions. A total of 4 × 10⁶ 143B cells in 0.2 mL of PBS were injected subcutaneously into the right flank of the nude mice. A total of 12 nude mice were divided into two groups: the NC group and the OE-AC133552.2 group, with six mice assigned to each group. Tumor dimensions, including length and width, were measured weekly until the experiment was completed. Two weeks after implantation, the mice were anesthetized with isoflurane, and the tumors were surgically removed and weighed. Following the guidelines set forth by our Institutional Animal Care and Use Committee, the mice used in this experiment were humanely euthanized with CO2, and death was confirmed through cervical dislocation.
Statistical analysis
We analyzed and visualized the data using R Software (v4.0.4) and GraphPad Prism (v9.0). Experiments such as CCK-8, EDU, transwell, wound healing assay, apoptosis flow cytometry detection, RT-qPCR, and WB were all repeated three times. Statistical analyses for multiple comparisons were performed using one-way ANOVA. The student’s t-test was used to compare the differences between the two groups. p < 0.05 indicated that the difference was statistically significant.


Responses