Long non-coding RNA-MIR181A1HG acts as an oncogene and contributes to invasion and metastasis in gastric cancer

Introduction
Gastric cancer (GC) is the fourth leading cause of cancer-related deaths globally owing to its advanced stage at diagnosis [1]. Despite significant advancements in clinical practice, the 5-year overall survival (OS) rate of patients with GC remains <30% [2]. Therefore, investigating the molecular patterns and regulatory networks underlying tumorigenesis and progression of GC is critical.
Non-coding RNAs (ncRNAs), including long non-coding RNAs (lncRNAs, >200 nt) and microRNAs (miRNAs, 20-22 nt), play vital roles in various cancers [3,4,5]. For example, the ectopic expression of LINC00501 promotes GC development and progression [3]. PAXIP1-AS1 facilitates GC advancement through PABPC1/PAK1 modulation [4]. Moreover, miR-647 targets the SRF-MYH9 axis to suppress GC cell invasion and metastasis [5]. Some lncRNAs harbor miRNAs within their exonic or intronic sequences referred to as microRNA non-coding host genes (MIRHGs) [6]. MIRHGs and miRNAs may regulate gene expression and modulate various biological processes coordinately [7,8,9]. The lncRNA-MIR22HG and MIR22HG–derived miR-22-3p cooperatively inhibit hepatocellular carcinoma development and progression [7]. Moreover, the MIR497HG and MIR497HG-derived miR-497 and miR-195 clusters are downregulated, inhibiting breast cancer cell proliferation [8]. In addition, the FTX locus, comprising of a long noncoding RNA FTX and multiple intronic miRNA, was highly upregulated in colon cancer, and synergistically promoted cancer growth[9]. Furthermore, MIR503HG functions coefficiently with intron-derived miR503 to suppress cell migration and invasion in hepatocellular carcinoma [10].
MIR181A1HG, a member of the MIRHGs family, is located on chromosome 1q32.1 and encodes MIR181A1 and MIR181B1 in its second intron. Previous studies have shown that MIR181A1HG regulates the differentiation of bone marrow mesenchymal stem cells [11]. Moreover, MIR181A1 [12,13,14,15,16,17,18,19] and MIR181B1 [20] have been documented as onco-miRNAs in several cancers, including GC. However, the function and molecular mechanisms of MIR181A1HG and its association with MIR181A1 and MIR181B1 in GC remain unclear.
In this study, we aim to explore the expression and biological functions of MIR181A1HG in GC and investigate the relationship between MIR181A1HG and its intron-derived miR-181a-5p/miR-181b-5p. We further explored the association between miR-181a-5p/miR-181b-5p and the Suppressor of cytokine signaling 3 (SOCS3) in GC cell invasion and migration. We then observed the effect of SOCS3 and nuclear factor of activated T cells 2 (NFATC2) on MIR181A1HG transcription. Thus, our study provides information on MIR181A1HG and its related molecules, which will aid in the identification of potential therapeutic targets for the treatment of patients with GC.
Results
MIR181A1HG is upregulated and acts as an oncogenic lncRNA in GC
To investigate the roles of lncRNAs in GC, we downloaded GSE50710 (containing 10 pairs of GC and normal tissues) [21], GSE65801 (containing 32 pairs of GC and normal tissues) [22], and TCGA-STAD (containing 412 GC tissues and 36 normal tissues) RNA-seq datasets to screen for differentially expressed lncRNAs that were expressed above the threshold level (|Log2FoldChange | >1.2, p < 0.05) between GC tissues and normal gastric epithelial tissues. Using the intersection of the three datasets, the results showed that four lncRNAs were downregulated and five annotated lncRNAs were upregulated (Fig. 1A). We further focused on the five upregulated lncRNAs because of their potential use as early diagnostic markers or intervention targets. Among the five upregulated lncRNAs, we identified two MIRHGs, MIR4435-2HG, and MIR181A1HG. MIR4435-2HG promotes GC progression [23]. Therefore, we focused on the MIR181A1HG effect on GC. Our investigations demonstrated that MIR181A1HG was upregulated in GC using either unpaired (Fig. 1B1-3) or paired-match (Fig. 1C1-3) Student t-tests.

A The three-way Venn diagram of differentially expressed lncRNAs between GC tissues and normal gastric tissues obtained from GSE50710, GSE65801 and TCGA-STAD datasets. B1 – 3 Quantitative expression of MIR181A1HG in GC compared with NT from GSE50710 (B1), GSE65801 (B2) and TCGA-STAD (B3) dataset. **, P < 0.05, ***, P < 0.01, and ****, P < 0.001, NT vs. GC. NT, normal tissue; GC, gastric cancer tissue. C1 – 3 Quantitative expression of MIR181A1HG in 10, 32 and 33 pairs of matched GC and NT from GSE50710 (C1), GSE65801 (C2) and TCGA-STAD (C3) datasets. **, P < 0.05, and ****, P < 0.001, NT vs. GC. D1/2 Expression of MIR181A1HG was determined in 73 pairs of GC and NT by qRT-PCR using waterfall plot (D1) and box plot (D2). **, P < 0.05. E Expression of MIR181A1HG in the indicated GC cell lines was determined by qRT-PCR normalized to gastric epithelial cell line GES-1 as a control. **, P < 0.05, GC cell lines vs. GES-1. F Expression of MIR181A1HG in patients with GC (12 patients) detected by H&E and ISH. Representative images of normal and tumor tissues are shown. Scale bars, 20 μm. G Subcellular localization of MIR181A1HG, GAPDH, and NEAT1 in GES-1 and AGS cells. GAPDH mRNA and NEAT1 mRNA were used as controls for the cytoplasmic and nuclear fractions, respectively. H–K Associations of MIR181A1HG expression level with tumor size (H), invasion (I), lymph node metastasis (J) and the TNM stage (K). Student’s t-test; **, P < 0.05 and ***, P < 0.01.
Subsequently, we assayed MIR181A1HG expression in 73 pairs of GC tissues and matched adjacent normal tissues by qRT-PCR. MIR181A1HG was found to be significantly upregulated in GC (Fig. 1D1-2). Further, we examined MIR181A1HG expression in the normal gastric epithelial cell line, GES-1, and in GC-derived cell lines (AGS, SNU-216, MKN-45, HGC-27, SNU-5, MKN-74, KATO-3, and NCI-N87). Compared to GES-1, MIR181A1HG was upregulated in all GC cell lines except AGS, as determined by qRT-PCR (Fig. 1E). To validate its dysregulated expression, we analyzed MIR181A1HG levels in 12 paired paraffin-embedded samples by In Situ Hybridization (ISH). Nine out of 12 (75%) cases exhibited higher expression in GC tissues. MIR181A1HG was primarily localized in the GC cell nucleus, with some detected in the cytoplasm (Fig. 1F). Consistent with ISH results, subcellular fractionation experiments also showed MIR181A1HG predominantly in the nucleus (Fig. 1G).
To determine the association between MIR181A1HG expression levels and GC progression, we analyzed 73 patients with GC (Table S7). MIR181A1HG expression was significantly positively correlated with tumor size (<5 cm vs. ≥5 cm; Fig.1H, p = 0.006), tumor invasion (T1-2 vs. T3-4; Fig. 1I, p = 0.03), lymph nodes metastasis (Absent vs. Present; Fig. 1J, p = 0.023) and the TNM stage (AJCC) (I-II vs. III-IV; Fig. 1K, P = 0.017). Because the follow-up period for these samples was shorter than five years, we used the survival data from The Cancer Genome Atlas (TCGA) database. Survival analysis of MIR181 A1HG showed that high MIR181A1HG expression was correlated with poor overall survival (OS), progression-free survival (PFS), and disease-free survival (DFS) (Supplementary Fig. 1A-C). To further investigate the mechanisms upon MIR181A1HG upregulation in STAD, we retrieved online sequencing data from the TCGA-STAD cohort comprised of 443 patients. The results showed that 8 patients had DNA copy number amplification, which accounted for 1.8% of patients with copy number alterations (Supplementary Fig. 1D). Furthermore, we found that there was no difference in MIR181A1HG expression across four different types of putative copy number alterations from Genomic Identification of Significant Targets in Cancer (GISTIC) (Supplementary Fig. 1E). We also observed no significant correlation between MIR181A1HG DNA copy number values and MIR181A1HG expression. (Supplementary Fig. 1F).
Collectively, these findings strongly suggest that MIR181A1HG is upregulated in GC and is positively associated with GC clinical feature.
MIR181A1HG facilitates GC cell proliferation in vitro and in vivo
Since the expression of MIR181A1HG was lower in AGS cells and higher in MKN-74 cells (Fig. 1E); we established stable overexpression in AGS cells, and knockdown or scrambled (Scr) -siRNA in MKN-74 and AGS cells. Successful overexpression or knockdown of MIR181A1HG was confirmed by qRT-PCR (Fig. 2 A1-3). To elucidate the function of MIR181A1HG in cell behavior, we performed gain-of-function and loss-of-function assays in vitro. The results showed that the AGS cell proliferation increased following MIR181A1HG overexpression (Fig. 2B1 and C1), while MIR181A1HG knockdown significantly attenuated the proliferative effects in MKN-74 cells, as determined by colony formation and EdU assays (Fig. 2B2 and C2).
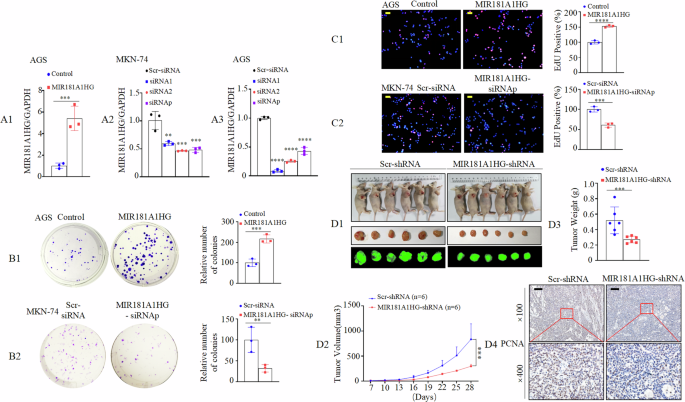
A1–3 Expression of MIR181A1HG in transfected AGS and MKN-74 cell lines were analyzed by qRT-PCR. ***, P < 0.001, Control vs. MIR181A1HG; **, P < 0.05, ***, P < 0.01, and ****, P < 0.001, Scr-siRNA vs. MIR181A1HG-siRNAs. Scr-siRNA, scrambled-siRNA; siRNAp, siRNA pool. B1/2 Effects of MIR181A1HG overexpression (B1) or knockdown (B2) on the proliferation of GC cell lines, as determined by colony formation assay. ***, P < 0.01, Control vs. MIR181A1HG; **, P < 0.05, Scr-siRNA vs. MIR181A1HG-siRNAp. C1/2 Representative micrographs of EdU positivity in cells transfected with control and MIR181A1HG (C1) or Scr-siRNA and MIR181A1HG-siRNAp (C2). Red fluorescence represents EdU-positive cells; blue fluorescence from the Hoechst 33342 stain represents total cells. ****, P < 0.001, Control vs. MIR181A1HG; ***, P < 0.01, Scr-siRNA vs. MIR181A1HG-siRNAp. Scale bars, 50 μm. D1 External whole-body fluorescence images of subcutaneous tumors by injection of MKN–74/copGFP-MIR181A1HG-shRNA and MKN-74/copGFP-Scr-shRNA. D2 Tumor volumes were measured on the indicated days to assess the effects of MIR181A1HG on subcutaneous tumor growth. ***, P < 0.01. D3 Tumors were excised and weighed after all mice were sacrificed. ***, P < 0.01. D4 Cell proliferation rate in MIR181A1HG knockdown tumors was significantly lower than that of Scr-shRNA, as observed by IHC assay with PCNA. Scale bars, 100 μm.
To investigate the effect of MIR181A1HG on cell proliferation in vivo, we constructed and injected Lenti-pLKO.1-copGFP-MIR181A1HG-shRNA and control cells into BALB/c-nu/nu mice subcutaneously (Fig. 2D1, Supplementary Fig. 2A). The tumor volumes of MIR181A1HG knockdown cells were markedly smaller than those of the control cells. The average volume of tumors derived from MIR181A1HG knockdown cells showed a 2.8-fold reduction compared to that of the control (Fig. 2D2). Tumor weights in the MIR181A1HG-shRNA group were significantly lower than those in the control group (Fig. 2D3). Hybridization in situ (ISH) was performed to validate the knockdown efficiency of MIR181A1HG in subcutaneous tumors (Supplementary Fig. 2C) and Immunohistochemistry (IHC) analysis showed that proliferating cell nuclear antigen (PCNA) expression in MIR181A1HG knockdown cells was lower than that in the control group (Fig. 2D4, Supplementary Fig. 2B).
Thus, our results revealed that MIR181A1HG facilitated the proliferation of GC cells in vitro and in vivo.
MIR181A1HG promotes invasiveness and motility by inducing epithelial-mesenchymal transition (EMT) in GC cells
To investigate the effects of MIR181A1HG on cancer cell progression, we performed Transwell and wound healing assays in vitro. Transwell assays, with or without Matrigel, demonstrated that MIR181A1HG overexpression significantly promoted AGS cell invasion and migration, whereas MIR181A1HG knockdown inhibited MKN-74 cell invasion and migration (Fig. 3A1, A2, B1, B2, Supplementary Fig. 3A1, A2, 3B1, B2). The wound healing assay showed that increased MIR181A1HG expression in AGS cells was associated with significantly faster movement (Fig. 3C1, Supplementary Fig. 3C1), whereas decreased MIR181A1HG expression in MKN-74 cells was associated with markedly slower wound closure (Fig. 3C2, Supplementary Fig. 3C2).
Recent findings have uncovered that some lncRNAs regulate TGF-β-induced EMT and cancer cell migration [24, 25]. We analyzed three microarray datasets derived from the Gene Expression Omnibus (GEO) database [GSE54797 (SMMC-7721, liver cancer cells) [26], GSE98225 (HLE B-3: human lens epithelial passage cells), and GSE105053 (ARPE-19, human retinal epithelial cells)] and found that MIR181A1HG expression levels were increased upon TGF-β stimulation in eukaryotic cells (Supplementary Fig. 4A). To determine the role of MIR181A1HG on EMT, we evaluated its response to TGF-β1 in GC-AGS cell lines. The results showed that TGF-β1 induced MIR181A1HG expression in a concentration- and time-dependent manner (Fig. 3D1, D2). Next, we found that MIR181A1HG overexpression increased the expression of the mesenchymal markers (Vimentin and N-cadherin), whereas it decreased epithelial marker (E-cadherin) expression in GC, and vice versa in western blotting (Fig. 3E1, E2). Similar results were obtained with immunofluorescence (Fig. 3F). Subsequently, in the MIR181A1HG overexpression group F-actin staining with phalloidin was observed throughout the cytoplasm and was enriched in the rim zone of the protrusion (Fig. 3G). It was previously reported that EMT enhances cell motility and actin reorganization [27]. Similarly, MIR181A1HG may be involved in regulating EMT in GC cells.
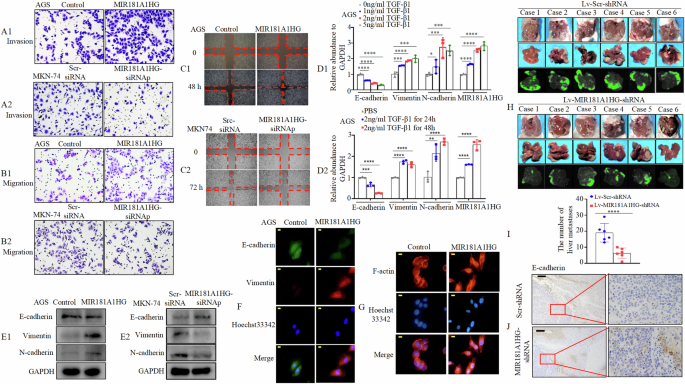
A, B Invasion (A1/2) and migration (B1/2) assays were conducted using GC cells transfected with MIR181A1HG or Control plasmid (A1, B1), MIR181A1HG-siRNAp or Scr-siRNA (A2 & B2). C Wound healing assays were used to detect GC cell motility following transfection with MIR181A1HG or Control plasmid (C1), MIR181A1HG-siRNAp or Scr-siRNA (C2). D1/2 The expression levels of certain molecules were detected by qRT-PCR after TGF-β1 treatment in indicated concentration (D1) and time (D2) in AGS cells. *, P > 0.05, **, P < 0.05, ***, P < 0.01, and ****, P < 0.001. E1/2 Expression of epithelial marker E‐cadherin and mesenchymal markers Vimentin and N-cadherin were detected by western blotting with GAPDH as the internal control. F E-cadherin and Vimentin expressions were detected by fluorescent microscopy. Scale bars, 10 μm. G MIR181A1HG stable overexpression or Control AGS cells were stained with rhodamine-phallotoxin, with F-actin filaments visualized under fluorescent microscopy. Scale bars, 20 μm. H Images of liver and metastatic tumors from intrasplenic liver metastasis model in the MIR181A1HG-shRNA and Scr-shRNA groups. I The number of hepatic metastatic tumors of the MIR181A1HG-shRNA and Scr-shRNA groups. ****, P < 0.001. (J) IHC staining of E-cadherin expressions. Scale bars, 100 μm.
To test the effect of MIR181A1HG on GC metastasis in vivo, MKN-74/MIR181A1HG-shRNA and MKN-74/Scr-shRNA cells were injected into the spleens of nude mice and their livers were dissected four weeks later. Fewer metastatic tumors were observed in the MIR181A1HG-shRNA group than in the Scr-shRNA group (Fig. 3H, I). Hybridization in situ (ISH) was performed to validate the knockdown efficiency of MIR181A1HG in liver metastases (Supplementary Fig. 4B). Furthermore, IHC analysis showed that E-cadherin expression in MIR181A1HG knockdown cells was higher than that in the control group (Fig. 3J).
MIR181A1HG interacts with ELAVL1 to regulate EMT in GC
LncRNAs may form RNA-protein complexes with RNA-binding proteins (RBPs) to exert multiple functions [28, 29]. Hence, we constructed a Venn diagram of the data from the four databases to predict the potential RBPs of MIR181A1HG. The results showed that ELAVL1 and FUS are shared candidate proteins (Fig. 4A). Biotinylated sense MIR181A1HG and antisense MIR181A1HG were incubated with total protein extracts from AGS cells and pulled down using streptavidin. Western blotting confirmed the presence of ELAVL1 in the MIR181A1HG RNA pull-down complex, whereas FUS was not detected (Fig. 4B). The RNA immunoprecipitation (RIP) assay confirmed that MIR181A1HG was enriched in the anti-ELAVL1 group compared to that in the IgG control group (Fig. 4C). Furthermore, fluorescence in situ hybridization and immunofluorescence assays (FISH-IF) validated that both MIR181A1HG and ELAVL1 were mainly colocalized in the nucleus of GC cells (Fig. 4D).
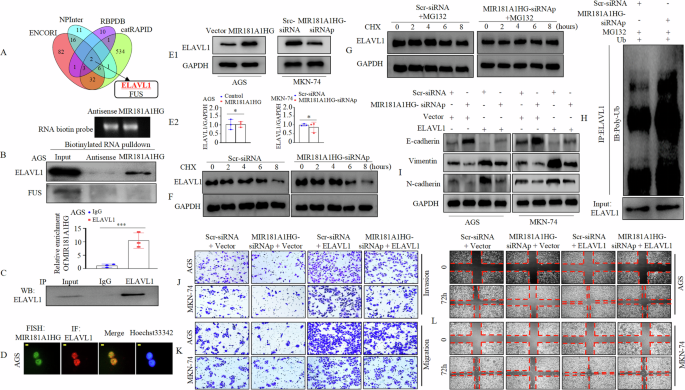
A The Venn diagram indicates the numbers of RNA-binding protein (RBP) that overlapped in four public available bioinformatics databases (ENCORI, NPInter, RBPDB and catRAPID). B MIR181A1HG or its antisense pull-down assays followed by western blotting. C RIP assays to verify the association between MIR181A1HG and ELAVL1 protein. qRT-PCR was performed to test the relative amount of MIR181A1HG associated with ELAVL1 protein or IgG. ***, P < 0.01. D The connection and localization of MIR181A1HG and ELAVL1 was detected by FISH-IF assay. Scale bars, 10 μm. E1 Western blotting of ELAVL1 in MIR181A1HG-overexpressed (Left panel) or MIR181A1HG-repressed (Right panel) and corresponding control from AGS and MKN-74 cells. E2 ELAVL1 mRNA level was detected by qRT-PCR in MIR181A1HG-overexpressed or MIR181A1HG-repressed and corresponding control from GC cells. *, P > 0.05, Control vs. MIR181A1HG and Scr-siRNA vs. MIR181A1HG-siRNAp. (F) MIR181A1HG-repressed or Scr-siRNA MKN-74 cells treated with 100 μM CHX for indicated time followed by western blotting. G Scr-siRNA or MIR181A1HG-siRNAp was transfected into MKN-74 cells and cells were treated with DMSO or CHX with MG132 (10 nM) for indicated periods before western blotting. H The ubiquitin level of ELAVL1 was measured in MIR181A1HG-silenced and Scr-siRNA MKN-74 cells with ubiquitin plasmids transfection and MG132 (10 nM) treatment by western blotting after immunoprecipitation with anti-ELAVL1 antibodies. I Epithelial (E-cadherin) and mesenchymal markers (N-cadherin, Vimentin) were detected by western blotting in AGS and MKN-74 cells. J, K ELAVL1 overexpression rescued the inhibition effect of MIR181A1HG knockdown on GC cell migration and invasion ability. L The mobility of transfected AGS and MKN-74 cells were detected by wound healing assays.
Multiple lncRNAs regulate the stability of their binding proteins[7, 30], so we investigated the relationship between MIR181A1HG and ELAVL1 expression. Our findings demonstrated that MIR181A1HG overexpression in AGS contributed to an enhanced protein level of ELAVL1, and MIR181A1HG knockdown in MKN-74 cells resulted in a decline in the protein expression of ELAVL1 (Fig. 4E1, Supplementary Fig. 5A, B) but did not affect messenger RNA (mRNA) levels (Fig. 4E2). Because ubiquitination modification is a common post-translational method for regulating protein levels, we used the protein synthesis inhibitor cycloheximide (CHX) and found that ELAVL1 protein degradation was significantly enhanced upon MIR181A1HG knockdown (Fig. 4F, Supplementary Fig. 5C). To delve deeper into the mechanism by which MIR181A1HG mediates ELAVL1 protein stability, we treated GC cells with a specific proteasome inhibitor, MG132, and observed that MG132 treatment abolished the reduction in ELAVL1 protein expression upon MIR181A1HG knockdown (Fig. 4G, Supplementary Fig. 5D). These results suggest that ELAVL1 is a substrate of the proteasome and that MIR181A1HG could mediate ELAVL1 in a post-translational manner. The ubiquitin-proteasome pathway is a major pathway that regulates protein stability [3, 30]. We then performed a ubiquitination assay. The results showed that MIR181A1HG knockdown promoted the ubiquitination of ELAVL1 (Fig. 4H).
ELAVL1 is reportedly involved in EMT [31, 32]. We hypothesized that MIR181A1HG contributes to EMT by regulating ELAVL1 expression. Therefore, we first transfected MIR181A1HG-siRNAp or Scr-siRNA cells with ELAVL1 or Vector (Supplementary Fig. 6). Western blotting indicated that ELAVL1 overexpression reversed the effects of MIR181A1HG knockdown on EMT by increasing mesenchymal marker (Vimentin and N-cadherin) expression and decreasing that of the epithelial marker (E-cadherin) (Fig. 4I). Subsequently, we conducted Transwell and wound healing assays. These findings demonstrated that MIR181A1HG knockdown decreased GC cell migration and invasion, which could be mitigated by ELAVL1 overexpression (Fig. 4J, K, Supplementary Fig. 7A, B). Similarly, decreased expression of MIR181A1HG led to slower cellular motility, whereas MIR181A1HG knockdown accompanied by ELAVL1 overexpression rescued this effect (Fig. 4L, Supplementary Fig. 7C, D).
In summary, these findings reveal that MIR181A1HG interacts with and maintains the stability of ELAVL1 to regulate EMT in GC.
MIR181A1HG expression is modulated by intronic miR-181a-5p and miR-181b-5p
MIR181A1HG encodes MIR181A1 (mature miR-181a-5p and mature miR-181a-3p) and MIR181B1 (mature miR-181b-5p and mature miR-181b-3p) in the second intron of a ~ 16-kb primary transcript of chromosome 1q32. 1 (Fig. 5A). Therefore, the expression levels of mature miR-181a-5p, miR-181a-3p, miR-181b-5p, and miR-181b-3p in 73 pairs of human GC and matched non-tumor tissues was assessed using qRT-PCR. The results revealed that miR-181a-5p (Fig. 5B, C) and miR-181b-5p (Fig. 5D, E) were significantly upregulated in GC. However, there were no significant differences in miR-181a-3p and miR-181b-3p expression levels between GC and normal gastric tissues (Supplementary Fig. 8A-D). What’s more, bioinformatics indicated that both MIR181A1 and MIR181B1 are upregulated in GC compared to normal tissues using either unpaired or paired-match Student t-tests (Supplementary Fig. 8E-H). The results of the Kaplan–Meier survival curve analysis indicated that GC patients with high miR-181a-5p or miR-181b-5p expression had shorter OS (Supplementary Fig. 9A, 9D), PFS (Supplementary Fig. 9B, 9E), and DFS (Supplementary Fig. 9C, 9F) than those with low miR-181a-5p or miR-181b-5p expression in the UCSC Xena database (https://xenabrowser.net/datapages/). Subsequently, using qRT-PCR, we found that GC cell lines, except HGC-27 cells, expressed significantly higher levels of miR-181a-5p or miR-181b-5p than normal gastric epithelial cell line GES-1 (Fig. 5F). Similarly, ISH showed that the expression levels of miR-181a-5p and miR-181b-5p were higher than those in normal gastric mucosa (Fig. 5G). These findings suggest that miR-181a-5p and miR-181b-5p may act as oncogenes like MIR181A1HG.
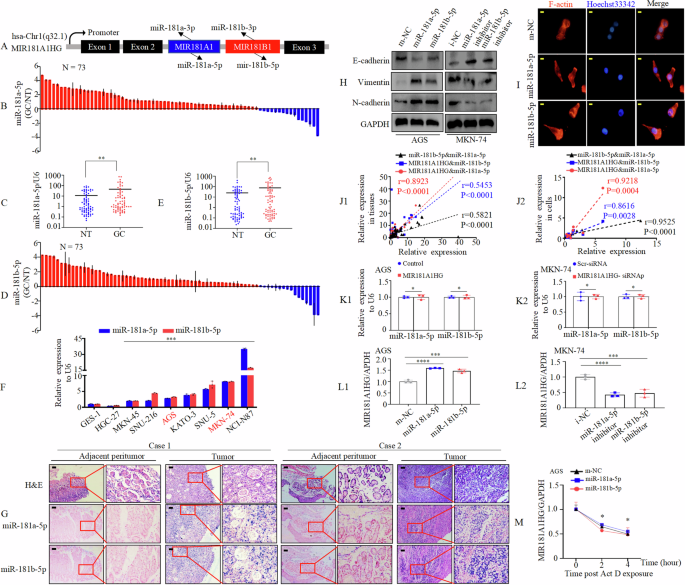
A MIR181A1HG is the host gene of the MIR181A1 and MIR181B1 that embedded in its second intron and generates mature miR-181a-5p, miR-181a-3p, miR-181b-5p and miR-181b-3p. B–E miR-181a-5p (C) and miR-181b-5p (E) expressions level in GC tissues was significantly higher than that observed in NT. GC, GC tissues; NT, normal tissues. Student’s t-test; **, P < 0.05. F Expression of miR-181a-5p or miR-181b-5p in human GC-derived cells compared with GES-1 cells. ***, P < 0.01, GC cell lines vs. GES-1. G Expression of miR-181a-5p and miR-181b-5p in patients with GC detected by H&E and ISH. Representative images of normal and tumor tissues are shown. Scale bars, 100 μm. H The protein expression of E-cadherin, Vimentin and N-cadherin were measured in AGS and MKN-74 cells after transfection miR-181a-5p or miR-181b-5p mimics or inhibitor or corresponding control. I F-actin cytoskeletal arrangement was examined in AGS cells by fluorescence microscopy. Scale bars, 20 μm. J1/2 The correlation of miR-181a-5p or miR-181b-5p and MIR181A1HG expression levels in GC tissues (J1) and cell lines (J2). K1/2 Expression level of miR-181a-5p or miR-181b-5p following of overexpression (K1) or knockdown (K2) of MIR181A1HG in AGS and MKN-74 cells. L1/2 Expression level of MIR181A1HG following of overexpression (L1) or knockdown (L2) of miR-181a-5p or miR-181b-5p in GC cells. M Actinomycin D (10 μg/mL) was applied to GC cells transfected with m-NC, miR-181a-5p or miR-181b-5p. RNA was extracted at indicated time points to detect the RNA level of MIR181A1HG. *, P > 0.05.
Above results suggest that MIR181A1HG induces EMT in GC cells. Kyoto Encyclopedia of Genes and Genomes (KEGG) analysis in the ENCORI database (https://rnasysu.com/encori/mirTarPathways.php) indicates that miR-181a-5p and miR-181b-5p participate in TGF-β signaling as well (Supplementary Figs. 10A1 and 10A2). Transfection of GC cells with miR-181a-5p or miR-181b-5p mimics, confirmed by qRT-PCR (Supplementary Fig. 10B1), showed increased Vimentin and N-cadherin expression and decreased E-cadherin expression levels as determined by western blotting (Fig. 5H) in AGS cells. Enriched miR-181a-5p and miR-181b-5p expression also polymerized F-actin at the rim zone of protrusion (Fig. 5I). Conversely, miR-181a-5p or miR-181b-5p inhibitors increased E-cadherin expression and decreased Vimentin and N-cadherin expression levels in MKN-74 cells (Fig. 5H, Supplementary Fig. 10 B2), indicating inhibiting EMT in GC cells. Above results illustrated that miR-181a-5p or miR-181b-5p induced EMT like MIR181A1HG.
Considering that MIR181A1HG is the host gene for MIR181A1 and MIR181B1, we further investigated the relationship between MIR181A1HG, miR-181a-5p, and miR-181b-5p. We observed that miR-181a-5p or miR-181b-5p expression levels were positively correlated with MIR181A1HG expression levels in GC specimens and GC cells (Fig. 5J1-2). However, enhanced or decreased expression of MIR181A1HG did not appreciably affect the levels of miR-181a-5p or miR-181b-5p (Fig. 5K1-2), as well as MIR181A1 or MIR181B1 (Supplementary Fig. 10C-D). Intriguingly, MIR181A1HG expression was positively affected by miR-181a-5p or miR-181b-5p overexpression or knockdown in GC cells (Fig. 5L1-2). To illustrate how miR-181a-5p or miR-181b-5p influence MIR181A1HG in GC, we incubated AGS cells transfected with miR-181a-5p or miR-181b-5p mimics or the corresponding control with Actinomycin D for the indicated times. The results showed that miR-181a-5p or miR-181b-5p did not affect the half-life of MIR181A1HG, suggesting that miR-181a-5p or miR-181b-5p indirectly affect the transcription of MIR181A1HG (Fig. 5M).
miR-181a-5p or miR-181b-5p influences MIR181A1HG transcription by targeting SOCS3
In many cases, the mature miR-181a-5p and miR-181b-5p are differentially regulated [12, 20, 33]. However, they are nearly identical in sequence, share a seed region, and are predicted to target overlapping sets of genes. Thus, we used a Venn diagram of the data from the seven databases to generate an intersection between miR-181a-5p and miR-181b-5p to search for putative gene targets. Our findings showed that 36 genes were predicted to be the target genes (Fig. 6A). Among these, ABI1 [34], SOCS3 [35], SENP2 [36], KLF15 [37], and DUSP5 [38] were previously found to be expressed at low levels in GC (1 Oct, 2023). Hence, we determined whether these five genes were shared targets of miR-181a-5p and miR-181b-5p. The results indicated that transfection with miR-181a-5p or miR-181b-5p mimics or inhibitors did not consistently influence the mRNA expression levels of ABI1, SENP2, KLF15, and DUSP5. However, miR-181a-5p or miR-181b-5p overexpression or knockdown markedly decreased or increased the mRNA expression of SOCS3 in GC cells (Fig. 6B, Supplementary Fig. 11A). Western blotting further validated that miR-181a-5p or miR-181b-5p overexpression or knockdown reduced or enhanced the SOCS3 protein level (Fig. 6C). To elucidate whether miR-181a-5p or miR-181b-5p modulates MIR181A1HG by targeting SOCS3, we transfected AGS and MKN-74 cells with SOCS3 or a vector plasmid and confirmed this by western blotting (Supplementary Fig. 11B). Further, we transfected AGS cells overexpressing miR-181a-5p or miR-181b-5p with a vector or SOCS3, and found that enhanced SOCS3 expression partially reversed the effect of miR-181a-5p or miR-181b-5p on MIR181A1HG (Supplementary Fig. 11C). Accordingly, SOCS3 may be a common target of miR-181a-5p and miR-181b-5p in the regulation of MIR181A1HG.
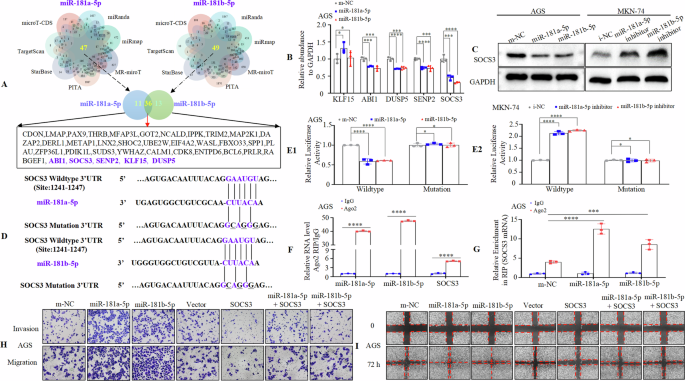
A The Venn diagram indicates the numbers of genes that overlapped in seven public available bioinformatics algorithms (miRanda, miRmap, MS-miroT, PITA, StarBase, TargetScan, microT-CDS). Thirty-six genes were potential targets of miR-181a-5p and miR-181b-5p. B Expression of ABI1, SOCS3, SENP2, KLF15 and DUSP5 genes was analyzed in AGS cells by qRT-PCR. *, P > 0.05, ***, P < 0.01, and ****, P < 0.001. C Western blotting of SOCS3 levels treated with NC, miR-181a-5p or miR-181b-5p mimic or inhibitor in GC cells. D The putative miR-181a-5p and miR-181b-5p- binding site in the SOCS3 3’-UTR. The replaced site is underlined. E1/2 Relative luciferase activity of the reporter constructs harboring WT or MT 3’-UTR of SOCS3 upon co-transfection with m-NC, miR-181a-5p or miR-181b-5p mimic (E1), or i-NC, miR-181a-5p or miR-181b-5p inhibitor (E2) in GC cells. WT, wildtype; MT, mutated. *, P > 0.05, and ****, P < 0.001. F Ago2-RIP was conducted to detect endogenous RNA binding to Ago2; IgG was employed as the control. The levels of miR-181a-5p, miR-181b-5p and SOCS3 were detected by qRT-PCR, and shown as fold-enrichment in Ago2 compared to lgG. ****, P < 0.001. G The RIP assays were performed using Ago2 or IgG to estimate the enrichment of SOCS3 mRNA in AGS cells transfected with miR-181a-5p or miR-181b-5p mimics or m-NC. ***, P < 0.01, and ****, P < 0.001. (H) Invasion and migration assays were conducted using transfected AGS cells. (I) Wound healing assays were used to detect GC cell motility in AGS cells.
To delve deeper, we conducted bioinformatic analysis and found that SOCS3 3′-UTR contains one shared target sequence for miR-181a-5p/miR-181b-5p at position 1241 – 1247 (Fig. 6D). To verify this, we constructed 3′ -UTR reporter plasmids encoding wild-type (WT) or mutant (MT) SOCS3 binding sites for miR-181a-5p/miR-181b-5p (Fig. 6D). Our findings indicated that miR-181a-5p or miR-181b-5p overexpression suppressed (Fig. 6E1), while the miR-181a-5p or miR-181b-5p inhibitor elevated (Fig. 6E2), the luciferase activity of the SOCS3 WT 3′-UTR construct. However, no significant difference was observed between miR-181a-5p or miR-181b-5p enhanced or knockdown group with the corresponding control group when the sequence of the SOCS3-3′-UTR in the site was mutated in GC cells (Fig. 6E1-2). Additionally, an AGO2-RIP assay was conducted in AGS extracts, and the results showed that miR-181a-5p, miR-181b-5p, and SOCS3 mRNA were significantly enriched in the AGO2-containing RNA-induced silencing complex (RISC) compared to anti-IgG immunoprecipitates (Fig. 6F). Furthermore, enhanced miR-181a-5p or miR-181b-5p expression led to elevated enrichment of SOCS3 mRNA in anti-AGO2 immunoprecipitates than the control group (Fig. 6 G). These results suggested that SOCS3 is a direct downstream target of miR-181a-5p/miR-181b-5p.
Previous studies have shown that SOCS3 is downregulated and impedes tumorigenesis in GC [35, 39]. To ascertain SOCS3’s involvement in miR-181a-5p- or miR-181b-5p-mediated EMT, we performed western blotting. GC cells transfected with SOCS3 exhibited decreased Vimentin and N-cadherin expression and increased E-cadherin expression compared to vector cells (Supplementary Fig. 11D). Next, we ascertained whether the effects of miR-181a-5p and miR-181b-5p on GC cell invasion and metastasis were mediated by SOCS3. AGS cells were transfected with m-NC, miR-181a-5p, miR-181b-5p, Vector, SOCS3 plasmids and co-transfected with miR-181a-5p + SOCS3 or miR-181b-5p + SOCS3. Transwell and wound healing assays showed that miR-181a-5p or miR-181b-5p upregulation increased motility, whereas ectopic SOCS3 upregulation with miR-181a-5p or miR-181b-5p partially reversed their influence on invasion and migration capacity compared to control cells (Fig. 6H, I, Supplementary Fig. 11E-H).
Taken together, these data indicated that miR-181a-5p and miR-181b-5p modulate MIR181A1HG expression and promote GC invasion, metastasis, and EMT by targeting SOCS3.
MIR181A1HG is regulated by the NFATC2-SOCS3 complex in GC cells
Previous studies have shown that SOCS3 interacts with transcription factor proteins to regulate downstream target genes and functions as a transcriptional co-repressor [40,41,42]. We hypothesized that the effect of miR-181a-5p/miR-181b-5p on the host gene, MIR181A1HG, could be partially attributed to SOCS3’s transcriptional repression. We identified potential transcription factor proteins associated with SOCS3 using the BioGRID database (https://thebiogrid.org/) and found that SOCS3 may interact with REL (c-REL), ETV6, NFATC2, STAT3, AR, NFKB1, IRF7, RELA(p65), and TFDP1. Knockdown of these nine transcription factors that NFATC2, among others, significantly decreased MIR181A1HG expression in AGS and MKN-74 cells (Fig. 7A, Supplementary Fig. 12A). Interestingly, transfecting GC cells with NFATC2 plasmid (Supplementary Fig. 12B) increased not only MIR181A1HG expression, but also those of miR-181a-5p, and miR-181b-5p (Fig. 7B). Co-immunoprecipitation (co-IP) analysis (Fig. 7C) confirmed NFATC2’s interaction with SOCS3 in GC cells, indicating that SOCS3 may modulate MIR181A1HG transcription by interacting with NFATC2.
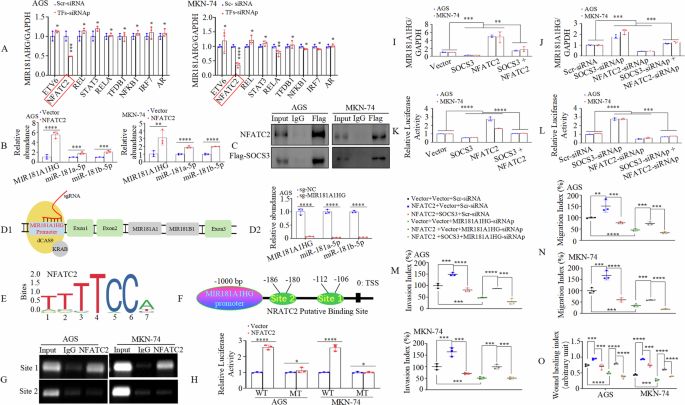
A After transfection with siRNAp of TFs or scrambled-siRNA (Scr-siRNA) in AGS and MKN-74 cells, MIR181A1HG expression was detected using qRT-PCR. *, P > 0.05, and ***, P < 0.01. siRNAp, siRNA pool; TFs, Transcription factors. B The GC cells transfected with NFATC2 or Vector, expression levels of MIR181A1HG, miR-181a-5p or miR-181b-5p were detected by qRT-PCR. **, P < 0.05, ***, P < 0.01, and ****, P < 0.001. C The interactions beween NFATC2 and SOCS3 in AGS and MKN-74 cells were assessed by Co-IP assays using antibodies against Flag-tag (SOCS3). D1 Illustration of CRISPR interference. D2 MIR181A1HG, miR-181a-5p or miR-181b-5p expression were assayed by qRT-PCR with CRISPR interference. (E) The transcriptional factor NFATC2 binding motif was predicted using Jaspar database. F Schematic representation of the promoter region of MIR181A1HG (MIR181A1HGp). G ChIP assay demonstrated the direct binding of NFATC2 to the site 1 of MIR181A1HGp in AGS and MKN-74 cells. H WT or MT MIR181A1HG promoter constructs were co-transfected with NFATC2 or Vector, and the relative luciferase activity was determined. WT: wildtype; MT: mutated. *, P > 0.05, and ****, P < 0.001. I, J MIR181A1HG expression were detected after transfection by qRT-PCR. **, P < 0.05, and ***, P < 0.01. K, L The MIR181A1HG promoter construct was co-transfected with SOCS3 or/and NFATC2 plasmids or siRNAs or corresponding control. Luciferase assays were performed. ***, P < 0.01, and ****, P < 0.001. M, N Invasion (M) and migration (N) assays were conducted and quantitative results are shown in GC cells. **, P < 0.05, ***, P < 0.01, and ****, P < 0.001. (O) Wound closure percentages in GC cells are shown. ***, P < 0.01, and ****, P < 0.001.
Since the abnormal MIR181A1HG expression did not appreciably affect miR-181a-5p or miR-181b-5p expression levels (Fig. 5K1-2) in our previous study, we investigated whether both MIR181A1HG and its intron-derived miR-181a-5p/miR-181b-5p were simultaneously triggered by NFATC2. CRISPR interference (CRISPRi) is an RNA-based method for highly specific silencing of transcription in prokaryotic or eukaryotic cells that sterically prevents the association of gene promoters and transcription factors to block transcription elongation [43, 44]. Therefore, we used CRISPRi with sgRNA targeting the MIR181HG promoter to determine whether MIR181A1HG and miR-181a-5p/miR-181b-5p were co-regulated in GC cells (Fig. 7D1). Results showed that both MIR181A1HG and its intronic miRNAs miR-181a-5p/miR-181b-5p were strikingly repressed in AGS cells (Fig. 7D2). Taken together, these experiments collectively indicate that miR-181a-5p/miR-181b-5p and their host gene MIR181A1HG are co-transcribed in GC.
To validate whether MIR181A1HG is a transcriptional target of NFATC2 (Fig. 7E), we analyzed the human MIR181A1HG gene promoter (1-kb) sequence region (MIR181A1HGp) upstream of the transcription start site (TSS) and identified two most probable NFATC2-binding sites with at least 88% identity to the consensus sequences, (http://jaspar.genereg.net/) (Fig. 7F). Chromatin immunoprecipitation (CHIP) assays performed in AGS and MKN-74 cells showed significant enrichment of MIR181A1HGp site 1, but not site 2, following immunoprecipitation with an anti-NFATC2 antibody. No bands were evident in the immunoprecipitates obtained using control IgG (Fig. 7G). We cloned MIR181A1HGp site 1 into a luciferase reporter plasmid and performed mutagenesis. Co-transfection with the WT and NFATC2 plasmids increased MIR181A1HGp promoter activity in both AGS and MKN-74 cells. In contrast, site-directed mutagenesis did not affect NFATC2 transactivation (Fig. 7H). These results indicate that MIR181A1HG is a direct transactivating target of NFATC2.
To further analyze the relationship between NFATC2-SOCS3 complex and MIR181A1HG expression, we transfected GC cells with NFATC2 or/and SOCS3 plasmid or Vector or NFATC2 or/and SOCS3-siRNAp or Scr-siRNA (Supplementary Fig. 12C). qRT-PCR (Fig. 7I, J), and luciferase reporter assays (Fig. 7K, L) revealed that SOCS3 could counteract the effect of NFATC2 on MIR181AHG transcription.
Given the role of MIR181A1HG in invasion and metastasis, we investigated whether the NFATC2-SOCS3 complex is involved in MIR181A1HG-mediated GC metastasis. Forced NFATC2 expression increased the invasion, migration, and motility of AGS and MKN-74 cells compared to those of the vector cells. However, co-transfection of NFATC2 and SOCS3 plasmids reversed the NFATC2-induced effects as shown by Transwell and wound healing assays (Fig. 7M-O, Supplementary Fig. 12D-F).
Taken together, these results demonstrate that NFATC2 promotes GC invasion and metastasis by transactivating MIR181A1HG, which can be counteracted by SOCS3.
MIR181A1HG expression level is correlated with the expression of five molecules in patients with GC
To further confirm the relationship between NFATC2 or SOCS3 and MIR181A1HG, MIR181A1HG and ELAVL1, and between miR-181a-5p or miR-181b-5p and SOCS3, we performed western blotting (Fig. 8A) and qRT-PCR (Fig. 8B1-B3) to detect their expression levels in 12 pairs of matched clinical specimens from patients with GC. These results indicate that the expression of MIR181A1HG, miR-181a-5p, miR181b-5p, NFATC2, and ELAVL1 was frequently upregulated, whereas that of SOCS3 was downregulated. Furthermore, we detected positive correlations between NFATC2 and MIR181A1HG, MIR181A1HG and ELAVL1, miR-181a-5p or miR-181b-5p and MIR181A1HG (Fig. 8C1, C3-C5). A negative correlation was observed between the SOCS3 and MIR181A1HG levels (Fig. 8C2). Moreover, SOCS3 expression was inversely regulated by miR-181a-5p and miR-181b-5p in GC (Fig. 8D1, D2).
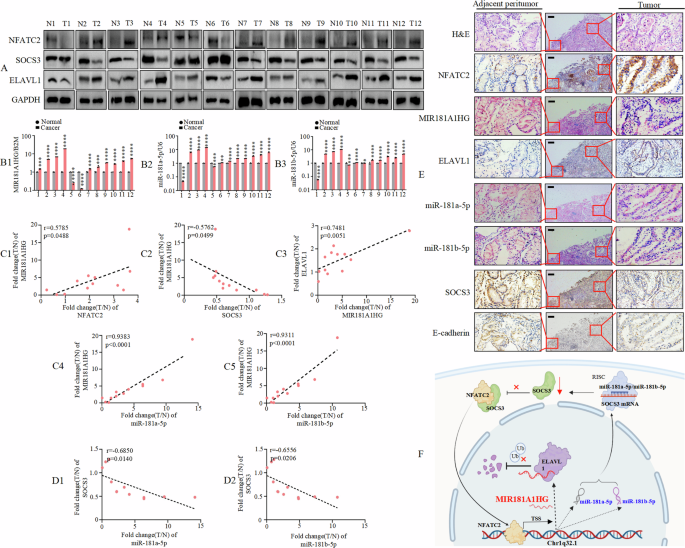
A NFATC2, SOCS3 and ELAVL1 protein levels detected by Western blotting in 12 paired GC tissues; GAPDH was used for normalization. B1-3 MIR181A1HG (B1), miR-181a-5p (B2) and miR-181b-5p (B3) expression levels quantified by qRT-PCR and normalized against B2M or U6 (n = 12). *, P > 0.05, **, P < 0.05, ***, P < 0.01, and ****, P < 0.001. C1–C5 Correlation between NFATC2 and MIR181A1HG expression, or between SOCS3 and MIR181A1HG expression, or between MIR181A1HG and ELAVL1 expression, or between miR-181a-5p/miR-181b-5p and MIR181A1HG expression in 12 pairs GC tissues. D1–D2 Correlation between miR-181a-5p/miR-181b-5p and SOCS3 expression in 12 pairs GC tissues. E NFATC2, ELAVL1, SOCS3 and E-cadherin expression levels in human GC tissue and normal adjacent epithelial tissue were determined by IHC staining while MIR181A1HG, miR-181a-5p and miR-181b-5p expression were detected by ISH. Scale bars, 200 μm. F The signal transduction mechanism of MIR181A1HG.
Furthermore, we monitored the expression of these molecules using IHC and ISH. The expression levels of MIR181A1HG, miR-181a-5p, miR181b-5p, NFATC2, and ELAVL1 were significantly higher, whereas that of SOCS3 and E-cadherin was remarkably lower in GC tissues than in paired normal tissues (Fig. 8E).
Taken together, our study suggests that MIR181A1HG expression level is correlated with the aforementioned molecules in samples from patients with GC (Fig. 8F).
Discussion
In this study, we found that MIR181A1HG was upregulated and facilitated the growth, metastasis, and EMT in GC. Mechanistically, MIR181A1HG interacts with and strengthens the stability of the RNA-binding protein-ELAVL1 to mediate EMT. Moreover, MIR181A1HG is modulated by miR-181a-5p/miR-181b-5p. Specifically, miR-181a-5p or miR-181b-5p mediated MIR181A1HG transcription and influenced the motility and invasion potential of GC cells by targeting and degrading SOCS3 mRNA. SOCS3 interacts with NFATC2, and SOCS3 downregulation facilitates the transcriptional activation of NFATC2 on the MIR181A1HG promoter. These results indicate that MIR181A1HG functions as an oncogene. Its relative modulation network in GC is illustrated in Fig. 8F.
LncRNAs are increasingly known to be involved in the regulation of various cancer types [4, 6, 45]. As a novel lncRNA, MIR181A1HG is categorized as a miRNA-host gene lncRNA. In this study, we showed that MIR181A1HG was significantly upregulated in GC tissues compared to normal tissues, which is also observed in GSE50710, GSE65801 and TCGA-STAD cohort. High MIR181A1HG expression correlates with worse outcome in TCGA-STAD cohort consisting of 406 patients. We observed that ectopic MIR181A1HG expression accelerated cell proliferation and colony formation. Furthermore, MIR181A1HG upregulation promoted GC cell progression by facilitating EMT, which is consistent with a previous study showing that lncRNA-MIR17HG facilitates GC cell migration and invasion [46]. These data indicated that MIR181A1HG plays an oncogenic role and promotes the development and progression of GC.
ELAV-like RNA-binding protein 1 (ELAVL1) is a member of the ELAVL family of RBPs and contains several RNA recognition motifs [6, 7]. Studies have shown that ELAVL1 is upregulated and promotes EMT during tumor progression. For instance, ELAVL1 is upregulated in patients with GC [47], and reduced ELAVL1 expression can suppress osteosarcoma cell migration, invasion, and EMT [48]. In addition, ELAVL1 interacts with various types of RNAs, including coding and non-coding RNA transcripts. For example, ELAVL1 stabilizes SOX9 mRNA and promotes the migration and invasion of breast cancer cells [49] and lncRNA-OCC-1 suppresses cell growth by destabilizing ELAVL1 protein in colorectal cancer (CRC) [50]. In this study, we showed that MIR181A1HG binds to ELAVL1 using RNA pull-down, RIP, and FISH-IF assays. Moreover, protein stability and degradation assays showed that MIR181A1HG knockdown accelerated ELAVL1 degradation via ubiquitination. More importantly, we performed functional assays and found that the repression of MIR181A1HG attenuated the motility and EMT of GC cells, whereas forced ELAVL1 expression reversed the MIR181A1HG knockdown-induced EMT suppression in GC cells. Therefore, we conclude that MIR181A1HG cooperates with ELAVL1 to promote GC cell progression. However, other potential molecules may also involve in MIR181A1HG-induced EMT. Previous study indicated that MIR181A1HG facilitates SOX5 expression by binding to SOX5 promotor in multipotent mesenchymal stromal cells[11]. Since SOX5 is documented as an EMT-driver in multiple cancers [51, 52], it required further investigation about its potential involvement in GC.
Dysregulated expression of lnc-MIRHGs and their embedded miRNAs is frequently observed in various cancers, where they act as tumor suppressors or oncogenes [6,7,8]. For example, increased MIR100HG expression correlates with aggressive behavior and poor prognosis in CRC. MIR100HG-derived miR-100 and miR-125b coordinately contribute to CRC cell growth and progression [53]. Moreover, MIR210HG is expressed concomitantly with miR-210, and the two molecules cooperate to promote GC cell progression [54]. Here, we showed that miR-181a-5p and miR-181b-5p expression were found to be elevated in GC tissues, consistent with previous work from Mi, and Gao et al. [12, 20]. However, we observed no difference in miR-181a-3p/miR-181b-3p expression between GC and normal gastric tissues. LncRNA-MIR181A1HG is the host gene for miR-181a-5p and miR-181a-5p. We further showed that the expression levels of miR-181a-5p and miR-181b-5p were positively associated with MIR181A1HG levels. Abnormal MIR181A1HG expression did not affect miR-181a-5p/miR-181a-5p expression levels. Surprisingly, ectopic expression of miR-181a-5p or miR-181b-5p visibly influenced the level of MIR181A1HG. The function of MIR181A1HG is miR-181a-5p-independent or miR-181b-5p-independent. Nevertheless, MIR181A1HG could function synergistically with miR-181a-5p or miR-181b-5p to facilitate GC progression by stabilizing ELAVL1 protein and destabilizing SOCS3 mRNA, respectively, which is consistent with results reported by Wang et al. [10]. Meanwhile, intronic miR-181a-5p or miR-181b-5p could modulate their host gene MIR181A1HG transcription by SOCS3-NFATC2 feedback loop. These diverse non-coding RNAs may work together to control identical biological processes in different ways by regulating different downstream genes. Thus, the relationship between the host genes MIR181A1HG and miR-181a-5p/miR-181b-5p described in our research offers new evidence for understanding the modes of action of miRNAs and their host genes.
SOCS3 is frequently downregulated in tumors, including GC, and overexpression of SOCS3 induces cell growth arrest [35, 55, 56]. For instance, low SOCS3 expression is an indicator of poor prognosis in patients with GC. SOCS3 acts as a transcriptional corepressor and, associates with transcription factors to regulate the promoter activity of downstream target genes [40, 42]. SOCS3 coordinates with the transcription factor AP-1 to regulate the CNTF promoter activity in neuroblastoma cells. In our study, we revealed that SOCS3 could interact with NFATC2 to mediate the transcription of MIR181A1HG. SOCS3 also could be regulated by multiple miRNAs. For instance, SOCS3 is targeted by miR-3473b [57], miR-203a-3p [58], and miR-155 [59] in cells of different origins. Here, our bioinformatic analysis revealed that SOCS3 3′UTR has a complementary site for both miR-181a-5p and miR-181b-5p and was confirmed as a common target gene of miR-181a-5p/miR-181b-5p by AGO2-RIP and luciferase reporter assays. Moreover, SOCS3 overexpression partially rescued the effects of miR-181a-5p/miR-181b-5p on GC cell metastasis and EMT in Transwell and wound healing assays. Previous reports have shown that miR-181a/b-5p promotes cell proliferation and invasion and induces EMT by directly inhibiting the expression of RASSF6 or PDHX in GC [12] or gallbladder cancer [60], which is consistent with our findings. These results suggest that SOCS3 is essential for miR-181a-5p/miR-181b-5p-mediated MIR181A1HG transcription and biological effects in GC cells.
The transcription factor NFATC2 is a member of the NFAT family and binds to a DNA consensus sequence (5′-GGAAA-3′) (https://jaspar.genereg.net/) to regulate coding genes as well as non-coding RNA expression [41, 61, 62]. Studies have demonstrated that NFATC2 is overexpressed in GC tissues compared to normal tissue margins [63]. NFATC2 binds to the ETS1 promoter to promote breast cancer cell invasion by transactivating ETS1 expression [61]. Furthermore, the transcriptional corepressor SOCS3 cooperates with NFATC2 (previously known as NFATp) to regulate the IL-2 promoter, thereby modulating IL-2 expression in Jurkat T cells [41]. Consistent with the above findings, a co-immunoprecipitation assay showed that SOCS3 can bind to NFATC2 in GC cells. Moreover, ectopic SOCS3 expression weakened the transcriptional activation effect on the MIR181A1HG promoter region and thus co-regulated the transcriptional process of MIR181A1HG in GC cells. NFATC2 overexpression reversed the repressive effect of MIR181A1HG knockdown on cell migration and invasion, whereas SOCS3 overexpression minimized this effect in GC cells. These results suggested that NFATC2 and SOCS3 mutually control MIR181A1HG expression and play important roles in promoting GC cell invasion and metastasis.
However, there may be some limitations of the methods used in our study. For instance, the selection of patient samples may introduce biases since imperfect criteria. Additionally, in vitro experiments are hard to totally replicate the complex environment of human tumors. Furthermore, considering the variability and complexity of lncRNA functions [64], more researches are required to access MIR181A1HG effects across different types of cancers. The presence of different immune or stromal cell types and extracellular matrix components could alter the behavior of lncRNA. Besides, some lncRNAs can perform multiple functions relying on their diverse binding partners [65].Thus, more researches such as establishment of Patient-Derived Xenograft models with varying MIR181A1HG expression would help to assess the effect of MIR181A1HG in vivo in the future. Besides, it would be beneficial to correlate MIR181A1HG expression with clinical outcomes in larger patient cohorts.
In conclusion, MIR181A1HG is upregulated in human GC cells and promotes their malignant phenotype. Mechanistically, MIR181A1HG, activated by miR-181a-5p/miR-181b-5p-SOCS3-NFATC2 positive feedback loop, contributes to GC progression through stabilizing ELAVL1. Thus, our study reveals a novel MIR181A1HG-related mechanism underlying the metastasis of GC cells and identifies a promising prognostic biomarker for GC.
Materials and methods
Available in Supplementary materials and methods.


Responses