Longitudinal markers of cognitive procedural learning in fronto-striatal circuits and putative effects of a BDNF plasticity-related variant

Introduction
Frontal-striatal brain circuits play a major role in procedural learning and automatization in both the motor and cognitive domain1,2,3,4. Neuroimaging studies have repeatedly demonstrated a strong activation of frontal brain regions5,6,7,8, such as the dorsolateral prefrontal cortex (DLPFC), and the striatum4,6,7, with motor tasks involving more dorsal and cognitive task involving more ventral regions of the striatum1,9,10. Typically, repeated training induces a decrease in activation in initially involved brain regions11,12,13,14.
This observation parallels current theories of procedural memory derived from behavioral research, such as the Adaptive Control of Thoughts (ACT) model15,16,17,18. According to ACT, procedural learning occurs in three main stages [1]: an initial encoding, which heavily draws on cognitive demands and which is typically accompanied by a rapid improvement of performance5,6,7,8,9,10,11,12,13,14,15,16,17 [2]; reactivation and modification of the acquired memory with repeated training, which is characterized by a gradually reaching plateau in performance level15,16,17; and [3] transition to a longer-term memory retention, which is associated with a more stable and efficient (automatized) performance, accompanied by reduced cognitive demands (indicated by reduced brain activation or increased gray matter volume, e.g.,3,12,13,14,19,20,21, and reflected by the ability to maintain the acquired skill without further training15,17,18).
Procedural learning across several sessions is often modeled as learning curves which typically follow an exponential function (initial fast decrease of error rates followed by a plateau), also known as the law of practice22. While well established in behavioral research, the modeling of learning-induced changes is less common in imaging studies due to the lack of longitudinal data (but see refs. 23,24). The majority of imaging studies on learning used a pre-post approach to assess changes in brain structure and function at two time points (e.g.,3,12,13,19,). However, this experimental approach does not allow to model the data based on the law of practice assumption, which requires longitudinal data involving more than two time points.
Another line of research on procedural learning comes from the field of human genetics, which has identified a common single nucleotide polymorphism (SNP) of the brain-derived-neurotrophic factor (BDNF) which is expressed ubiquitously throughout the brain25. BDNF promotes neural and synaptic growth and has been associated with long-term memory (LTM)26,27,28 and working memory (WM) performance29,30,31,32. A reduced secretion of BDNF protein was shown for carriers of the BDNF risk variant, where the amino acid valine [Val] is substituted by methionine [Met] at codon 66 (Val66Met) on the nucleotide rs6266533,34. The effect of this polymorphism on brain and behavior has been investigated in studies on learning and memory. For instance, Met allele carriers showed poorer performance in episodic memory27,28, verbal memory tests30,31,32,35,36 and verbal learning37,38 compared to Val homozygotes. Likewise, imaging studies suggested an impact within fronto-striatal regions, showing increased activation and inefficient functional connectivity in prefrontal regions in WM or cognitive control tasks30,39,40,41 and reduced gray matter volume, e.g., in the prefrontal cortex42 in Met allele carriers. However, this research similarly lacks a comprehensive longitudinal characterization of BDNF effects on the behavioral and neural level. A few behavioral pre-post training studies have been performed, with varying time intervals ranging from one day43 to several days26 or months44. These studies showed poorer memory performance in risk allele carriers26,43, which was compensated after several repetitive training days in one study45. However, the temporal evolution of this effect on the neural level remains unclear and calls for a closer investigation.
Our study aimed at characterizing the evolution of procedural learning and automatization over multiple sessions using functional magnetic resonance imaging (fMRI) and at exploring the effects of BDNF Val66Met genotype on the learning process. To this end, we studied verbal working memory learning and automatization across five sessions using a modified Sternberg task, a well-established paradigm for studying frontal-striatal circuit function5,7,12. The fMRI task consisted of four conditions with decreasing demands on learning and automatization, i.e., a practiced condition where memory sets were trained prior to each fMRI session, as well as conditions with shuffled and novel memory sets, along with a low-level control condition (Fig. 1a, b; see methods section for details). Participants were healthy young adults without a prior family history of mental illness. Data were acquired in 11 Val homozygotes and 12 Met-allele carriers (henceforth referred to as Val group and Met group, respectively) across five functional magnetic resonance (fMRI) sessions within a two-week training interval (session s1-s5), resulting in a total of 115 datasets. To characterize procedural learning, we fitted learning curves across sessions s1 to s5, using a linear (y = m*t + c) and an exponential (y = α(τ*t)+ c) model. Considering the so far published findings, we tested the following hypotheses: (i) procedural learning at the behavioral level can be modeled as learning curves whose trajectories differ between BDNF genotype groups. (ii) At the brain level, procedural learning was expected to lead to a gradual, linear or exponential, decrease of activation in fronto-striatal loops which (iii) were also assumed to reflect BDNF-related alterations.

a Trial structure of the Sternberg task, which consisted of three task conditions (novel, shuffled, practiced) reflecting different levels of automatization and a low-level control condition. b Subjects performed five sessions of a modified Sternberg task within 12 days (day 1, 2, 5, 9, 12) labeled as session s1-s5. c Analysis pipeline (see methods section).
Results
Behavioral results: learning curves, goodness of model fit, and model comparison
Procedural learning was modeled as learning curves from session s1 to s5 on the group level for each genotype group to characterize learning gain and learning speed as a function of time. While we expected an exponential curve according to the law of practice, we also tested for a linear change in order to account for the lower-order model. The linear parameter estimates m and the exponential decay constants τ were all negative, indicating a reduction in error rates across sessions, as expected (see Table 1). Goodness of fit (GoF) analyses confirmed a sufficiently good model fit across all task conditions and genotype groups (GoF: Spearman’s ρ = 0.48–0.59; see Supplementary Table 1). The comparison of models within genotype groups using likelihood ratio tests revealed a superiority of the exponential model for all conditions, with strongest evidence in the practiced condition in the Met group (see Table 2). Between group comparisons for the exponential model suggested a better model fit in the Met group compared to the Val group in the practiced and shuffled conditions (see Supplementary Table 2). This effect was driven by higher error rates in the Met group during the first session, which is reflected by marked differences in the resulting model parameters (see Table 1, Fig. 2). Inspection of the learning curves suggests that differences in procedural learning occurred already during the first session, i.e., the pre-training baseline session, which was modulated by task difficulty (practiced > shuffled > novel) and genotype (Val > Met). This resulted in a higher learning gain throughout sessions 1 to 5 in the Met group, reflected by a higher amplitude in the exponential and a higher slope in the linear model compared to the Val group, respectively. This effect was most pronounced in the practiced condition.
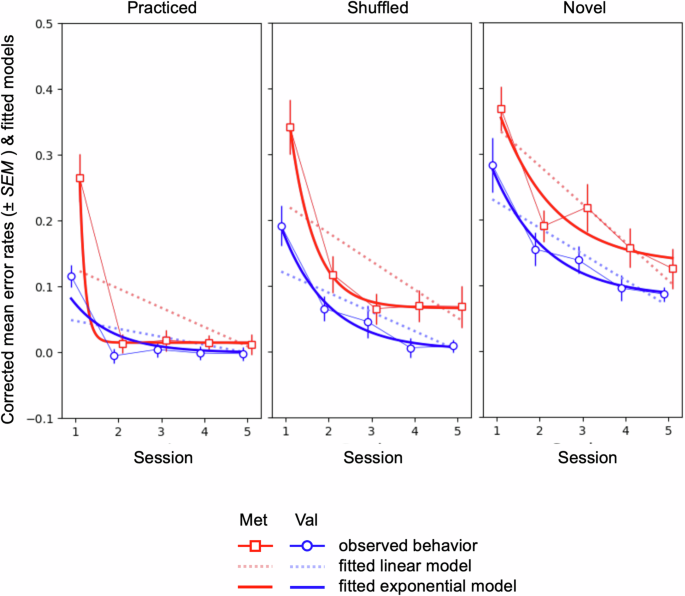
Effect of genotype on learning performance (error rates) for each task condition (practiced, shuffled, novel) across sessions. Displayed are mean error rates (±SEM) and fitted models (linear and exponential model).
Considering the overall better performance of the exponential model, the learning and genotype centered research question of our study, and the limitations in space for the report of this complex dataset, we decided to restrict the further report for this paper to genotype specific differences in brain activation during procedural learning in the practiced condition.
fMRI results: Model fit and effects of genotype in the practiced condition
The effect of genotype in the practiced condition was followed up at the brain level using an analogous curve fitting approach to characterize brain activation trajectories for both genotype groups. Learning curves were modeled as signal decay curves for 246 regions based on a whole brain parcellation approach (see methods section for more detail). While we focused on the exponential model, we also tested linear decay curves to account for the lower-order model (see Supplementary Tables 3 to 5).
First, we calculated GoF to identify those parcels where the learning-induced change in functional activation followed an exponential decline. This revealed a good fit (Spearman’s ρ ≥ 0.3) in a distributed set of brains regions for both genotype groups, including fronto-striatal, parietal, occipitotemporal and thalamic areas (see Fig. 3a, Supplementary Table 4). In a next step, we computed Likelihood ratios (LR) to identify those parcels which demonstrated a significant difference in model fit between genotype groups. These analyses included all parcels with a good fit (Spearman’s ρ ≥ 0.3) in at least one group. Overall, 23 regions (~9% of the total amount of parcels) showed a significant difference in the GoF between genotype groups (see Table 3; see Supplementary Table 5 for a full report including all parcels).
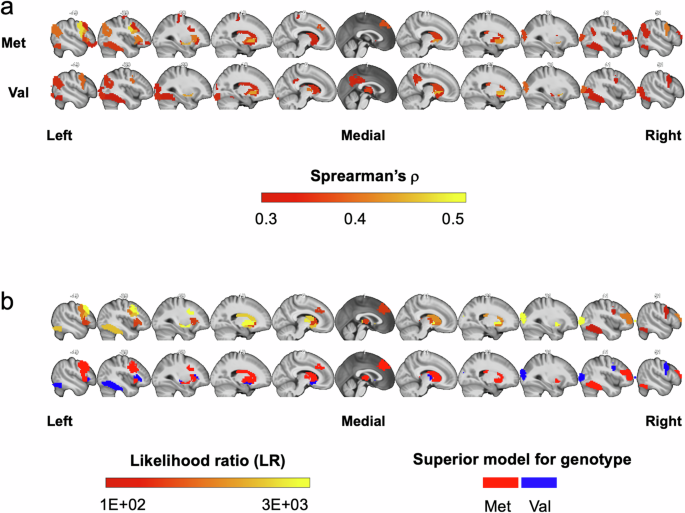
a Illustration of mean goodness of fit (Spearman’s ρ) maps for functional activation for each genotype group in the practiced condition (exponential model). Brain regions with ρ – values > = 0.3 are highlighted in red to yellow colors. b Upper row: Between genotypes model comparison maps. Likelihood ratios (LRs) for brain regions with significant differences in GoF are highlighted in red to yellow colors. Lower row: Brain regions shown in the upper row are colored regarding the genotype in which the exponential model explained more variance.
The majority of these genotype-sensitive parcels (17 parcels, i.e., 74%) demonstrated a better model fit in the Met group (Met: mean log Likelihood = −2.59E + 03; Val: mean log Likelihood = −3.06E + 03) and mainly comprised frontal (8 parcels) and striatal regions (8 parcels). The model parameter pattern showed an overall less pronounced but faster signal decay in the Val group (Val: mean amplitude α = 1.77, SEM [standard error of the mean] = 0.29, mean τ = −4.03, SEM = 1.24) compared to the Met group (Met: mean amplitude α = 2.57, SEM = 0.53, mean τ = −2.86, SEM = 0.92; Table 4). In addition, decay curves in the striatum suggested a pattern of divergence, with similar signal strength for both genotype groups in session 1, followed by a much stronger signal reduction in the Val group. Intriguingly, this pattern was reversed for frontal brain regions, with stronger frontal involvement in session 1 in the Met group, but similar signal strength in both groups in sessions 4 and 5 (see Fig. 4 for the illustration of decay curves in selected brain regions). To follow up on these patterns, we performed a final exploratory analysis step where we tested whether the trajectories derived from these 23 genotype-sensitive parcels allowed to predict genotype group. If shown, this would suggest that the trajectory patterns described above reflect a non-random, systematic difference between the Val and Met group with specific trajectories in frontal and striatal regions, respectively. We therefore performed two decision tree classification analyses, one involving the 11 subcortical (including striatal) parcels and one involving the 12 cortical (including frontal) parcels (see methods section for details). Classification was based on the feature triples tau, amplitude and intercept of the exponential model. For the subcortical parcels, classification accuracy most heavily relied on differences in the intercept and amplitude parameters and was significantly better than chance level (median = 0.82, lower/upper 90%CI boundary = 0.63/0.92). For the cortical parcels, classification accuracy mainly relied on the tau and amplitude parameters and was not significantly better than chance level (median = 0.67, lower/upper 90%CI boundary = 0.42/0.92; see Fig. 1c for a schematic depiction and Supplementary Fig. 1 for more details on the classification results). This suggests that the lack of a pronounced signal decay in subcortical brain regions contributes more strongly to the prediction of the Met genotype than the initially stronger recruitment of frontal brain regions.
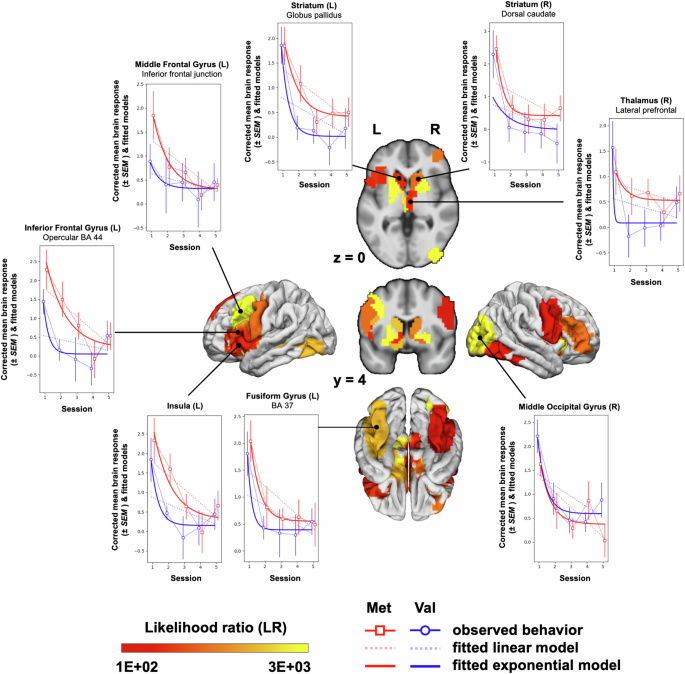
Mean genotype-specific brain responses are displayed as mean contrast estimate (±SEM) (practiced > low-level control) during encoding (Met: red lines and open square markers; Val: blue lines and open circle markers), along with the fitted models (linear model: doted light red and light blue lines; exponential model: solid red and blue lines). Parcels are labeled according to the Human Brainnetome Atlas85.
Discussion
Frontal-striatal brain circuits are important targets for neurotrophin signaling46,47 and play a key role in working memory and procedural learning6,48. However, the longitudinal effects of procedural learning on the functional plasticity of these network and the relationship to BDNF transmission in humans are poorly understood. To address this gap in knowledge, we modeled learning curves to quantify training- and BDNF-related changes in behavioral performance and brain function using an established Sternberg WM task involving different levels of automatization. Our results are five-fold: We show that (i) learning curves can be modeled on both the behavioral and the neurofunctional level in order to characterize longitudinal data in a procedural learning task, and that (ii) these learning curves are sensitive to different levels of automatization as well as to (iii) the effect of BDNF genotype. Focusing on the condition with the highest level of automatization, we further show that (iv) procedural learning and automatization is paralleled by an exponential signal decay in a distributed set of brain regions, including areas within the fronto-striatal loops, with various patterns of signal decay. Finally, we show on a descriptive level that (v) the pattern of BDNF-related differences in behavior is most closely reflected by signal decay curves in frontal cortical areas which demonstrate much stronger activation in risk-allele carriers in the first session but similar activation levels by the end of training (convergence). Striatal and thalamic areas, in contrast, tend to show an oppositive pattern with protracted deactivation in risk-allele carriers and an increasing divergence of BDNF-groups throughout learning. Using a classification approach, we demonstrate the value of these trajectories in predicting BDNF-genotype.
Using a longitudinal data modeling approach, genotype associated differences in learning associated brain activity trajectories could be observed at a systemic level. Several of our findings are well in line with the existing literature. This includes the significant functional engagement of prefrontal cortical regions during early procedural learning7,12,49,50 Here, information processing is ruled by a more controlled, effortful, and capacity-limited mode51, which challenges prefrontal working memory buffers and precedes the formation of a new procedural skill52,53. Similarly, the rapid performance increase and the decline in cortico-striatal-thalamic activation with repeated training are characteristic for procedural learning5,6,7,12 and have been linked to the transition from an early cognitive mode with a high working memory load, induced by the handling of the initially unknown task materials, to a new procedural learning mode, in which separate stimulus-response associations are bound in higher order representations with fewer information elements to relief working memory buffers7,20,54,55,56. We extend this evidence by demonstrating the value of exponential modeling for the analysis of learning-induced changes in task performance and brain function in longitudinal studies. Using this approach, we demonstrate that brain regions conforming to such learning models extend beyond fronto-striatal circuits, including a distributed set of cortical regions in anterior and posterior parts of the brain, as previously shown57. This also complements evidence from network neuroscience, where individual differences in the rate of procedural motor learning was paralleled by the amount of learning-induced segregation from a frontal-striatal network23.
Beside the confirmation of previous findings, our data provide new insights on the role of BDNF in cognitive performance and procedural learning. In line with previous studies targeting declarative memory36, risk allele carriers showed an overall higher level of error rates and protracted learning. However, meta-analytical evidence suggests substantial heterogeneity and, on average, no effect of BDNF on executive functioning, including working memory and attention58,59, both of which are directly involved in the cognitively demanding portions of our Sternberg task (e.g., in the novel condition or at the beginning of training). Another line of research has investigated the effect of BDNF on motor skill learning60, which is similarly controversial and does not support the claim of a robust effect of genotype according to a recent meta-analysis61. However, three studies with repeated training across several days allow a more direct comparison to our results. In Fritsch et al. (2010)60 participants performed a procedural motor learning task (pinch force task) on 5 training days and reported equal performance at baseline and reduced motor skill learning in risk allele carriers. Another study62 used a motor learning task (marble navigation task) on 12 training days with equal behavioral performance in both genotype groups across all time points but reduced cortical plasticity in risk allele carriers at day 1, which was overcome after 5 days of intensive training. Finally, one study45 used an associative verbal learning task on 4 training days and reported a stronger decrease of delayed responses at the beginning of training and a stronger increase of correct responses at the end of training in risk allele carriers. This pattern is well in line with the observation of a higher learning gain in risk allele carriers obtained by our exponential learning curves, which could be linked to a particularly pronounced difference in pWM performance at the beginning of training and a gradual reduction of this difference across sessions. Our finding therefore adds to evidence that BDNF-related deficits can be overcome with repeated training45,62. These findings lend support to the crucial role of BDNF in early long-term potentiation (LTP)63, which allows for a rapid increase in synaptic transmission efficiency and which has been shown to be affected by the Val66Met-allele polymorphism30,64. Intriguingly, the assumption of protracted plasticity in risk allele carriers can be reconciled with our observation of an initial over-engagement of the pre-frontal cortex, as reflected by our exponential decay modeling in frontal areas. Heightened and sustained DLPFC activation levels have previously been interpreted as physiological signals for inefficient neural processing and prefrontal capacity limitations65,66,67 and it is conceivable that such a deficit would manifest in the early phase of procedural learning which has the highest executive control demands. In sum, these data suggest that carriers of the mutant BDNF allele need to draw more on prefrontal resources to cope with the early encoding demands of our procedural learning task.
In contrast, signal decay patterns were gradually diverging between BDFN genotypes for subcortical brain regions, such as the striatum, which even allowed for successful classification of genotype group. Previous research has shown a gradual decrease in striatal activation during cognitive skill learning in both humans and animals5,12,14,68. Evidence supports the hypothesis that the basal ganglia crucially support the acquisition of new content during training while their contribution ends as soon as the behavior is automized and overlearned68,69. Based on these data, the role of the striatum within cortico-striatal loops was suggested to be that of a trainer of cortico-cortical connections, thereby supporting the consolidation of new associations57. Our observation of a rapid decline of striatal activation in the practiced condition, i.e., the condition with the fastest rate of automatization, conforms to this assumption. In addition, our data suggest that this striatal contribution is affected by BDNF genotype, potentially as a result of alterations in early long-term potentiation as outlined above.
Some aspects of our work require special consideration. First, we extend an established method for the modeling of training-related performance changes to the brain functional domain, thereby assuming the comparability of training-induced temporal dynamics across different observational levels. Secondly, the complexity of our experimental protocol required several choices to restrict the analysis, especially in imaging space (e.g., the focus on a single condition). These analytical restrictions contributed to the exploratory nature of this research, which requires further validation of the reported effects in follow-up studies. Thirdly, the sample size of our longitudinal study is limited, in particular for the exploration of genotype-specific effects which typically requires much larger sample sizes to ensure sufficient statistical power. However, only a few behavioral studies45,62 and no neuroimaging study to date have addressed the neural underpinnings of cognitive procedural learning by means of a similarly elaborate learning experiment with extended training periods and multiple follow-up assessments covering weeks and months. This work is therefore considered exploratory in establishing a new approach that need to be followed up in future well-powered studies, including the study of potential confounders and moderators, such as age or sex70,71. Fourthly, although the effects of the mutant Met-allele on BDNF transmission are well-established, the provided link to frontal-striatal plasticity and human cognitive procedural learning is naturally indirect and was only provided on a descriptive level without a statistically based measure of a brain-behavior association. As a result, this study cannot dissect the specific neural mechanisms by which lower activity-dependent BDNF secretion impacts the encoding and retention of pWM contents. Finally, the existing evidence on cognitive procedural learning and frontal-striatal plasticity in humans is sparse. Thus, the interpretation of our data relies in parts on neuroscience insights from other procedural learning domains and species, for which common neural mechanistic processes have been proposed50.
In conclusion, this study demonstrates the utility of longitudinal data modeling of the time courses of behavior and brain function for the study of the mechanistic underpinnings of cognitive procedural learning and frontal-striatal plasticity in humans. Our data further point to a role of BDNF in modulating the neurofunctional readouts which might contribute to interindividual differences in automatization of pWM contents.
Methods
Participants and genotyping procedures
We included 23 healthy right-handed individuals (28 ± 7.7 years, 16 females, all Caucasians). None of the enrolled participants reported a history of severe general medical, neurological or psychiatric illness, as assessed using the MINI-DIPS, a short structured clinical interview for diagnosing mental disorders72. Further, none of the subjects reported lifetime or current psychiatric or neurological medication. The study was conducted in accordance with the 1964 Declaration of Helsinki. All individuals provided written informed consent for a protocol approved by the Ethics Committee of the Medical Faculty Mannheim at the University of Heidelberg (2011-254N-MA). See Table 5 for details on sample characteristics.
For our analysis exploring the effect of the BDNF polymorphism on learning, the Val66Met single-nucleotide polymorphism (rs6265) in the 5’ promoter region of the BDNF-Gene was determined using PsychChip arrays (Illumina, San Diego, CA). Eleven subjects were Val/Val homozygous (non-risk allele carriers), 12 subjects were Met allele (risk allele) carriers. We applied standard methods to extract genomic DNA from Ethylenediaminetetraacetic acid blood using the Chemagic 360 instrument (Perkin Elmer) to perform genome-wide SNP genotyping of a large sample (n = 250, previously reported (4)) which the current individuals were a part of, using the Infinium PsychArray (Illumina Inc). In this study, only SNP BDNF val66met (rs6265) was considered. Further analyses including quality control and imputation was performed with Gimpute 73as previously reported74.In brief, this included the following steps: Removal of SNPs with sex chromosome heterozygosity, a missing rate greater than 0.05, deviation from Hardy-Weinberg equilibrium in controls (P < 10–6), autosomal heterozygosity deviation of greater than 0.2, and removal of samples with a missing rate greater than 0.02. In the next step, phasing and imputation was conducted using SHAPEIT and IMPUTE2 75,76,77with the imputation reference panel from the 1000 Genome Project dataset (August 2012, 30,069,288 variants, release “v3.macGT1”). After imputation, only SNPs with an imputation INFO score larger than 0.6, and minor allele frequencies larger than 0.01 were retained and successfully imputed in at least 20 individuals. The proportion of alleles shared identity-by-decent estimated using PLINK78, (www.cog-genomics.org/plink/1.9/) was used to identify relatedness for all pairs of samples. A threshold of (hat{pi }, > ,0.2) was used to identify related pairs of samples and exclude one member of each pair at random. In a last step, a PCA on the linkage-disequilibrium pruned set of autosomal SNPs was performed using GCTA79(to control for population stratification, then outliers whose principal components were larger than six standard deviations from the group mean were excluded).
Verbal working memory paradigm and task training
Participants performed a modified Sternberg task5,7,12 (Fig. 1a). Each trial consisted of an encoding phase and a retrieval phase. In the encoding phase (3500 ms), a target set of seven consonants (e.g., “DCKWXMB”) was presented and had to be memorized. In the retrieval phase with a duration of approximately 17 s, subjects were consecutively presented six single letter probes (e.g., “D”) and had to indicate by button press whether it was part of the target set or not (see7 for further details on the task). Using this task, we have previously shown a stronger involvement of frontal-striatal regions during the encoding (compared to the retrieval) of working memory items7. The current analyses therefore focused on the encoding phase.
In order to study effects of learning and automatization across 5 sessions, four conditions with different levels of automatization were designed and presented during each session. In the practiced condition (highest level of automatization), a well-trained target set (e.g., “TRKQZSV”) was presented in a fixed order. In the shuffled condition (intermediate level of automatization), the pre-trained target set was presented in a shuffled order (e.g., “KTVRSQZ”). In the novel condition (lowest level of automatization), subjects had to memorize an entirely novel target set (e.g., “PXGMWFN”). Finally, in the low-level control condition, the target set consisted of seven identical vowels (e.g., “AAAAAAA”). Conditions were presented six times each in a pseudo-randomized and counterbalanced order. Total task duration was 8.8 min. Training of the target set for the practiced condition took place from the second session onwards and was performed immediately prior to the Sternberg task during the preceding structural MR scan. The training consisted of 6 trials where the fixed individual target set (e.g., “TRKQZSV”) was presented (encoding phase), followed by 25 single letter probes (retrieval phase; total duration 6 min). The training data was not further considered in the current analyses.
fMRI data acquisition, preprocessing, and first-level analysis
Functional neuroimaging was performed on a 3 Tesla whole body MR Scanner (Siemens, Erlangen, Germany) with a 32-channel head coil (parallel imaging; generalized autocalibrating partially parallel acquisition (GRAPPA); iPAT=2). Functional images were acquired in a descending order with a gradient-echo echo-planar imaging (EPI) sequence (TR = 1790 ms, TE = 28 ms, flip angle = 76°, 34 axial slices, 3 mm slice thickness, 1 mm gap, matrix size: 64 × 64, field of view (FoV): 192 × 192 mm; whole brain coverage was ensured by tilting the FoV to −25° from the individual anterior commissure – posterior commissure line). Data preprocessing was performed using the Statistical Parametric Mapping software (SPM12; http://www.fil.ion.ucl.ac.uk/spm/software/spm12/). Briefly, this included acquisition time correction, two pass motion correction, warping to the Montreal Neurological Institute (MNI) EPI template, and spatial smoothing with an 8 mm full-width at half-maximum Gaussian kernel.
For fMRI data quality assurance, we assessed the individual head motion parameters estimated by SPM12 and the signal-to-noise ratio. Using the corresponding parameter estimates we computed (1) the average translation and rotation across the time series, (2) the frame-wise Euclidean displacement 80and its average. Using the fMRI data quality toolbox81, we additionally assessed raw data quality using the parameters signal-to-noise ratio and number of spikes. We statistically compared these image quality measures between the two genotype groups with SPSS22 (IBM SPSS Statistics, Chicago, IL) using repeated measures ANOVA (time as within-subject factor and genotype as between subject factor). As detailed in the Table 5, both genotype groups were well balanced for all data quality assurance measures (all P > 0.12), suggesting that the reported findings are unlikely influenced by genotype-dependent differences in image quality.
For statistical data analysis at the subject level, we defined a general linear model including the following task regressors: four regressors for each condition in the encoding phase, four regressors for each condition in retrieval phase, and one regressor for the cue that indicated a new trial. These regressors were modeled using a delta (stick) function for the encoding phase (to best account for phasic changes in the neural response to the target set) and for the cue, and a boxcar function with a duration of 17 s for the retrieval phase. Task regressors were convolved with the hemodynamic response function (HRF). The six realignment parameters were included to account for head motion. During model estimation, the data were high-pass filtered with a cutoff of 128 s and an autoregressive model of the first order was applied.
Behavioral analysis: modeling of learning curves
Behavioral performance was assessed as errors rates for each condition and session. The data of the experimental conditions (practiced, shuffled, novel) were corrected for unspecific effects, such as attention or fatigue, by subtracting the respective error rates obtained by the low-level control condition. The resulting longitudinal data were modeled as learning curves from session s1 to s5 on the group level for each genotype group to characterize learning as a function of time. This approach bears the advantage of reducing the dimensionality of data while capturing central aspects of learning in longitudinal data. While we expected an exponential curve according to the law of practice22, we also tested for a linear change in order to account for the lower-order model. To this end, we fitted a linear (y = m*t + c) and an exponential (y = α(τ*t)+ c) model to compare model fits between genotype groups. In the linear model, learning gain (i.e., the relative increase in performance) and learning speed can be characterized by a joint assessment of intercept and slope. In contrast, the exponential model allows for an independent assessment of learning gain (using the parameter α) and learning speed (using the parameter τ). All analyses were carried out using Python (Ver. 3.11) and the open-source packages mentioned below. Model parameters were estimated using the automated molecular excitation Bayesian line-fitting algorithm (AMOEBA82,) implemented in the BayesicFitting package (Ver. 3.2.0, https://github.com/dokester/BayesicFitting83😉 assuming a Poisson error distribution. Model fit was computed as goodness of fit (GoF) using Spearman’s ρ. For model comparison, logarithmic likelihoods (logL) obtained from these fits were used to compute Likelihood ratios (LR) between BDNF groups for each model (LRLin = 2(logLLinMet – logLLinVal); LRExp = 2(logLExpMet – logLExpVal)) with subsequent χ2-test (df = 1) to obtain the corresponding p value (SciPy Ver. 1.13.0, https://docs.scipy.org84,). Finally, p-values were corrected for multiple tests using a classical Bonferroni correction leading to critical p values of P < 1.6E-2. Only data passing this threshold were considered for report, display, and discussion.
fMRI analysis: modeling of learning curves
Brain functional analyses followed the same rationale of fitting learning curves. Since the behavioral results demonstrated a strong genotype effect in the condition with the highest level of automatization (practiced condition, see results section) and the related exponential models, fMRI analyses focused on the exponential modeling of learning curves in the practiced condition. This allowed us to (i) explore the neural correlates of procedural learning and automatization at the brain level and to (ii) follow up specifically on the effect of genotype. In a first step, for each session, brain responses (beta estimates) during the encoding phase of the practiced condition were corrected for unspecific time variant effects by contrasting them against the low-level control condition. In a next step, in order to model learning curves on a whole-brain level, these contrast images were parcellated into 246 regions using the Brainnetome atlas (https://atlas.brainnetome.org85😉 and the mean values of the regions were extracted using the nibabel package (Ver. 5.2.1, https://pypi.org/project/nibabel/86;). In a third step, models were fitted into longitudinal data on the group level for each genotype group. The estimation of model parameters, calculation of GoF, and model comparisons between genotype groups were performed as detailed above. P-values were corrected for multiple tests using a classical Bonferroni correction leading to critical p-values of 2.0E-4. To further exclude incidental findings in brain data model comparison, at least one of the compared models must show a goodness of fit above Spearmann’s ρ ≥ 0.3 (min(ρ(Met | Val)) ≥ 0.3). Only data passing these thresholds were considered for report, display and discussion. A full report of all results can be found in the supplementary results (Supplementary Tables 3 and 4). A schematic depiction of the analysis pipeline is given in Fig. 1c.
Resulting trajectories suggested a systematic, genotype-specific pattern for those cortical and subcortical parcels that demonstrated a significant difference in model fit between genotype groups. We therefore performed an additional exploratory analysis to test whether a certain cortical or subcortical parcel can be assigned to a certain genotype based on the feature triples tau, amplitude and intercept of the exponential model. We used a decision tree classification with a gini impurity split criterion, three leave nodes and a 2-fold random permutations cross-validation with 999 passes for each set of subcortical (11 parcels) and cortical (12 parcels) regions. For this purpose, (1) the region-specific model parameters were divided into an equally sized training and test sample, (2) the optimal decision tree was constructed on the basis of the training sample and (3) the classification quality was calculated on the basis of the test sample. In order to estimate the 90% confidence interval of the classification quality, this procedure was performed 999 times. To control for spurious effects, the same algorithm was used with model parameters permuted independently over the regions. For all computations, the scikit-learn toolbox87 (https://scikit-learn.org/stable/index.html) were used.
Responses