Longitudinal multi-omics in alpha-synuclein Drosophila model discriminates disease- from age-associated pathologies in Parkinson’s disease

Introduction
Neurodegenerative diseases are, by definition, progressive: the dysfunction begins in one particular brain region or neuronal type and intensifies over time, ramifying outward to alter the functions of multiple brain regions. Such is the case with Parkinson’s disease (PD). Loss of dopaminergic neurons in the substantia nigra pars compacta and serotonergic neurons in the dorsal raphe nuclei inhibits the thalamus and eventually affects the entire basal ganglia circuit and neocortex1, leading to the development of the classic PD motor triad of tremor, bradykinesia, and rigidity after a period of many years. Of course, aging is also progressive, and it is the chief risk factor for the development of PD2.
Developing a treatment that could alter the course of PD would require understanding the chain of events that leads from the earliest pathologic changes to later disease stages. A number of transcriptomic and proteomic studies have analyzed human PD brain tissue3,4,5,6,7,8,9, but to our knowledge, only one has sought to map transcriptomic changes throughout the progression of PD6—and given the scarcity of samples from people who died before developing advanced PD, they had to combine Braak stages 1-4, which makes it difficult to trace the evolution of the disease from early to late stages. Another complication of human post-mortem studies is that the brains of many elderly PD patients show pathological signs of Alzheimer’s disease (AD) as well, with amyloid plaques and tau tangles10,11,12. These co-pathologies can be as prominent as Lewy bodies, which are characteristic of PD13,14 and may influence gene expression. Performing parallel studies on mouse models of AD and PD could help delineate the changes induced by a specific disease-related protein15,16,17, but because these diseases are usually idiopathic in humans it is challenging to develop accurate animal models18,19,20,21,22,23. Models of genetic forms of PD such as transgenic alpha-synuclein (SNCA) mice or LRRK2, PRKN, or PINK1 mutant mice do not replicate the dopaminergic degeneration seen in PD or the classic motor triad but have nonetheless been useful for surveys of differential expression, although most studies have been cross-sectional and have considered transcripts or proteins, but not both18,19,20.
Drosophila melanogaster models, however, have provided a powerful means to complement human and mouse studies and capture the progression and mechanisms of neurodegeneration because of their conservation of disease-related pathways, their genetic tractability, and suitability for high-throughput experimentation24,25,26. A transgenic PD fly model expressing pan-neuronal human αSyn recapitulates many PD pathologies such as αSyn accumulation and aggregation, dopaminergic neuron degeneration, and progressive locomotor deficits26,27,28,29. We therefore generated αSyn flies, similar to those previously described26, to conduct longitudinal RNA-seq and tandem mass tag-based mass spectrometry (TMT-MS) experiments to better interpret existing human post-mortem data.
Results
Cross-sectional differential expression analysis identifies concordant signatures of αSyn neurotoxicity
To gain insight into mechanisms of pathogenesis we generated flies expressing αSyn26 in neurons under the pan-neuronal elav-Gal4 driver. Immunoblotting analyses in these flies show the expected expression of the αSyn transgene consistent with age-dependent elav activity30, and immunofluorescence studies reveal the aggregation of intracellular αSyn positive inclusions that are reminiscent of Lewy-bodies found in humans31 and disease models32,33 (Supplementary Fig. 1). We collected brain samples for RNA-seq and TMT-MS studies at nine time points for the control genotypes (up to day 56 post-eclosion, PE) and six time points for the αSyn genotype (up to day 21 PE, since they have a reduced lifespan; Fig. 1A), to directly compare the signatures of normal aging and αSyn pathology over the entire lifespan. Longitudinal behavioral screening of αSyn flies continues up to 31 days, while samples for omics analyses are collected only until day 21. This discrepancy arises from the high attrition rate in the αSyn cohort, which is compatible with the smaller sample sizes needed for behavioral screening but insufficient for the larger sample sizes required for transcriptomic and proteomic analyses. The pan-neuronal expression of αSyn significantly accelerated age-dependent behavioral impairments such as loss of climbing speed and increased rates of stumbling and turning (Fig. 1B). In total, RNA-seq captured transcripts from 17,478 genes, mass-spec captured 6456 unique peptides belonging to 6128 proteins/genes; 5817 genes had both transcript and protein quantifications. Quality control metrics such as variance partition and dimension reduction can be found in Supplementary Figs. 2 and 3.

A Samples were collected at multiple timepoints up to 57 days post-eclosion. RNA-seq (3 replicates each), mass-spec (TMT-MS, 3 replicates each), and behavioral screening were done at each time point. In addition, single-cell RNA-seq was performed on dissected fly brains at a single timepoint, day 10. B Longitudinal behavioral metrics performed on the same cohort of flies used for multi-omic analyses reveal age-dependent decreases in climbing speed and increases in stumbling and turning rate. Note that longitudinal behavioral screening of the αSyn flies extends to 31 days, while samples collected for omic-analysis end at day 21; this is a consequence of the high attrition of the αSyn cohort that is compatible with the limited numbers required for behavioral screening, but not compatible with the numbers required for transcriptomic and proteomic analyses.
To disentangle age-dependent and disease-associated alterations, we analyzed differential expression (DE) cross-sectionally, comparing the PD model flies with the healthy aging control lines at each time point (Fig. 2A, Supplementary Fig. 4, Supplementary Tables 1 and 2). Analysis of the transcriptome and proteome yielded similar proportions of differentially expressed genes (DEGs) and proteins (DEPs) at most time points, although significance cutoffs were calibrated to match the different technical limitations of RNA-seq and TMT-MS. To validate the results of TMT-MS, we analyzed an additional independent cohort of flies at a single time point (Day 10, Supplementary Fig. 5). The results were largely concordant with the original cohort and show that our DE results are reliably reproducible. When comparing the DE results for the original RNA-seq and TMT-MS cohorts, there were more DEGs and DEPs in the middle of the disease course (e.g. Day 10 had 969 DEGs and 537 DEPs) than at the first (778 DEGs and 375 DEPs) and last (1007 DEGs and 63 DEPs) time points tested (Supplementary Fig. 4). This trend was not explained by technical artifacts such as batch effects or missing data but reflects the fact that at the end stage of the disease, neuronal loss and consequent changes in the cellular composition of the brain tissues studied limit the ability to find DEGs. Similar trends have been found in other animal models of neurodegeneration34.
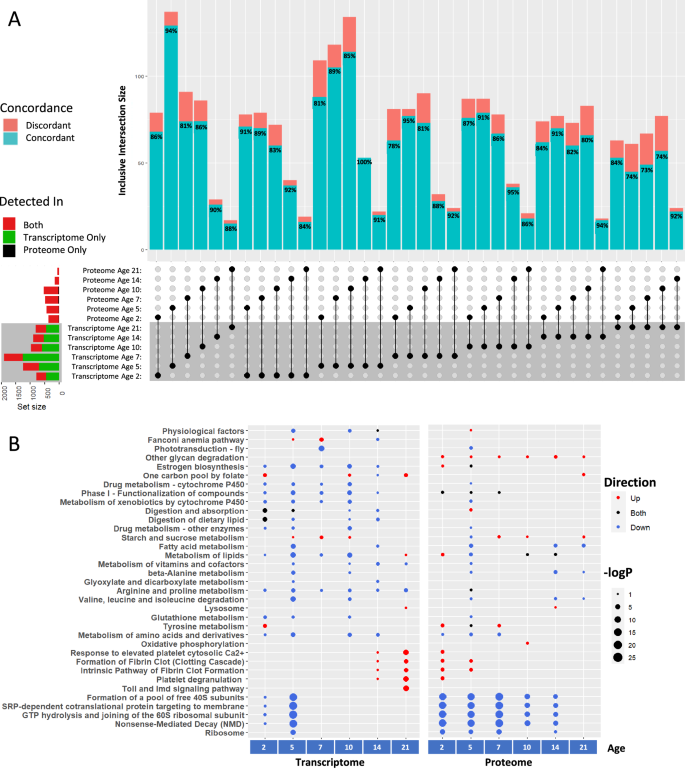
A DEGs and DEPs overlap significantly, and concordance varies between 73% and 100%. UpSet plot shows the inclusive overlaps and genes are considered DE if they have an FDR < 0.05, and a |log2FC| > 0.5 for the transcriptome and 0.25 for the proteome. Concordance percentages compare the concordance of effect direction for the overlapping DEGs/DEPs. Horizontal bars on the left side of the graph represent the total number of DEGs/DEPs at that time point and the proportion of those genes that were detected in RNA-seq only (green), mass-spec only (black), or in both (red). B Functional enrichments (Reactome and KEGG) of the cross-sectional DEGs and DEPs. Circle color reflects the direction of dysregulation and circle sizes are scaled continuously from the –log10(p-value) of the enrichment.
As expected, there were far more DEGs than DEPs. Given this imbalance, the amount of overlap between transcriptome and proteome (DEGs and DEPs) varied between 4% and 16% depending on the time point. The overlap between these DEGs and DEPs increased to up to 25% when limiting the analysis to only those genes detected in both RNA-seq and TMT-MS. To determine the concordance of these overlapping DEGs and DEPs, we compared the direction of expression change at each time point and found high (73–94%) concordance (Fig. 2A). We also correlated the genome-wide transcriptomic and proteomic log-fold changes between αSyn and driver controls (Supplementary Fig. 6). For all comparisons, there was a positive correlation between transcript and protein. Interestingly, the lowest (but still positive) correlations between transcriptomic and proteomic datasets occurred at a late time point (day 21). The lower correlation in late-stage disease parallels the age-dependent incongruence in transcript and protein levels that has been shown in post-mortem human brain tissue from PD cases35.
Since ~66% of human genes are conserved in Drosophila, functional annotation is made possible through cross-species inferred interactions, which fill in an otherwise incomplete annotation database36. Therefore, we used Drosophila Reactome and KEGG over-representation analyses on the upregulated and downregulated genes from the cross-sectional -omics data (Fig. 2B, Supplementary Table 3). From the earliest stages, the most strongly downregulated pathways were translational (the formation of 40S subunits, SRP-dependent cotranslational protein targeting the membrane, and GTP hydrolysis during translation). The transcriptomic changes were most notable on days 2 and 5 while proteomic data showed changes from days 2 to 14. Dysregulation of the ribosomal machinery has been gaining increasing recognition in PD37 and has previously been observed in post-mortem PD4,5,38,39; our results indicate that the change occurs well before the end stages of the disease.
Among the most upregulated pathways was the fibrin clotting cascade, an evolutionary byproduct of the innate immune system (and often categorized as such), which was upregulated late (days 14 and 21) in the transcriptome but early (days 2 and 5) in the proteomic data. This interesting temporal discrepancy seems to be caused by an enrichment of SERPIN (Serine Protease Inhibitors) gene dysregulation in both models, but the exact genes are different. Specifically, Nec, Spn28Dc, Spn42De, Spn31A, Spn47C, and Spn77Bc were upregulated late in the transcriptome, but Spn27A, Spn42Da, Spn47C, Spn55B, and Spn43Ab were upregulated early in the proteome. Interestingly, human homologs of these SERPINs (SERPINH1, SERPINF2, SERPINC1, SERPINA3, SERPINA1, and SERPINE2), which are related to inflammation and coagulation, are concordantly upregulated in post-mortem brain RNA-seq and proteomic data3,5,40,41,42. Upregulation of inflammation-related genes has been observed in human post-mortem data, but this data suggests that this upregulation begins early in the disease.
To investigate the significance of SERPIN dysregulation we knocked down a selected group of upregulated SERPINs in the Drosophila αSyn model and ran longitudinal behavioral screening (Supplementary Fig. 7). This analysis revealed that knocking down Spn27A, Spn31A, Spn42Da, Spn42De and Spn47C exacerbated the behavioral deficits induced by αSyn neurotoxicity suggesting that the upregulation of these SERPINs is a compensatory response to the disease. Control experiments knocking down the same SERPINs in healthy flies did not change their behavior (Supplementary Fig. 8).
The dysregulated signatures (DEGs and DEPs) observed in αSyn flies are not caused by overexpression of any protein because they are absent in the controls overexpressing GAL4. To further investigate their specificity we compared the αSyn signatures with previously reported tau DEGs and DEPs43. Briefly, we overlapped the longitudinal tau DEGs and DEPs and performed functional enrichment on the overlapping signatures and the signatures specific to αSyn (Supplementary Fig. 9). Our analysis suggests that dysregulation of metabolism-related pathways is specific to the αSyn transcriptome. Furthermore, we found that the proteomic dysregulation of pathways related to protein synthesis and NMD have both αSyn-specific and overlapping signatures with the tau proteome. Interestingly, a deeper look into the direction of change of the overlapping tau and αSyn NMD-related genes reveals that tau and αSyn alter the abundance of some of the same proteins but in different directions.
αSyn alters aging-related changes in translation, energy metabolism, and innate immunity
Several studies have noted that the molecular signatures of disease progression are comparable to what would typically be seen later in the course of normal aging leading to postulate an accelerated aging hypothesis of PD44,45,46,47,48,49. To explore this idea, we ran longitudinal DE analyses of both the transcriptome and proteome and identified genes that were significant relative to both the age and genotype*age interaction term. These genes, termed age-associated DEGs, have normal expression changes with age in the control flies, but their up- or down-regulation is either accelerated or decelerated in the transgenic αSyn fly. For the transcriptome, we used an age-adjusted DESeq2 model to identify 1140 age-associated DEGs; for the proteomic data, we used age-adjusted linear models to identify 1130 DEPs. Although only 629 (55%) of the transcriptomic age-associated DEGs had their respective protein detected in TMT-MS, 120 (19%) of these were also age-associated in the proteome analysis, suggesting these aging trends are reflected in both.
Next, we generated expression heatmaps to compare the age-dependent expression patterns in the control and the disease model flies (Fig. 3A, B, Supplementary Tables 4–9). Since the transcriptome trends are generally linear, we classified these categories as accelerated or decelerated up/down with age. In the proteome, the expression patterns are more complicated, so we categorized additional trends as a loss of age-related downregulation (i.e., downregulated at early stages but upregulated compared to late) or as an age-independent upregulation (Supplementary Fig. 10 shows representative expression plots for each of these trends.) It is important to note that these expression patterns are general trends with age and do not represent all possible patterns.
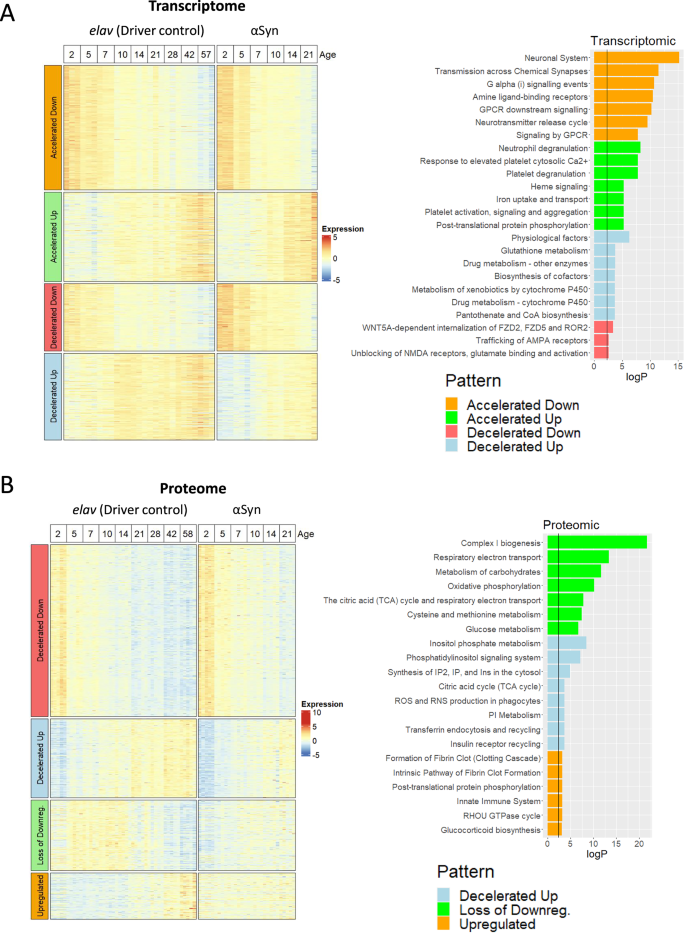
A Expression heatmap of the 1140 age-adjusted DEGs in the transcriptome and the Reactome and KEGG functional enrichments for each pattern. B Heatmap of the 1130 age-adjusted DEPs in the proteome and their functional enrichments. Columns are annotated by genotype and age. The rows are split into four categories based on the expression trend with age and the direction of the genotype*age interaction term. The vertical black line in the functional enrichments is a 0.1 significance cutoff. The proteome “decelerated down” pattern had no significant enrichments.
Next, we sought to identify the biological pathways affected by this accelerated aging. Functional annotation of the transcriptomic ‘accelerated aging’ signatures (Fig. 3A, right panel) identified an early upregulation of innate immunity pathways such as neutrophil degranulation and platelet activation. In other words, innate immunity genes are upregulated over the course of normal aging, and αSyn neurotoxicity accelerates this trend. This supports the hypothesis of accelerated aging in PD and specifically points to age-dependent chronic inflammation (inflammaging) as a key player. Pathways whose downregulation was accelerated (see Day 21 at the top of the heatmap in Fig. 3A) were generally related to synaptic/neuronal biology, likely because of neuronal impairments or death.
The proteomic data show upregulation of similar innate immunity pathways (innate immune system, fibrin clot formation, glucocorticoid biosynthesis) (Fig. 3B). Innate immunity proteins are expressed at low levels in the young fly and high levels in the aged healthy fly but are consistently upregulated from early time points in the disease course. These findings confirm our previous results (Fig. 2B) indicating that these pathways are dysregulated from early in the disease course and become exacerbated with age. Only two other patterns in the proteome had significant functional enrichments: decelerated upregulation and loss of downregulation. In both cases, energy metabolism pathways (Complex I Biogenesis, Oxidative phosphorylation, TCA cycle, glucose metabolism) were downregulated, depending on the age. Other interesting enrichments include downregulation of phosphatidylinositide signaling (dme04070) and ROS/RNS production in phagocytes (R-DME-1222556). In summary, αSyn neurotoxicity accelerates a number of aging-related expression changes.
Single-cell RNA-seq data reveal divergent neuronal and glial responses to αSyn neurotoxicity
An obvious limitation of bulk RNA sequencing and mass-spectrometry is that they obscure differences between cell types. Therefore, we generated a single-cell RNA-seq dataset at a single time point, 10 days post-eclosion, with the same elav (driver control) and αSyn model used in the longitudinal experiments. These data captured ~65,000 cells and assigned cell identities for 67 of the 239 cell clusters (Supplementary Fig. 11).
To test whether pan-neuronal expression of human αSyn changes the cell-type composition of the diseased brain, we used standard DESeq2 differential abundance protocol on each of the cell clusters. After FDR correction, none of the 67 cell clusters proved to be differentially abundant. This could indicate that day 10 is still sufficiently early in the disease course that there is not enough cell loss to produce a statistically significant difference by this method. For example, dopaminergic neurons were among the most underrepresented in the αSyn model relative to the control at day 10, though this difference did not reach statistical significance (Supplementary Fig. 12). Loss of TH-positive, dopaminergic neurons, in the elav > αSyn fly model has been documented at later stages (post day 20)29,50. Overall, these data lend confidence to the results of the longitudinal bulk data by showing that early time points are not confounded by changes in cell type composition.
To learn which cell types contributed most to the bulk gene expression changes, we took the genes that had been differentially expressed in the bulk data and examined their expression in the scRNA-seq data. The two datasets accorded well with each other but with an interesting twist: transcriptomic upregulation at all time points was explained primarily by upregulation across neurons, including dopaminergic neurons, while both transcriptomic and proteomic downregulation were primarily glial (Supplementary Fig. 13). To further investigate these results, we ran expression-weighted cell-type enrichment on the bulk DEGs which revealed that the expression of the downregulated proteins is over-represented in healthy glial cells relative to neurons (Supplementary Fig. 14). Thus, the transcriptomic downregulation of pathways in Fig. 2B primarily reflects the comparative loss of expression in glia. We asked whether dysregulated transcripts and upregulated proteins also have high expression in glia depending on the age analyzed, but we found no consistent pattern (Supplementary Figs. 14, 15). This response of glial cells to αSyn toxicity is cell nonautonomous and likely caused either by glia reacting to the neuronal-specific expression of αSyn, or the propagation of oligomeric or fibrillar forms of αSyn from neurons to glial cells51.
Finally, we sought to determine the pathways that are altered within each cell cluster using single-cell DE analyses such as DESeq2, as implemented in Seurat. Overall, functional enrichment analysis of the single-cell DEGs identified pathways similar to those seen in the bulk differential expression (Figs. 2B and 4, Supplementary Table 10). For example, the most significant enrichment among several clusters was in pathways related to translation and nonsense-mediated decay. Interestingly, although the enrichment was significant in both neurons and glia, the direction of effect on translation was opposite in the two cell types: upregulated in neuronal cell clusters such as a/b-KC (Kenyon cells) and Lawf2 (cholinergic) cells, while downregulated in glial cells (specifically astrocyte-like, cortex, and ensheathing glia) (Fig. 4, Supplementary Table 10). Given that in the Drosophila brain neurons outnumber glia52, it was surprising that the bulk downregulation of protein synthesis pathways is explained by glial downregulation, but again, glia overrepresents the expression of these pathways (Supplementary Figs. 13, 14). Clusters such as a/b-KC, T4/T5 neurons, ensheathing glia, and astrocyte-like glia were among the most altered clusters with the highest DEG count (Supplementary Fig. 16). The pathways that are dysregulated in both neurons and glia, and in both post-mortem human scRNA-seq and our disease model flies, are related to energy metabolism, MAPK pathways, and Rho GTPase signaling7,8.
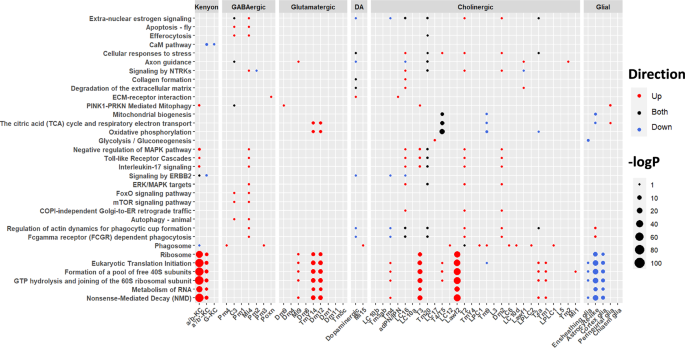
Single-cell differential expression was run using Seurat integrated DESeq2 and functional enrichment was run on the output using Reactome and KEGG ontologies. Both DEGs and functional enrichments were corrected for FDR with a significance cutoff at FDR < 0.05. Circle color reflects the direction of dysregulation and circle sizes are scaled continuously from the –log10(p-value) of the enrichment. Translation and NMD pathways (bottom of the figure) are upregulated in several neuronal cell types but downregulated in most glia.
Drosophila model data help distinguish disease and age-associated changes in PD patient data
As noted earlier, synuclein, tau, and amyloid deposits often coexist in the brains of individuals with PD. To distinguish the pathogenic effects of these three distinct proteins in patient data, we looked for genes that were differentially expressed in both humans and the αSyn flies (Fig. 5A, Supplementary Table 11). First, we took genes that had been identified as differentially expressed by RNA-seq in human PD from three independent cohorts: Dumitriu et al.3 (1095 genes, prefrontal cortex), Nido et al.4 (444 genes, prefrontal cortex), and Benoit et al.40 (370 genes, frontal lobe). Next, we identified the fly homologs of these DEGs by homology mapping, which yielded 675, 228, and 227 genes for the respective cohorts. We then overlapped these homologs with our longitudinally differentially expressed Drosophila genes with respect to genotype (αSyn expression) and age. Only 13–19% of the human DEGs were differentially expressed in the flies with respect to genotype, whereas roughly half (50–59%) were associated with aging. The difference in the overlap between genotype and age suggests that age has a greater influence on these signatures than disease.
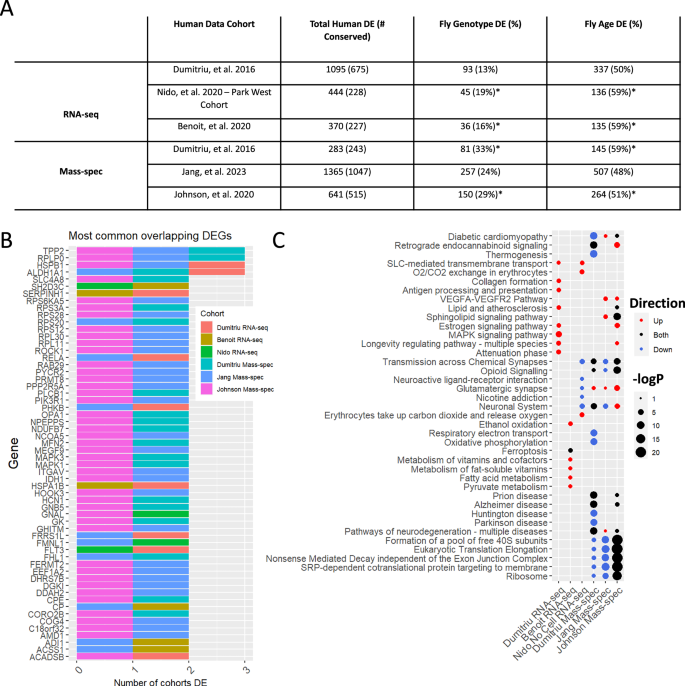
A Table showing the degree of overlap between DEGs and DEPs in PD patient samples and those in a longitudinal αSyn Drosophila model. Homology mapping was done using DIOPT at a score of 3 or greater. Fly columns represent the proportion of human DEGs that overlap with the longitudinal fly model DEGs/DEPs relative to the genotype or age term. An asterisk indicates that the overlap size is statistically significant (p< .05), calculated from a permutation test of 1000 iterations. B Histogram of the most common overlapping human DEGs/DEPs and their respective cohorts. All genes shown overlap with longitudinal fly DEGs. C Functional enrichments of the overlapping human and fly DEGs/DEPs. Circle color reflects the direction of dysregulation relative to log2FC of human DE and circle sizes are scaled continuously from the –log10(p-value) of the enrichment.
We then compared the DEPs identified in mass-spec data from Dumitriu et al.3 (283 proteins, prefrontal cortex), Jang et al.5 (1365 proteins, substantia nigra), and Johnson et al.41 (641 proteins, dorsolateral prefrontal cortex) with our synucleinopathy fly mass-spec data. Homology mapping identified 243, 1047, and 515 Drosophila homologs for each respective cohort. Of these, 24–33% were also differentially expressed in the longitudinal mass-spec fly data with respect to genotype and 48–59% with respect to age. To assess the statistical significance of the overlaps between our fly data and the human datasets, we ran a permutation test (1000 iterations) by permuting gene labels and recalculating the overlap size. Of the six human datasets, four overlapped significantly (permutation test p < 0.05) with our Drosophila data for both genotype and age. Furthermore, KEGG overrepresentation analysis for all overlapping DEPs revealed enrichment of PD-related genes (hsa05012, Parkinson’s disease) for both genotypes (p = 6.4e−4) and age (p = 1.98e−5). We also compared the human DEGs to cross-sectional fly DE data and found overlap among all sampled time points (Supplementary Fig. 17).
Age influences a vast number of physiological processes, and αSyn toxicity anticipates or accelerates many of these age-related changes. To identify specific pathways that were more prominently disrupted by αSyn expression than age, we ran functional enrichment on the human PD genes that overlapped with the αSyn fly DEGs but did not significantly change with age in the control flies. This analysis yielded pathways such as Primary active transmembrane transporter activity (GO:0015399, FDR = 0.00023), Endocrine and other factor-regulated calcium reabsorption (hsa04961, FDR = 1.09e−05), and Dopaminergic synapse (hsa04728, FDR = 0.0012). See Supplementary Table 12 for a complete view of enrichments. Although some genes in these pathways may change with age, our data suggest these pathways are more affected by αSyn toxicity.
Drosophila model data distinguish changes caused by αSyn from those caused by co-pathologies in patient data
The overlapping human and fly DEGs are most likely to represent the genes and pathways whose dysfunction is downstream of αSyn pathogenesis rather than from amyloid, tau, or other co-pathologies. We, therefore, plotted the most common overlapping DEGs (Fig. 5B) and identified the functional enrichments for each cohort (Fig. 5C, Supplementary Table 13). Overall, 4 DEGs in our fly data were identified in 3 out of 6 human cohorts, 54 were identified in 2 human cohorts, and 476 in only one human cohort. Interestingly, ALDH1A1, a gene that was downregulated in 3 human cohorts and flies, has been found to harbor variants that modulate PD risk53 and has been previously studied in PD54,55. Functional enrichment of each of these overlaps yielded commonly dysregulated pathways related to ribosomes, translation machinery, neuronal biology, energy metabolism, and longevity-regulating pathways such as MAPK signaling. Interestingly, translation and nonsense-mediated decay pathways were downregulated in two of the human mass-spec datasets, as they were in our bulk mass-spec data (Fig. 2B), whereas the Johnson et al. dataset showed both down- and up-regulation of these pathways. These results support the usefulness of the Drosophila αSyn model to reproduce the gene expression signatures of human PD. More importantly, they distinguish processes that are downstream αSyn neurotoxicity and aging and are independent of comorbidities.
Discussion
The results of this cross-species transcriptomic and proteomic analysis support the premature aging and “inflammaging” hypotheses for the changes occurring in PD. Inflammation has been proposed to contribute strongly to the aging process and may influence neurodegenerative disease onset56. Indeed, centenarians who have evaded age-related neurodegeneration do not bear classic signs of age-related inflammation57,58,59. It is conceivable that the increased risk of PD with age may be due in part to the compounding effects of αSyn-induced inflammation and age-associated inflammation. It may, therefore, be possible to counter the progression of PD by modifying the feedback loops associated with accelerated aging, inflammation, and PD progression. Our data identified specific innate immune targets that contribute to these mechanisms, such as Spn27A, Spn31A, Spn42Da, Spn42De and Spn47C, which belong to a family of serine protease inhibitors (SERPINs). Human SERPINs such as SERPINA1 and SERPINE1, have established roles in regulating inflammation60,61,62, but their role in neurodegeneration is just beginning to be explored. Our data suggests that the upregulation of at least some SERPINs is a compensatory mechanism since their experimental knockdown exacerbates the αSyn fly behavioral phenotype. Overall, our results implicate SERPIN dysregulation as an age-dependent downstream effect of αSyn neurotoxicity, although further research is required to investigate their therapeutic potential.
Previous studies in neurodegenerative diseases have found that the correlation between RNA-seq and mass spec data ranges from 0.08 to 0.2743,63,64. The coupling of the transcriptome and proteome may decline with age and is exacerbated in PD due to aberrant proteostasis35, but in this study, the correlation between proteomic and transcriptional data ranged from 0.07 to 0.3. Furthermore, we observed DEG/DEP concordance greater than ~80%. We note that a prior, similar study43 using tauopathy flies found a rather lower concordance, due to technical differences in significance cutoffs for DEG identification.
The most significantly downregulated pathways we identified in the bulk transcriptome, bulk proteome, and single-cell data involved translational machinery and nonsense-mediated decay, which are also strongly downregulated in two post-mortem human mass-spec datasets3,5 and both upregulated and downregulated in another41. Interestingly, our results suggest that the transcriptomic downregulation is specific to early time points while proteomic downregulation may extend into later stages. This may explain why protein synthesis pathways were detected only in human post-mortem mass-spec and not in RNA-seq datasets. (We were unable to compare human post-mortem scRNA-seq because the relevant studies had removed ribosomal mRNAs from the analysis7,8.) Although the connection between protein translation and PD has been largely overlooked in research, a recent review37 notes that human studies repeatedly find dysregulation of these pathways5,9,38,39,65,66. Based on this recurrent observation, researchers have hypothesized that downregulated protein synthesis could be an attempt either to conserve energy or to modulate the levels of aggregated αSyn37,39. Our results do not fully support either of these hypotheses, since they reveal that glia downregulated these pathways while some neurons upregulated the translational machinery. This suggests that neurons increase protein synthesis, which is not consistent with either conservation of energy or reducing αSyn aggregation. A third hypothesis39 states that under stress conditions, the cell will reprogram the proteome by increasing the translation of stress-related proteins while decreasing the translation of non-essential proteins. A fourth possibility is that αSyn is upregulated inadvertently while neurons increase protein synthesis of compensatory pathways such as phagocytosis or autophagy to manage toxicity. Meanwhile, glial cells downregulate protein synthesis and glycolysis to conserve energy for the neurons. Support for this fourth model comes from the fact that deficits in energy metabolism pathways, specifically glycolysis67,68 and oxidative phosphorylation69,70, are commonly observed in PD. Our data are consistent with this last model and reveal that proteomic downregulation of glycolysis, insulin signaling, oxidative phosphorylation, and complex I biogenesis are all downstream of αSyn aggregation.
In this context, the neuronal upregulation and glial downregulation of nonsense-mediated decay (NMD) seems particularly noteworthy: although the role of NMD has not been studied in synucleinopathies, there is mounting evidence for its pathogenic role in other neurodegenerative diseases such as Amyotrophic Lateral Sclerosis (ALS), Frontotemporal Dementia, and Alzheimer’s disease71,72,73,74,75. NMD is an RNA surveillance pathway that selectively degrades transcripts with a premature termination codon76. The efficient clearance of error-containing transcripts by NMD is essential for neuronal health as it plays key roles in learning, development, synaptic plasticity, and axonal guidance77. Zuniga et al.72 showed that pan-neuronal expression of wild-type and mutant tau in Drosophila hinders NMD, whereas genetic or pharmacological activation of NMD suppressed tau-induced neurodegeneration. This suggested that NMD impairment is a major mechanism through which tau exerts its neurotoxicity. Similar studies in cellular and Drosophila ALS models showed the expression of a neurotoxic C9orf72 dipeptide repeat impaired NMD pathway activity, but overexpression of core NMD genes (UPF1 & UPF2) mitigated neurotoxicity71,73. Our results are consistent with the hypothesis of neurotoxic αSyn altering NMD and further refine our understanding by suggesting NMD impairment may be cell-type specific. These results suggest the possibility of testing whether experimental reactivation of NMD exerts a therapeutic effect in PD as it does in models of ALS and tauopathy.
In sum, we show that longitudinal ‘omics data from a disease model can complement similar datasets from human postmortem studies, mitigating the limitations of terminal samples. Not only can a combined analysis distinguish disease-related from aging-related changes, but it can disentangle the changes wrought by co-pathologies—in this case, the tendency of PD patients to also accumulate other disease-triggering proteins such as tau or amyloid. We defined the molecular alterations that are downstream of αSyn; provided support for the accelerated aging model of PD; and find that glia mount a non-cell autonomous response to αSyn toxicity that runs counter to that of neurons. Further analysis of these temporal and cell-specific alterations could promote the discovery of early biomarkers and potential therapeutic targets.
Methods
Drosophila models and stocks
Flies were raised at 25 °C on Drosophila molasses-based media. To generate a Parkinson’s disease model fly line, we crossed a female virgin elav-Gal4/+ with a male UAS-αSyn line containing wild-type human αSyn. We generated two sets of controls: we crossed the female virgin elav-Gal4/+ driver control line with a non-targeting shRNA (VDRC: #2691) male fly, and we generated a non-driver control without elav-Gal4 (w1118/+) by crossing the same non-targeting shRNA line with a wild-type fly of the same genetic background (VDRC: #60000).
Samples for bulk RNA-seq (n = 3 biological replicates) and mass-spec (n = 5 biological replicates) were collected at 6 timepoints up to day 21 post-eclosion (days 2, 5, 7, 10, 14, and 21) for the αSyn genotype. To capture age-related changes in the wild-type context, we collected samples from the control genotypes at 9 time points up to day 57 post-eclosion (days 2, 5, 7, 10, 14, 21, 28, 42, and 57). For single-cell RNA-seq (n = 3 biological replicates) we used only flies that were 10 days post-eclosion.
Drosophila longitudinal behavior assays
We assessed neurological function by automatically quantifying climbing speed, turning rate, and stumbling rate in a high-throughput behavioral assay that takes advantage of the flies’ instinctive negative geotaxis78 as described before Onur et al.79. We assessed statistical significance using longitudinal mixed effects (ANOVA) models with smoothing splines to capture non-linear trends over time; we report p-values for additive and interaction effects in the figures.
Immunoblotting
Female Drosophila were raised at 25 °C, then frozen at −80 °C at 5, 10, 15, 20, and 25 days post eclosion. For each replicate, 8 fly heads were collected, lysed, and homogenized in 30 μL of lysis buffer (25% 4× NuPage LDS Sample Buffer, 10% beta-mercaptoethanol, and 65% DI water). Samples were centrifuged for 10 min and then boiled at 100 °C for another 10 min. The sample was loaded into a Bis-Tri NuPage (BioRad) gel and run at 80 V for one hour. Proteins were then transferred to a Nitrocellulose membrane using 20% methanol transfer buffer at 0.3 amps for 1.5 h. After transfer, membranes were washed with TBST and blocked using 5% non-fat blocking milk in 1x TBST. Antibodies were diluted in blocking solutions at concentrations of 1:1000 for αSyn antibody (BD Biosciences #610787), and 1:10,000 for β-Tubulin antibody (Proteintech #66240-1-Ig). Membranes were treated with primary antibodies at 4 °C overnight and treated with 1:10,000 secondary antibodies the following morning. After treatment with a secondary antibody, the membranes were imaged using a LI-COR Odyssey CLx fluorescence imager. Each genotype was run with 3 replicates and αSyn band intensity was normalized to loading control β-Tubulin intensity.
Whole-mount staining and confocal microscopy
Using aged female flies (30 days post-eclosion), brains were dissected in ice-cold 1X PBS and immediately fixed for 35 min using a 4% paraformaldehyde solution (PFA). Brains were washed three times for 5 min each using 1X PBST. Samples were placed in a blocking buffer (1% bovine serum albumen in PBST) for 1 h at room temperature and then incubated with anti-αSyn (1:200, BD Biosciences #610787) for 3 days at 4 °C. After the primary was removed, samples were washed 3 times with 1X PBST for 5 min each, then incubated in secondary (1:500 anti-Mouse-555, and 1:1000 DAPI) for 1 h at room temperature. Samples were removed from the secondary and washed 4 times using 1X PBST, one time in 1X PBS, and then mounted onto slides. Whole-mount stained slides were imaged using a confocal microscope (Leica SP8X) with a ×63 objective and 4× zoom taking z-stack images of the midbrain. Images were visualized using the LasX Office software.
RNA-seq data generation and processing
We used three biological replicates per genotype per time point for RNA-seq. Each replicate consisted of 100 heads collected from flash-frozen, age-matched virgin female flies. mRNA was extracted using TRIzol (#15596026, Invitrogen) followed by DNAse treatment. A minimum of 500 nanograms of total DNase-treated extract RNA were used per replicate. Samples were prepared using the Illumina TruSeq Stranded mRNA Library Prep Kit. Samples were then sequenced on an Illumina NovaSeq 6000 with 350 bp paired-end reads. Raw reads were aligned to Drosophila reference genome dm6 r6.06. Genes with an average read count <50 across all samples were excluded. Preparation of sequencing libraries, RNA-sequencing, and alignment was performed by the New York Genome Center. Initially, these datasets captured read counts for 17,478 genes. RNA-seq read counts were filtered by removing the bottom 5% of expressed genes and further analyzed using DESeq2 adjusted for the preparation batch. After filtering, these datasets provide the counts of 16,604 genes from RNA-seq for further analysis.
Mass-spectrometry data generation and processing
Five biological replicates per genotype per time point were generated. Tandem mass tag mass-spectrometry proteomics was performed following previously published protocols80. Homogenates were prepared from dissected adult female fly brains (50 heads per biological replicate). We removed protein isoforms and samples with >30% missingness and imputed the remaining missing values using the minimum value divided by 2. Peptides mapping to multiple isoforms were collapsed by sum. After initial processing, we captured information for 6456 peptides of 6128 unique genes. Mass-spec protein abundances were processed using the tunable median polish of ratio (TAMPOR) approach81. After filtering, these datasets provided the abundance of 6456 peptides collapsed to 6044 proteins for further analyses.
Mass-spectrometry validation dataset generation
Using the same models and TMT-MS processing methods, we generated an independent sample at day 10 with 8 replicates each, run in a single batch. This validation set was analyzed for differential expression using a two-sided t-test and then compared to the original cohort.
Dimension reduction for bulk RNA-Seq and mass spec data
Dimension reduction for the RNA-seq data was done on the DESeq2 normalized read counts and the built-in PCA capabilities of the DESeq2 R package. For the proteomic data, we used principal component analysis (PCA) as implemented in the stats R package version 4.2.2. t-distributed stochastic neighbor embedding for both models was done using the Rtsne R package version 0.16 with default parameters.
Differential expression analysis for bulk RNA-Seq and TMT-MS data
For the bulk RNA-seq data, we used the standard DESeq282 protocol on the filtered read count data to compare and identify genes whose expression differed between the αSyn and driver control genotypes. P-values were adjusted for FDR using Benjamini–Hochberg (BH) correction, and genes were considered differentially expressed if they had an FDR < 0.05 and log2 fold change (FC) > 0.5.
For the TMT-MS data, we ran a t-test on the TAMPOR-corrected protein abundances and adjusted p-values for FDR using the BH method. Proteins were considered differentially expressed if they had an FDR < 0.05 and a log2FC > 0.25.
For longitudinal differential expression, an age-adjusted DESeq2 model (Expr ~ Genotype + Age + Genotype*Age) was used for RNA-seq, and an age-adjusted linear model was used for mass-spec (Expr ~ Genotype + Age + Genotype*Age). Age was encoded as a numerical variable. Significance was assessed relative to the genotype term, and cutoffs for the age-adjusted models were set to <1*10−4 for transcriptomic differences and <1*10−3 for proteomic differences. Cutoffs for the accelerated aging trends were set for the age term (adjusted p ≤ 0.05) and the interaction term (adjusted p ≤ 0.05).
Functional enrichment
Genes that were dysregulated were used as input for functional enrichment using the ReactomePA R package (Version 1.42) for Reactome and the clusterProfiler package (Version 4.6.2) for KEGG (Kyoto Encyclopedia of Genes and Genomes) Pathway Database. For the background, we used all detected genes from RNA-seq or all detected proteins from mass-spec. P-values were adjusted for FDR using the Benjamini–Hochberg method. Given the hierarchal structure of the Reactome pathways, many significant enrichments are redundant because of overlapping signals. Therefore, we manually removed some redundancies and displayed only the most significant pathways within each hierarchy. Reactome pathway relationships were identified using Reactome website and the rbioapi R package.
Human RNA-seq and mass-spectrometry data
We obtained human RNA-seq data from three published sources, Nido et al.4 performed RNA-sequencing with ribosomal depletion from the prefrontal cortex of two cohorts, Park-west (PW) and the Netherlands Brain Bank (NBB). Because the authors’ analysis of the NBB cohort did not identify any differentially expressed genes, we focused our analyses on the PW cohort (n = 18 idiopathic PD and n = 11 healthy controls). The authors performed differential expression analyses under two models (no cell-type correction and cell-type corrected), and we utilized the non-cell-type corrected in our results. We also removed all lncRNAs from the analysis due to their low conservation between humans and Drosophila. A second source of human RNA-seq, published by Benoit et al.40 was gathered from living tissue from the frontal lobe. Dumitriu et al.3 provided our third source of human RNA-seq data, from the substantia nigra of PD patients.
Mass-spec data from the Alzheimer’s Disease Brain Proteome was recently made available by Johnson et al.41. For our purposes in the current study, we selected samples from patients with mild to severe Lewy body pathology (n = 62) and compared them to healthy controls (n = 69). TAMPOR-normalized protein abundances were corrected for age, sex, and post-mortem interval. We analyzed differential expression using a two-sided t-test with FDR adjustment and DE cutoffs set at FDR < 0.05.
Taking the differentially expressed genes from each resource, we used DIOPT to identify Drosophila homologs for each human gene. In brief, a homolog was assigned to a human gene if it had a DIOPT score >3. A human gene overlaps as differentially expressed with Drosophila if it has a homolog that is differentially expressed in the longitudinal Drosophila analysis relative to genotype or age, respectively. Human RNA-seq data was overlapped Drosophila model RNA-seq data only, and human mass-spec data was overlapped with Drosophila model mass-spec only. The significance of these overlaps was calculated using a permutation test where p-values from human DE were randomly permuted, and then the overlap was recalculated; 1000 iterations were used to calculate a p-value. Benoit et al.40 did not release complete DE results, so instead of permutation we substituted a hypergeometric test with parameters calculated from our data: population size = 13,676, number of successes in population = 1587 for genotype or 5568 for age, sample size = 227, and sample successes are 36 for genotype or 135 for age.
Single-cell RNA-seq
Three biological replicates of females at 10 days post-eclosion were generated per genotype (21 samples total). For each replicate, dissected brains (18 per replicate) were enzymatically dissociated into a single-cell suspension as previously described83. Single-cell RNA-seq libraries were prepared by the Baylor College of Medicine Single Cell Genomics Core using the Chromium Single Cell Gene Expression 3’ v3.1 kit (10x Genomics) and then were sequenced by the Baylor Genomic and RNA Profiling Core. Sequencing was performed using the Illumina NovaSeq 6000 platform with a minimum depth of 300,000,000 reads per sample. Illumina BCL files were demultiplexed using the Cell Ranger 4.0.0 mkfastq function. The resultant FASTQ files were aligned to the Drosophila reference genome (BDGP6.22.98). Gene counts were quantified using the Cell Ranger 4.0.0 count pipeline and filtered count matrices were loaded into Seurat84 in R for additional quality control and downstream analyses. Cells were filtered from the data if the proportion of mitochondrial reads per cell was >20% or the total number of unique genes per cell was fewer than 200 or >3000.
To predict and remove heterotypic doublets we used the DoubletFinder function within the Seurat package. Briefly, for each library, artificial doublets were generated from the existing data, and PCA was performed after merging the real and artificial data. Using the first 40 PCs, we generated a distance matrix to compute the proportion of artificial K-nearest-neighbors (pANN) for each cell. We estimated the PC neighborhood size for each library as previously described85, estimated the number of doublets per library, ranked the cells using pANN, and removed the suspected doublets.
We used SCTransform86 to normalize gene expression independently per library using regularized negative binomial regression. All libraries normalized via SCTransform were integrated using the reciprocal principal component analysis (rPCA) pipeline in Seurat to correct for batch effects and identify similar cell identities across conditions. 3 elav-Gal4 controls were merged to create an integration reference, and anchors across libraries were computed over the first 100 rPCA dimensions in the combined dataset. We used the NormalizeData function in Seurat for the normalization of gene counts for computing cell cluster marker genes, cell identity annotation, and other applications directly comparing gene expression levels between cell clusters. Unique molecular identifiers (UMI) for each gene in each cell were divided by the sum of UMIs in that cell, multiplied by a scalar (10,000), and log-transformed to create the final integrated and normalized dataset.
Single-cell RNA-Seq clustering and cell-type identification
We first used the FindNeighbors function in the Seurat package to construct a nearest-neighbor (SNN) graph of the integrated dataset. Next, we used the FindClusters function to identify clusters of cells using a shared nearest-neighbor modularity optimization-based clustering algorithm. Because cluster count varies with function parameters, we performed a grid search of 64 different combinations of clustering parameters. We varied the number of principal components from 80 to 150 (in step sizes of 10) in creating the SNN graph and varied the clustering resolution from 1 to 8 (step size of 1). This yielded between 179 and 368 clusters, and each cluster’s biological relevance was compared to published bulk transcriptomes from 52 purified Drosophila neuronal types. We determined the similarity of expression profiles by calculating the Pearson correlation coefficient for each purified cell type and the average log-normalized non-integrated gene expression of each cluster. For correlation calculation, we used the most variable genes found during clustering, and for each pair of clustering parameters, we counted the number of purified neuronal cell types that matched 1–5 clusters. Specifically, for the top 6 most highly correlated clusters for each neuronal type, we tested whether the difference in correlation value between a cluster and the subsequent cluster was >0.05, as has been described by a prior publication Ozel et al.87. We annotated the dataset after it was clustered with 120 principal components, which yielded 239 clusters and 67 unique annotated cell types.
To assign these clusters to specific cell types, we utilized three methods of annotation. First, we compared the average log-normalized non-integrated gene expression of each cluster to published bulk transcriptomes of purified neuronal populations. We calculated the Pearson correlation coefficient using the top 10 cluster markers—the genes ranked among the top 10 most differentially expressed genes on the basis logFC for at least one cluster when compared to all other clusters87. Second, we used four published single-cell datasets—Wu et al. (2023), Ozel et al. (2020), Davie et al. (2018), and Li et al.83,87,88,89—as references and performed cell-label transfer using Seurat’s FindTransferAnchors and TransferData functions. In brief, we identified pairs of similar cells between the reference and query datasets using a mutual nearest neighbor approach after projecting the new dataset onto the reference dataset in PCA-reduced space. Each cell was assigned a predicted label based on the score from the comparison to the reference dataset. Lastly, we utilized a trained two-layer neural network classifier of adult optic lobe cell types Ozel et al.87. Non-integrated log-normalized expression values of ~500 marker genes were used as the input to train the classifier. Cluster identity was assigned based on the most abundant population of cells in that cluster. To assign final identities to clusters, we examined the concordance between our various annotating methods; at least two of the methods were required to predict the cluster as concordant to be annotated.
Single-cell RNA-seq differential cell type abundance
In the same fashion that DESeq2 uses to test the differential abundance of a transcript using a read count matrix, we used DESeq2 to determine whether a cell type is differentially abundant between the disease model and control using a cell count matrix. We assessed three biological replicates for each model. P-values were calculated using a Wald test statistic and adjusted for FDR using the Benjamini-Hochberg method.
Single-cell RNA-seq differential expression
We used the FindMarkers function as implemented in the Seurat package with the test set to DESeq2. We required that genes be expressed in >10% of cells and considered genes to be differentially expressed if they had a BH-corrected p-value < 0.05. When comparing bulk data to single-cell data in Supplementary Fig. 13, we ran a t-test comparing the mean normalized transcript abundances for each group of bulk cross-sectional DEGs between genotypes within each cluster.
Expression-weighted cell-type enrichment (EWCE)
We used the R implementation of EWCE as described in Skene et al.90. The input and output species were set to Drosophila. We used a bootstrap test for significance calculation set to 1000 iterations and utilized our scRNA-seq read counts and collapsed cell type for the analysis.

Responses