Longitudinal phage–bacteria dynamics in the early life gut microbiome

Main
From birth, the guts of all healthy humans play host to commensal bacteria1,2. These bacteria extensively metabolize our dietary inputs3,4, drive normal development of the immune system5 and, to our detriment, include some microorganisms that act as deadly opportunistic pathogens6.
Commensal bacteria are also hosts to (bacterio)phages, which are viruses that infect bacterial cells. There are two main phage types: ‘virulent phages’, which quickly replicate and lyse their hosts and ‘temperate phages’, which integrate into the host cells as prophage (typically for many generations) before lysing the bacteria following some cue or stressor7. Because phages exert pressure on host cell populations and some phage genomes encode virulence factors and toxins8, a role for specific phages or communities of phages in human health seems plausible.
Previous studies have begun to explore how communities of bacteria or phages develop in infants and young children. The womb and fetus are likely to be sterile9. Bacterial studies have shown that nearly all infants are initially contacted and/or colonized by bacteria perinatally or during delivery2,9,10. In the first days of life, bifidobacteria and other bacteria capable of efficiently metabolizing breast milk and formula dominate11,12. The bacterial community structure is then determined by the human developmental stage, with a handful of taxonomic compositions frequently observed at different ages13. Studies of phages in infants are more limited but have shown that the first recoverable phages are typically prophages induced from early colonizing bacteria14. Next, the diversity and abundance of phages increase and more virulent phages can be observed15. Phage populations in infants and adults have been shown to be more individual-specific than bacteria, making further trends and patterns difficult to uncover16,17. Therefore, answering how phage population dynamics are related to bacterial population dynamics as well as whether bacterial and phage developmental phases are similarly deterministic are among the questions that have eluded the field thus far.
To answer these questions, we built an extensive catalogue of metagenome-assembled genomes of phages from several recent gut phage metastudies18,19,20,21 from which we extracted unique marker genes with essential phage functions and added them to the MetaPhlAn 4 bacterial marker gene database22. We used this combined phage–bacteria marker gene database for the simultaneous profiling of phage and bacteria in 12,262 longitudinal stool samples from 887 participants of The Environmental Determinants of Diabetes in the Young (TEDDY) study23,24. The TEDDY cohort was built with children at risk for developing islet autoimmunity and/or type 1 diabetes with nested case–control design from four countries. (The Supplementary Note lists the members of the TEDDY Study Group.)
Longitudinal analysis demonstrated that phage communities changed more quickly than bacterial communities, with most phages persisting in a participant for a shorter duration. Subsequently, each participant hosted a more diverse repertoire of phages than bacteria during early development. Despite this, patterns of ecological succession were observed in the data, with different phages peaking in abundance at different host ages, largely mirroring the abundance of putative host bacteria. The addition of phage taxonomic profiles improved the ability to discriminate samples geographically over bacteria taxonomic profiles alone. Furthermore, temporal dynamics of phage and bacterial communities were found to differ during the second year of life for children who were diagnosed with type 1 diabetes. Consequently, co-abundant clusters of microorganisms were differentially abundant from the end of the second year to the fourth year.
Results
Marker-MAGu for trans-kingdom profiling of microbiomes
To enable accurate profiling of phages in whole microbial community shotgun (whole-genome sequencing, WGS) sequence datasets from stool samples, a more comprehensive database of gut phages (and a small number of eukaryotic viruses) was compiled from publicly available resources18,19,20,21. This database, the Trove of Gut Virus Genomes (TGVG; Methods), consists of genomes from 110,296 viral species-level genome bins (SGBs; clustered at 95% average nucleotide identity and 85% alignment fraction, per community standard25) derived from human-gut metagenome studies. Genomes from 42.6% of the viral SGBs are predicted to be 90–100% complete and the database contains numerous phages infecting all major taxa of gut bacteria (Extended Data Fig. 1). Therefore, it is important to note that the majority of the viral SGBs in TGVG are from incomplete genomes.
To facilitate comparable detection of viral and cellular genomes in WGS data, we developed a marker gene approach. This approach utilizes the concept that some genes are more taxonomically informative than others and, therefore, requires genomes to be represented by a subset of genes that are species-specific and invariable. For each viral SGB in TGVG, essential genes (that is, those involved in virion structure, genome packaging and genome replication) were annotated as potential markers. After de-replication, 416,428 unique viral marker genes were detected. The 49,111 virus SGBs with four or more unique marker genes were used for taxonomic profiling. We developed a bioinformatics tool, Marker-MAGu, that leverages marker genes and taxonomic identities from MetaPhlAn 4 and TGVG to generate trans-kingdom taxonomic profiles for gut metagenomes (Fig. 1a,b; https://github.com/cmmr/Marker-MAGu). Given that WGS data represent sequences from double-stranded DNA molecules, this tool and database focuses on double-stranded DNA viruses.

a, Schematic of the Marker-MAGu database structure. b, Marker-MAGu profiling ruleset. c, Average Bray–Curtis dissimilarity between adjacent samples for all participants with at least ten samples for virome and bacteriome (n = 566). ****P < 1 × 10⁻⁴, Wilcoxon test. d–f, Example prevalence plots of phages (bottom) and their putative host bacteria (top) in the genera Enterocloster (d), Bacteroides (e) and Faecalibacterium (f) in individual study participants during development as measured by Marker-MAGu. The dot size represents the relative abundance of the taxa. d, Bacteria, n = 4; viruses, n = 19. e, Bacteria, n = 6; viruses, n = 17. f, Bacteria, n = 1, viruses, n = 12. c–f, The boxplot centre line is the median, the box boundaries (hinges) correspond to the first and third quartiles, and the whiskers extend to the largest/smallest value no further than 1.5× the interquartile range (IQR) from the hinge.
Simulated read data from bacteria and phages showed that Marker-MAGu has high specificity at all coverage levels for bacteria and viruses along with high sensitivity starting at 0.5× the average read depth (Extended Data Fig. 2a–c). Archaea and micro-eukaryotes in the MetaPhlAn 4 database were detectable but we only focused on bacteria and viruses in this Article. Using real TEDDY WGS data, Marker-MAGu returned a consistent ratio of viral SGBs to bacterial SGBs (Extended Data Fig. 2d). This ratio was only slightly affected by the number of reads in a sample (Extended Data Fig. 2e; coefficient of multiple correlation (R) = 0.089). As expected, Marker-MAGu closely recapitulated MetaPhlAn 4 abundance measurements from sequencing of a bacterial mock community, with slightly lower sensitivity and slightly better specificity (Extended Data Fig. 2f,g).
One hundred metagenomic datasets from the TEDDY study were selected at random for in-depth analysis of virus SGB detection comparing Marker-MAGu to the field standard of alignment of reads to whole virus genomes. Exemplar genomes from all Marker-MAGu viral SGBs were used as the genome database and the breadth and depth of genome coverage per sample were obtained. On the one hand, read alignment to whole genomes without strict breadth of coverage thresholding can lead to false positives. On the other hand, high breadth of coverage is a reliable indication of the presence of a genome; however, in a typical metagenomic library, only viruses that are present at very high abundance will achieve this (for example ≥75% coverage breadth26), leading to false negatives. Extended Data Fig. 3a shows an example of error avoidance enabled by Marker-MAGu. In the top row (sample 4,098,288), reads aligned across the whole genome and Marker-MAGu detected this genome/viral SGB. In the bottom row (sample 6,146,150), reads only aligned to the flanks, which probably encode integrases or bacterial genes that were not removed by pruning. Marker-MAGu correctly failed to detect this genome.
We then considered all the viral SGBs/exemplars with any reads aligning in terms of whether Marker-MAGu did or did not detect these. We expected many false positive genomes/viral SGBs to show low breadth of coverage but high depth of coverage, with true positive alignments showing an even spread of reads across the genome. These patterns were observed in Extended Data Fig. 3b with Marker-MAGu ‘Not-detected’ versus ‘Detected’, respectively. This suggests that Marker-MAGu focuses on true positive signals. Encouragingly, >95% of genomes with ≥70% breadth of coverage were detected (Extended Data Fig. 3c). Finally, we also noted that most detected genomes/viral SGBs have low overall breadth of coverage (median = 28%), which shows the sensitivity of this tool (Extended Data Fig. 3d).
Viruses have a higher turnover rate than the bacteria in the gut
To calculate viral and bacterial SGB prevalence and abundance in 12,262 WGS samples from 887 participants of the TEDDY study, sequencing reads (average of 12.0 million reads per sample) were analysed using the Marker-MAGu marker gene approach. With WGS data, we expected to detect virus genomes inside virions as well as dormant and actively replicating virus genomes inside host cells. Trans-kingdom taxonomic profiles for each participant showed a dynamic interplay between phages and their host bacteria, often revealing successive waves of viral SGBs or viral SGB communities affecting single host bacterial SGBs (Fig. 1d–f). Community change was indeed higher from sample to sample for viral SGBs than bacterial SGBs (Fig. 1c).
Across the entire dataset, 1,709 different bacterial SGBs and 15,693 viral SGBs were detected at least once. Bacterial SGBs (Fig. 2a) had higher saturation based on a rarefaction curve, with similar observations at the genus level. Virus clusters (VCs) are computationally imputed genus-level genome clusters. Although most bacterial and viral SGBs were detected in only one or a few human participants, the skew towards rareness was greater for viral SGBs (Fig. 2b), underpinning the individual-specific nature of the virome. Relatedly, when all longitudinal samples were combined by participant, the Bray–Curtis dissimilarity of the virome was greater between participants than the bacteriome (Fig. 2c) and the ɑ diversity of the virome was on average greater than the bacteriome (Fig. 2d).

a, Rarefaction curves of viral and bacterial taxa. Ribbons represent minimum and maximum taxa across 50 simulations. b, Distribution of viral and bacterial SGBs in the study participants. The number of participants with any detectable levels of each SGB was determined. Bins (0–50 participants, 51–100 participants and so on) were plotted as a percentage of total SGBs of each type on the y axis (log scale) and trendlines were compared with emtrends (linear model, Student’s t-test). c, All versus all Bray–Curtis distance for bacteriome and virome communities after averaging the microorganism abundance across all available samples. d, Bacteriome and virome ɑ-diversity measurements in gut communities. Each dot represents the average value from a participant. The boxplot centre line is the median, the left and right hinges correspond to the first and third quartiles, and the whiskers extend to the largest/smallest value no further than 1.5× the IQR from the hinge. Wilcoxon test. e, SGB ‘persistence’ within study participants. The data were filtered to exclude participants with <10 samples. Violins represent the density of values from each observation of an SGB in a participant (number of times SGB detected ÷ number of total samples analysed). The solid black lines mark the 50% quantile and the dotted lines are the 25% and 75% quantile marks. Wilcoxon test. f, Cumulative number of viral and bacterial SGBs per participant. Dots depicting the viral and bacterial SGBs of individual study participants, detected across all samples, are connected by a grey line. g, Heaps’ law ɑ values were plotted for each participant on bacterial and viral SGBs to determine ecosystem openness (coloured lines). The genome is considered open if ɑ < 1 (shown by a solid black line). ****P < 1 × 10⁻⁴.
The longitudinal nature of the data revealed that the virome has a higher participant-specific diversity and turnover rate than the bacteriome. First, it was observed that viral SGBs are detected, on average, in a smaller percentage of a participant’s samples than bacterial SGBs (Fig. 2e). This supports the idea of a higher turnover rate. A plot of the number of unique samples per participant indicated that new viral SGBs seem to accumulate at a nearly linear rate, whereas new bacterial SGB accumulation approaches saturation (Fig. 2f). This was confirmed by the observed lower Heaps’ law ɑ value for viral SGBs per participant (Fig. 2g).
Similar to previous reports on the bacteriome and virome in early childhood, we observed that the ɑ diversity of viruses and bacteria increased during infancy and for at least the first three years (Extended Data Fig. 4a,b)14, and this was comparable for participants in all four countries of origin (Extended Data Fig. 4c,d). Furthermore, t-distributed stochastic neighbour embedding (t-SNE) analysis (often used to represent relationships between high dimensional datapoints) of all samples demonstrated that samples from early infancy partitioned into many clusters, whereas samples taken from older children converged (Extended Data Fig. 4e). Samples did not partition by eventual type 1 diabetes diagnosis in this analysis (Extended Data Fig. 4e). There is some debate about whether Crassvirales (also known as crAss-like phages) increase or decrease in abundance from infancy to early childhood14,19. In TEDDY, 504 putative Crassvirales viral SGBs were detected in the TGVG (Methods) and a clear increase of abundance and prevalence of Crassvirales over time, with a plateau perhaps being reached 1,000 days after birth, was observed in the TEDDY cohort (Extended Data Fig. 4f). Similarly, the ‘original’ crAss-like phage, now known as Carjivirus communis, was frequently detected (Extended Data Fig. 4g) and long-lived in some patients, being detectable in over 20 longitudinal samples (Extended Data Fig. 4h).
Ecological succession of common gut viral and bacterial SGBs
To understand temporal trends in the TEDDY cohort, we parsed Marker-MAGu reports for all 12,262 sequencing libraries to limit further analyses to SGBs detected in ≥100 samples. This collection consists of 446 bacterial SGBs and 1,291 viral SGBs. By calculating the relative abundance of these common SGBs from 0 to 1,400 days of life across all samples, eight ‘temporal subsets’ of co-abundant microorganisms were separated through latent-class trend analysis27 (Fig. 3) using reasonable, if somewhat subjective, criteria. Specifically, eight clusters yielded locally optimal scores on these data with multiple clustering metrics when 2–12 possible clusters were compared (Extended Data Fig. 5). Interestingly, the temporal subsets describe SGBs that peak at different host ages (Fig. 3a,b). Subsets 1 and 2 included SGBs that were present immediately after birth and declined thereafter. Subsets 3–6 included SGBs that peaked at 100–200, 300–400, 400–600 and 800–1,100 days, respectively, after birth and Subsets 7 and 8 included SGBs that continually increased over the days of life covered in this cohort. As expected based on earlier studies12,13, common bacteria in the earliest subsets included Bifidobacterium breve and Bifidobacterium longum, whereas later subsets included Bacteroidales such as Phocaeicola vulgatus, Bacteroides uniformis and Alistipes onderdonkii along with Faecalibacterium species (Supplementary Table 1).

a, Temporal subsets of prevalent viral SGBs drawn in separate boxes (left) and the temporal cluster membership (right). b, Same as a but with bacterial SGBs. a,b, The grey lines are individual viral SGBs and the coloured lines are average lines. c, Day of life abundance data were used for t-SNE analysis of all prevalent SGBs. d, Correlation between prevalent viral and bacterial SGBs. Given that the host prediction of phages is most accurate at the genus level, the temporal data from a and b were compared for each viral SGB and all bacterial SGBs from the putative host genus, and the best correlation was plotted. The boxplot centre line is the median, the lower and upper hinges correspond to the first and third quartiles, and the whiskers extend to the largest/smallest value no further than 1.5× the IQR from the hinge.
The viral and bacterial temporal abundance data were compared, and it was found that the viral SGBs were almost always well-correlated with their putative bacterial hosts (Fig. 3c and Extended Data Fig. 6) and better correlated with predicted hosts than other taxa (Extended Data Fig. 6a). The correlation between each viral SGB and a bacterial SGB in its predicted host genus was typically one of the best (if not the best) correlation in the set (Extended Data Fig. 6b). Although this is expected of obligate parasites, this finding validated the approach used here. The major exception to this correlation was between Lactococcus bacteria and their phages. A definitive explanation cannot be offered but it is notable that Lactococcus bacteria are commonly ingested due to their role in making dairy fermentation products such as cheese.
Virus data increases discrimination of samples from different countries
The TEDDY study cohort consists of children who are vulnerable to the development of type 1 diabetes (Methods) and reside in four western countries (Germany, Finland, Sweden and USA). To understand how type 1 diabetes develops, each of the 114 TEDDY study participants that developed type 1 diabetes was matched—based on geographical location, sex and family history of type 1 diabetes—with one of 114 participants who did not develop type 1 diabetes24. This nested case–control study design was used here to assess microbial communities during the development of type 1 diabetes. Similar to studies of bacterial community composition in the TEDDY cohort as well as metastudies of type 1 diabetes, the abundance of individual viral and/or bacterial SGBs could not reliably discriminate between children who developed type 1 diabetes and those who did not (Fig. 4(right))13,28. However, random forest classifiers demonstrated that both bacteriome and virome data had discriminatory power to separate samples geographically, with the virome data outperforming the bacteriome data (virome was better in 2/4 countries, bacteriome was better in 0/4 countries) and a combination of both types of SGBs outperforming either measure alone (4/4 countries). Quantification of the most important features (SGBs) by country and day of life demonstrated geographical differences for many of these features (Extended Data Fig. 7). For example, the Lachnospiraceae bacterium SGB4754 is most abundant in the USA, Microbacterium SGB53643 is most abundant in Germany and Bacteroides ovatus is most abundant in Finland (Extended Data Fig. 7).
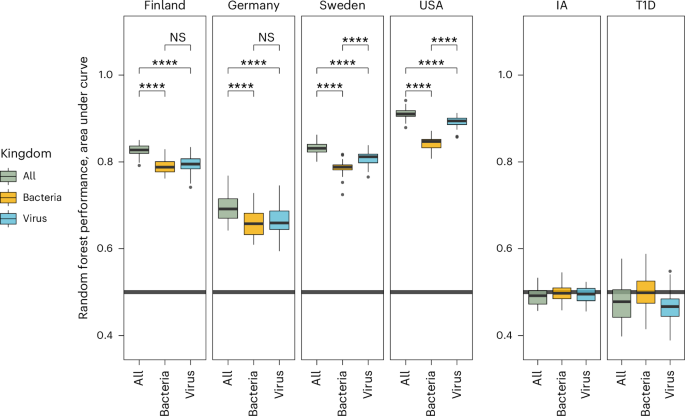
Boxes represent data from 50 permutations of a random forest model on the same data split into train and test groups (70% and 30%) wherein all samples from each participant were always kept in the same group. Each iteration was run with a different random seed. NS, not significant (P ≥ 0.5), ****P < 1 × 10⁻⁴; Wilcoxon test. The boxplot centre line is the median, the lower and upper hinges correspond to the first and third quartiles, and the whiskers extend to the largest/smallest value no further than 1.5× the IQR from the hinge. IA, islet autoimmunity; T1D, type 1 diabetes.
Differences in rate of community change between groups in TEDDY study
Analysis of the viral and bacterial community change over time in each participant was conducted by calculating the Bray–Curtis dissimilarity between each sample and the next, proceeding temporally. Interestingly, the average Bray–Curtis dissimilarity was modestly lower in participants who went on to develop type 1 diabetes than those who did not for both the virome and bacteriome measurements (Fig. 5a,d). Furthermore, when looking at comparisons across age, the trend was statistically significant only between 400 and 700 days of life (approximately the second year of life; Fig. 5b,e), whereas the median age of diagnosis of type 1 diabetes was 2.4 yr (about 880 days)24. Some differences in average Bray–Curtis dissimilarity were also seen between participants from different countries (Fig. 5c,f). Measurements of the relative combined abundance of the taxa from different temporal subsets (see Fig. 3a,b) revealed that samples (particularly 700–1,400 days of life) from participants diagnosed with type 1 diabetes had differential abundances of temporal subsets 2, 5, 6 and 7 at various ages (Extended Data Fig. 8).

a, Virome average Bray–Curtis dissimilarity metrics for type 1 diabetes (T1D) using nested case–control design pairing each participant who developed type 1 diabetes with a control participant. Each participant is represented by a dot (n = 228). Case–control pairs are joined by lines. b, Samples were binned by day of life (rounded) of collection and plotted by Bray–Curtis dissimilarity to the follow-up sample when both participants in the pair had ≥1 sample from that time period (n = 228). c, Virome average Bray–Curtis dissimilarity metrics by country (not nested case–control; n = 566). d–f, As per a–c, respectively, but for the bacteriome. NS, not significant (P ≥ 0.05), *P < 0.5, **P < 0.01, ***P < 0.001; paired two-sided Wilcoxon test. The boxplot centre line is the median, the lower and upper hinges correspond to the first and third quartiles, and the whiskers extend to the largest/smallest value no further than 1.5× the IQR from the hinge.
Discussion
In this study we dissected the dynamics of the gut phages and bacteria in developing children and found individual specificity but multi-layered pattens of ecological succession. As a previous study of bacterial communities in the TEDDY cohort13 suggested, certain bacterial SGBs thrive at different stages of human development. This was similarly observed for viral SGBs in this study. The more complex layer of ecological succession emerged when we noticed that viral SGBs typically come and go from participants’ guts more quickly than bacterial SGBs. We then observed that many long-lived gut bacteria hosted temporally separated phages and/or phage communities during their tenure. The probable model is that newly introduced bacterial species colonize guts and succeed extant bacteria as the diet and immune development of the participant change (that is, new niches emerge). With this succession, the phage communities also change, reflecting host availability. In addition, the observation that the phages are more transitory points to an ‘arms race’ between phages and bacteria that often results in temporary success of the phage, followed by evolution of resistance in the bacterial host rather than concurrent extinction of the phage and its host (Extended Data Fig. 9). Bacterial resistance probably emerges via point mutation of receptor genes or entry factors, capsule phase variation, clustered regularly interspaced short palindromic repeats (CRISPR) spacer adaptation, horizontal gene transfer of anti-phage defence systems29 or supersession by a new resistant bacterial strain of the same species replacing susceptible strains. Some studies suggest that strain-level replacement of bacterial species occurs frequently in the human gut30; this type of switch is not detected with the abundance/detection tools used here. In a strain-level replacement, prophages would appear/disappear in the analysis while susceptibility to specific phage infections is expected to change as well.
By sampling many times longitudinally during the first years of life, it becomes clear that the gut of each participant is exposed to many more distinct phages than distinct bacteria and this may have implications for human immune systems. Ordered arrays of antigens are highly immunogenic and probably used by B cells in detecting pathogenic viruses and bacteria31,32. Phages also have arrayed capsid shells and tails that human immune systems may be primed to recognize and generate antibodies and memory B cells against. Although the interaction of phage and human immune systems has been previously examined33, the data presented here suggest that phages may occupy a larger share of the total antigenic surveillance space of immune systems than was previously considered. Phage antigens should be considered in future studies interested in how cross-reactivity affects inflammation, allergies and protection against novel pathogens34.
Although this study demonstrates that viral SGBs often quickly enter and exit the gut ecosystems of individuals, these findings do not directly contradict previous work showing that some phages can be detected in the gut of an individual over a long period of time (Fig. 1d–f)35,36. Furthermore, the data and methods used here do not record human-infecting RNA viruses and single-stranded DNA viruses in infants like in recent studies37. Nevertheless, Marker-MAGu enables simultaneous quantification of viruses and bacteria in the human gut, providing a more complete picture of the microorganisms living in and on us, while being compatible with common whole microbial community shotgun sequencing data.
The superiority of combining bacterial and viral SGBs over either data type alone for use in random forest models may improve the prospects for microbiome-based diagnostics. The improvement seen by including viral SGBs may be related to the geographic correlation of some bacterial strain-level phylogenies38. Different bacterial strains are likely to have unique functions/phenotypes but also, to some extent, have distinct prophage content and phage susceptibility. The discriminatory power of viral SGBs could also provide clues to the question “where do our gut phages come from?”, pointing towards acquisition dependent on a mixture of environmental conditions12. We also note that by keeping all of the samples from a given participant together in either the testing or training group for model development probably reduced participant-specific biasing of the models (Methods).
Although several studies, including this one, did not find substantial differences in microbial communities in type 1 diabetes when measuring individual taxa28, leveraging of longitudinal data allowed us to detect a different kind of signal. Specifically, the rate of community change slowed somewhat during the second year of life (400–700 days of life) in participants who were eventually diagnosed with type 1 diabetes (median age of diagnosis = 2.4 yr). Longitudinal measurements also allowed us to categorize eight temporally co-abundant clusters of microorganisms (temporal subsets; Fig. 3). Perhaps related to rates of community change, the abundance of some co-abundant clusters was different in participants with type 1 diabetes from the end of the second year to the fourth year (700–1,400 days of life). Potentially, these differences are a response to physiological changes occurring during the development of type 1 diabetes.
As the attention of microbiome scientists turns towards phages, we believe it will be important to establish the rules of engagement of these viruses and their host bacteria. Phage-aware or trans-kingdom approaches such as Marker-MAGu, MetaPhlAn 4 (versions 4.1 or higher) and Phanta39 will need to be adopted to this end. These tools offer different technical approaches to phage detection in whole microbial community shotgun sequencing data. Future directions for this field should include devising useful benchmarking experiments to determine the pitfalls and utility of different approaches. Further complicating matters, Marker-MAGu and the other tools do not have the capability to distinguish whether detected virus sequences derive from integrated proviruses, episomal replicons or virion-packaged genomes, thereby limiting our phenotypic understanding.
Using metagenomic analyses, we may be able to identify promising phages for use in phage therapy based on how their presence or absence in the guts of individuals affects potentially pathogenic bacteria. We can also study how phages influence the response of their host to perturbations such as antibiotics, change in diet or introgression of new bacteria. By evaluating temporal trends in the guts of developing children, this study helps to lay the groundwork for therapeutics and diagnostics that aim to leverage the microbiome and its constituents.
Methods
Study oversight
This study complies with the TEDDY Study Group ethics and oversight committee. The TEDDY study has obtained approval from Colorado’s Colorado Multiple Institutional Review Board, Georgia’s Medical College of Georgia Human Assurance Committee (2004–2010), Georgia Health Sciences University Human Assurance Committee (2011–2012), Georgia Regents University Institutional Review Board (2013–2015), Augusta University Institutional Review Board (2015–present), Florida’s University of Florida Health Center Institutional Review Board, Washington state’s Washington State Institutional Review Board (2004–2012) and Western Institutional Review Board (2013–present), Finland’s Ethics Committee of the Hospital District of Southwest Finland, Germany’s Bayerischen Landesärztekammer (Bavarian Medical Association) Ethics Committee, Sweden’s Regional Ethics Board in Lund, Section 2 (2004–2012) and Lund University Committee for Continuing Ethical Review (2013–present). All parents and guardians provided written informed consent before participation in genetic screening and enrolment. The study was performed in compliance with all relevant ethical regulations13.
Cohort and study design
In this study, whole microbial community shotgun sequencing data from the TEDDY study—composed of >12,262 longitudinal samples from 887 children, aged 0–4 yr, from four countries—was reanalysed to assess phage and bacterial dynamics simultaneously. Detailed descriptions of the TEDDY study, its cohort and the sequencing of stool samples can be found in previous publications13,23,24. Briefly, the TEDDY study is composed of six clinical research centers: three in the United States (Colorado, Georgia/Florida and Washington) and three in Europe (Finland, Germany and Sweden). The population (both cases and controls) is based on children at high risk for type 1 diabetes based on their HLA genotype with 10% based on family history in addition to HLA. Collection of stool samples and associated metadata, collected using validated questionnaires, began on 31 May 2012. Matching factors for case and control children were: geographical location, sex and family history of type 1 diabetes. Enroled children were followed prospectively from three months to 15 yr with stool samples collected monthly from 3 to 48 months of life and then every three months until the age of 10 yr. A nested case–control structure was constructed for the 114 children who were diagnosed with type 1 diabetes during the study paired with 114 controls based on demographic similarity. The same nested case–control structure was built for the 418 children who developed islet autoimmunity with 418 controls.
Bacterial DNA was extracted using a PowerMag Microbiome DNA isolation kit following the manufacturer’s instructions. For whole-genome shotgun sequencing, individual libraries were constructed from each sample, pooled and loaded onto the HiSeq 2000 platform (Illumina), and sequenced using the 2 × 100 base pair paired-end read protocol13,23,24.
Compilation and processing of the TGVG
Sequences from the Gut Virome Database, the Cenote Human Virome Database, the Metagenomic Gut Virus catalogue and the Gut Phage Database18,19,20,21 were downloaded and de-replicated at 95% average nucleotide identity across 85% alignment fraction using anicalc.py and aniclust.py from the CheckV (version 0.9.0) package40, in line with metagenomic virus sequence community standards25. Exemplar sequences from each cluster/singleton from the input sequences were kept and run through Cenote-Taker 2 (version 2.1.5)41 to predict virus hallmark genes within each sequence using the ‘virion’ hallmark gene database. Sequences were kept if they: (1) encoded direct terminal repeats (signature of complete virus genome), one or more virus hallmark genes and were ≥1.5 kilobases in length or (2) encoded ≥2 virus hallmark genes and were >12 kilobases in length. Sequences passing this threshold were run through CheckV to remove flanking host (bacterial) sequences and quantify the virus-to-bacteria gene ratio for each contig. Sequences with ≤3 virus genes and ≥3 bacterial genes after pruning were discarded. Finally, sequences passing this threshold were de-replicated again with CheckV scripts at 95% average nucleotide identity and 85% alignment fraction to yield the TGVG of 110,296 genomes/genome fragments, each representing a viral SGB (Extended Data Fig. 1).
For each sequence in the TGVG, CheckV was used to estimate completeness and ipHOP (version 1.1.0)42 was used to predict bacterial/archael host genus. Bacphlip (version 0.9.3)43 was run on each of the sequences predicted to be ≥90% complete to predict phage virulence.
We used vConTACT2 (version 0.11.3)44 to cluster viral SGBs from the TGVG into virus clusters (using diamond for alignment, ProkaryoticViralRefSeq94-Merged for database, MCL for protein clustering and ClusterOne for VC clustering). In addition to viral SGBs with vConTACT2 ‘Singleton’ labels, viral SGBs with the vConTACT2 labels ‘Unassigned’, ‘Outlier’, ‘Overlap’ and ‘Clustered/Singleton’ were also considered singletons for downstream analysis.
Constructing a trans-kingdom marker gene database
Hallmark genes (that is, genes involved in replication, packaging, assembly and virion structure) were extracted from each virus exemplar genome from the TGVG using hidden Markov models (HMMs) from Cenote-Taker 2 (database version 16 June 2021). Next, hallmark genes were concatenated by genome and these concatenated sequences were de-replicated at 95% average nucleotide identity and 85% alignment fraction. Based on this de-replication, 70,573 virus genomes had unique virus hallmark sets, indicating reduced diversity compared with whole-genome de-replication. These viruses encoded 416,420 putative marker genes. To be comparable with bacterial/archaeal SGBs from MetaPhlAn 4 (ref. 22), which have dozens of marker genes each, detection was limited to the 49,111 viral SGBs with ≥4 marker genes. These genes were added to the MetaPhlAn 4 database (version October 2022), which has marker genes from 27,071 bacteria, archaea and micro-eukaryotes. The resulting database, which was used in these analyses, is Marker-MAGu_markerDB_v1.0.
Marker-MAGu pipeline for marker gene-based taxonomic profiling
To quality control Illumina reads and filter out human sequences, BBDuk from BBTools was used to remove Illumina adaptors and reads that were <50 nucleotides in length and with a Q score of <23. Read pairs were then aligned to the human reference genome hg38 and phiX spike-in sequence. Unaligned read pairs were used in subsequent analyses.
Marker-MAGu is a simple pipeline. First, reads are aligned to the Marker-MAGu_markerDB_v1.0 using minimap2 (ref. 45) with default short read settings (-ax sr) and treated as unpaired reads. Alignments are filtered so that only reads with a single unique alignment are kept (SAMtools)46 and only reads with ≥90% identity to the reference sequence (gene) across ≥50% of the read length are kept (CoverM). The read alignment information for each gene is calculated using CoverM (https://github.com/wwood/CoverM). Next, genes are grouped by taxon and, with ‘standard’ settings, only taxa with ≥75% of genes with two aligned reads are considered detected (R tidyverse packages)47. The relative abundance of each taxon was then calculated. The data in this study were processed with Marker-MAGu version 0.4.0 with ‘–detection standard’ and database version 1.0.
Due to having fewer than four unique marker genes, Marker-MAGu excluded 18,210/65,832 (27.6%) of Caudoviricetes, 1,762/3,074 (57.3%) of Malgrandaviricetes and 226/258 (87.6%) of Faserviricetes viral SGBs from categorization. The marker genes from these excluded SGBs were still used in the database for Marker-MAGu to improve read assignment specificity.
For bacterial SGB benchmarking, samples were processed as above and run through MetaPhlAn version 4.0.6 with default settings.
For viral SGB benchmarking, the ‘field standard’ approach was aligning reads to TGVG genomes/contigs (Marker-MAGu subset) with minimap2 using default short-read parameters (-ax sr), and the breadth and depth of the coverage of alignments were calculated using SAMtools.
Identifying Crassvirales contigs
A BLAST database was constructed from amino acid sequences of large terminase genes from available Crassvirales genomes in RefSeq (17 August 2022). All contigs from TGVG were queried against this database using BLASTX with an evalue cutoff of ≤1 × 10⁻⁵, average amino acid identity of ≥40% and alignment length of ≥500 amino acids. This threshold was used as it returned zero hits against non-Crassvirales virus genomes in GenBank.
Diversity and community metrics
Rstats and the R package vegan were used to calculate the Shannon diversity, SGB richness and Bray–Curtis dissimilarity. Rarefaction curves and Heaps’ law ɑ values were calculated using the R package micropan48. RtSNE (version 0.16; https://github.com/jkrijthe/Rtsne) was used for t-SNE calculations. Estimated marginal means were calculated using the R package emmeans version 1.10.0.
Temporal cluster analysis
SGBs that were detected in ≥100 samples were analysed to calculate the average abundance from day of life 0–100 through day of life 1,300–1,400 in 100-day increments. Temporal clusters were calculated and assigned using the R package latrend version 1.6.1 (https://github.com/philips-software/latrend)27. Cluster quality metrics were run via latrend on 1–12 possible clusters for silhouette-based (Dunn and average silhouette width (ASW)), minimizing/elbow-based (weighted mean absolute error (WMAE), weighted residual sum of squares (WRSS) and Bayesian information criterion (BIC)) and estimation time based on the latrend documentation. Eight clusters were chosen based on local maxima in silhouette-based plots and presence of elbows in most other plots. To inspect whether clusters were tightly packed and/or well-separated, t-SNE plots on all SGBs with subset labels were used.
Random forest modelling
Random forest models were generated using SGBs present in ≥1% samples and by grouping all samples from each participant together either in the test or training group. Training groups were composed of samples from 70% of participants and test groups were composed of samples from 30% of participants. A different random seed was used in each of 50 iterations of the model training/testing using the Python package scikitlearn49 to determine the receiver-operating characteristic area under the curve and feature importance. The twelve features (SGBs) with the highest average importance over 50 iterations were chosen for supplementary plots.
Figure generation
Data were processed and parsed with R tidyverse libraries. Most figures were drawn using ggplot2; the packages ggridges (https://wilkelab.org/ggridges/), wesanderson (https://github.com/karthik/wesanderson) and nationalparkcolors (https://github.com/katiejolly/nationalparkcolors) were also used.
Reporting summary
Further information on research design is available in the Nature Portfolio Reporting Summary linked to this article.
Responses