Low-carbon ammonia production is essential for resilient and sustainable agriculture
Main
Fertilizers are vital for supplying essential nutrients like nitrogen, phosphorus and potassium to support crop growth and feed the growing global population1. Among these nutrients, nitrogen (N) is the most widely consumed, with two primary sources, namely animal manure (33%) and ammonia-based synthetic nitrogen fertilizers (N-fertilizers; 67%)2. Nitrogen, essential for producing fundamental molecules like proteins and nucleic acids, is predominantly found as inert dinitrogen (N2) in the atmosphere and is unusable by most organisms3. In nature, the conversion to reactive nitrogen can occur through biological nitrogen fixation, yet this rate is insufficient to sustain human needs4. Through the Haber–Bosch process, developed in the early twentieth century, dinitrogen is industrially converted to ammonia (NH3), a reactive form of nitrogen used in N-fertilizer production. This advancement substantially enhances global crop yields by supplementing natural biological nitrogen fixation, thus playing a crucial role in agriculture and human nutrition3,5. Therefore, N fertilizers are crucial for food security, as they help to grow food that feeds nearly half of the world’s population6.
Global demand for N fertilizers is rising, driven by population growth and the need to boost agricultural productivity7. From 2000 to 2021, as the world population grew by 25%8, N-fertilizer use increased by 30%9. Despite the potential of circular economy strategies, such as nitrogen recovery from anaerobic digestion of agricultural residues10, the demand for N fertilizers is forecast to rise annually, ranging between 2.8% and 3.7%11. This increasing demand poses considerable challenges, as fertilizer overuse leads to global pollution by ammonia, nitrate and nitrous oxide, harming the climate, ecosystems and human health12. In 2020, global ammonia production reached 183 million metric tonnes (Mt NH3; ref. 13), with 70% of this amount used in agriculture11 (Fig. 1). Additionally, interest in ammonia is expanding beyond agriculture due to its potential as a carbon-free hydrogen carrier and renewable fuel14. This could boost demand in sectors like shipping and power generation, projecting up to 600 Mt NH3 yr−1 by 2050 across various applications11,13.
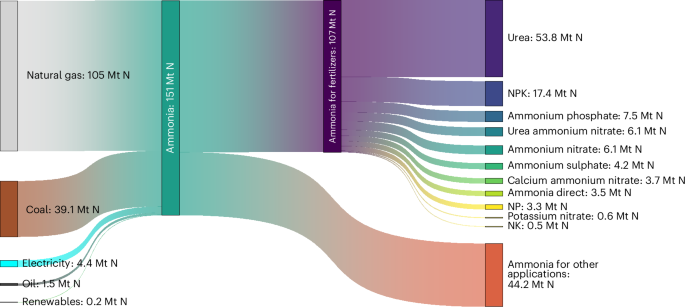
Sankey diagram showing the global mass flow of N fertilizers, tracing the pathway from energy feedstocks to nitrogen usage in agricultural and industrial settings with values expressed in Mt N yr−1. Other industrial applications include mainly textiles, refrigeration, explosives and pharmaceuticals13. After production, 97% of ammonia for agricultural use (~125 Mt yr−1) undergoes further processing to create N fertilizers, which are safer and easier to transport and apply in agriculture44. Urea (CO(NH2)2) is the largest final usage form of N fertilizers, accounting for 50.6% (54 Mt N) of the total synthetic nitrogen content applied in agriculture. Urea is widely used owing to its high nitrogen content (46% by weight) and its ease of transportation, storage and handling79. Data for 2021 N-fertilizer consumption are sourced from ref. 44, and total ammonia usage from ref. 13. NPK: nitrogen, phosphorus, potassium.
Source data
The production and use of N fertilizers contribute substantially to global greenhouse gas (GHG) emissions (Fig. 1). In 2020, ammonia production alone accounted for 450–500 Mt of carbon dioxide equivalent (CO2e; 1.3% of the global total)2,11 and around 2% of the world’s total final energy consumption (8.6 exajoules per year)11. When including use-phase emissions (~660 Mt CO2e), such as nitrous oxide from the application of N fertilizers, and fertilizer transportation (~30 Mt CO2e), the total reaches 1,100–1,300 Mt CO2e yr−1 (ref. 2). A comprehensive cradle-to-grave lifecycle analysis, which includes the production, transportation and application of N fertilizers, along with the utilization of the resulting biomass in livestock feed, human food and biofuel production, expands this figure to 7,400 Mt CO2e yr−1—41% of the food system emissions15. Achieving net-zero GHG emissions by mid-century will require changes in agriculture16, including mitigating emissions in the production of fertilizers through the adoption of low-carbon alternatives, and in the usage phase by adopting N-fertilizer management technologies and alternative cultivation methods16,17. While the use-phase is a major source of agricultural pollution, this analysis focuses on the production of N fertilizers due to its dual implications for emissions and food security.
N fertilizers are a globally traded commodity with intricate and interconnected supply chains and trade routes. In 2021, 46% of the nitrogen used worldwide, amounting to 49 Mt of N (ref. 9), was traded, for a total value of US$39 billion (ref. 18; note that all values in US$ refer to the year of the reference unless otherwise specified). Therefore, the global trade of N fertilizers plays a crucial role in the world food supply chain6,19. Understanding the main exporters, importers and trading routes is essential for assessing the potential risks and vulnerabilities associated with fertilizer trade, and for assessing food security implications globally17,20. The trade of fertilizers faces challenges due to their reliance on fossil fuels and complex market dynamics. Supply shocks, rising costs of fossil feedstocks and geopolitical instability can all undermine food security19,20. High ammonia prices propagate along the fertilizer supply chain, leading to record-high costs of N fertilizers19, pushing farmers to reduced usage, decreasing crop yields and increasing food prices19. This feedback loop particularly affects low-income countries, where fertilizer affordability is critical to food security19. Smallholder farmers in these regions, crucial to local food production, are severely impacted, leading to reduced food availability in areas already vulnerable to food insecurity21.
Transitioning to sustainable and resilient agricultural systems requires a deep understanding of the N-fertilizer industry, particularly the production of ammonia. This involves exploring the trade-offs among alternative production pathways, the intricate supply chain dynamics, and the dual imperatives of ensuring food security and achieving decarbonization. Although several techno-economic emission analyses have explored decarbonization pathways for ammonia production6,16,22,23, there is a lack of holistic research exploring the feasibility of such transition and its implication for agricultural production and food security. This study bridges this gap by providing a comprehensive analysis of the global N-fertilizer industry. We create a dataset of current demand and supply dynamics, identifying producers and highlighting importers, exporters and major trading routes, thereby quantifying the vulnerabilities of the industry and discussing the implications for the global food supply chain. We then discuss how low-carbon ammonia production pathways can revolutionize the N-fertilizer industry. We discuss both large-scale centralized and small-scale decentralized production strategies and examine various low-carbon ammonia production pathways, such as continued use of fossil fuels coupled with carbon capture and storage (CCS), water electrolysis powered by low-carbon electricity, and biochemical processes utilizing biomass, in enhancing agricultural resilience and mitigating emissions. Additionally, we assess trade-offs among costs, GHG emissions, supply chain complexity, fossil fuel dependency and the water–energy–land nexus, presenting these factors in a comprehensive metric. As the world addresses the dual challenges of feeding a growing population and mitigating climate change, this study provides a valuable resource for researchers, policymakers and industry stakeholders dedicated to resolving these complex issues.
Ammonia production is energy- and carbon-intensive
Producing ammonia is highly energy-intensive, with ammonia plants requiring 7.7–10.1 kWh per kilogram of ammonia produced24, equivalent to the daily electricity consumption of the average European household. The substantial energy requirement is primarily due to the hydrogen production process, which accounts for 90–95% of the total energy consumed by an ammonia plant24. Hydrogen is then combined with nitrogen at high pressure and temperature in the Haber–Bosch synthesis process to make ammonia. Globally, about 99% of hydrogen used in ammonia synthesis is derived from fossil fuels, with 70% obtained through steam methane reforming of natural gas, 26% through coal gasification, 3% from electricity and 1% from oil in 2021 (Fig. 1)21. The Haber–Bosch process alone utilizes 3–5% of the world’s total natural gas production25. Renewable-based water electrolysis still accounts for a mere 0.1% of the total, despite a 20-fold growth between 2020 and 202326. Coal-based ammonia production is concentrated in China due to the country’s abundant coal resources and limited natural gas reserves11. In 2019, coal accounted for 85% of domestic ammonia production in China11.
Producing ammonia is not only energy-intensive but also carbon-intensive. The global average direct GHG emissions from ammonia production are 2.6–2.9 t CO2 (t NH3)−1, while even the most efficient steam methane reforming-based plants emit around 1.6–1.8 t CO2 (t NH3)−1 (ref. 11). The process is even more carbon-intensive when ammonia is produced using coal, emitting approximately 3.2–4.5 t CO2 (t NH3)−1 (refs. 13,21,24). Further upstream and midstream emissions occur in the production, processing and transport of the fossil-based feedstock, such as natural gas leaks27. On average globally, these indirect emissions amount to about 0.5 t CO2e (t NH3)−1 produced using natural gas, and 0.3 t CO2e (t NH3)−1 for coal, but can vary widely based on operational practices and emission reduction strategies27.
Geographic distribution of N-fertilizer supply and demand
N-fertilizer usage varies across the globe (Fig. 2a and Supplementary Fig. 1), driven by factors such as crop type, soil properties, climate conditions and agricultural practices28. Regions with intensive agricultural systems, like China, apply higher rates of N fertilizers to maximize yields29. However, beyond varying usage patterns, a critical issue is the accessibility and affordability of fertilizers, especially in regions with limited production capacity11,30.
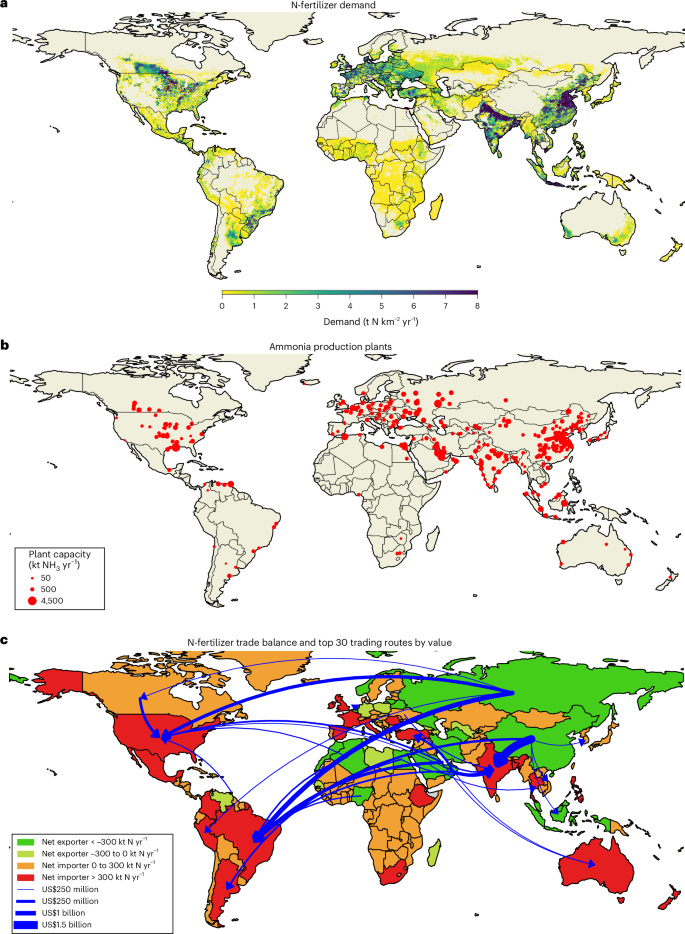
a, Geographic distribution of N-fertilizer demand (t N km−2 yr−1; see Supplementary Fig. 1 for N-fertilizer distribution). b, Global ammonia production plants represented by red dots, with dot size proportional to plant capacity (kt NH3 yr−1; see Supplementary Fig. 3 for distribution of ammonia plant capacity). c, Map depicting countries or districts classified based on their N-fertilizer trade balance (import − export) in 2021. Countries are categorized as strong net exporters (net exports exceeding 300 kt N yr−1), net exporters (net exports between 0 and 300 kt N yr−1), net importers (net imports between 0 and 300 kt N yr−1) and strong net importers (net imports surpassing 300 kt N yr−1). The top 30 trade flows by monetary value (in US$) for 2021 are represented by blue arrows. Data for N-fertilizer demand is sourced from ref. 48. Data on N-fertilizer trade volumes per country in 2021 are from the FAO9. Trade flows by monetary value for 2021 are sourced from World Bank data18, which provide annual trade partner information based on monetary value. Owing to substantial reductions in global trade and N-fertilizer usage (see the trend from 2015 to 2022 in Supplementary Fig. 4), only 2021 data were used for consistency with other datasets. Maps were generated using the open-source Python library Cartopy (https://scitools.org.uk/cartopy/docs/latest/) with geographic boundary data from Natural Earth (https://www.naturalearthdata.com/).
Source data
While some countries produce enough ammonia to meet domestic demand, many others are heavily reliant on imports. Globally, there are 407 ammonia production plants, but only 61 countries host these facilities, leaving the rest dependent on imports and vulnerable to supply chain disruptions, price volatility and geopolitical risks (Fig. 2). Ammonia plants are mainly located in the global north, highlighting a noticeable shortage of production capacity in the global south (Fig. 2b). This imbalance exacerbates the challenges of securing affordable fertilizers in these regions. China is the world’s largest ammonia producer, accounting for 28% (58 Mt NH3 yr−1) of global production capacity, followed by the United States (9%) and India (8%), collectively representing 45% of global capacity (Supplementary Fig. 2). These top ammonia producers also correspond to the largest consumers of N fertilizers. In 2021, China represented 20% (21 Mt N yr−1) of global N-fertilizer demand, followed by India (18%) and the United States (11%; Extended Data Fig. 1).
Brazil, the fourth largest N-fertilizer consumer (6% of the total), stands out due to its insufficient domestic production capacity, making it a major importer (Extended Data Fig. 1 and Supplementary Text 1). In 2021, Brazil imported 6.7 Mt of N fertilizers (14% of global imports), predominantly from Russia (Fig. 2c). Russia, the fourth largest ammonia producer (Supplementary Fig. 2), was the world’s leading exporter of N fertilizers in 2021, supplying 7.2 Mt N (16% of global exports).
Countries can be categorized as net importers or exporters based on their N-fertilizer trade balance (Fig. 2c and Extended Data Fig. 2). North, Central and South America, Western Europe, Australia, sub-Saharan Africa and India are predominantly net importers, while Russia, the Middle East, North Africa and some European countries (notably Belgium, The Netherlands and Belarus) are net exporters. This reliance on imports increases the vulnerability of many regions to supply chain shocks, price volatility and geopolitical risks, particularly in countries without local production capacity.
Global trade and food security implications
To quantify the exposure of a country’s N-fertilizer supply chain to external vulnerabilities, we calculated the ‘N-fertilizer supply chain vulnerability index’ as 1 minus the ratio of a country-specific N-fertilizer production capacity to its agricultural usage (Fig. 3). A higher value indicates greater vulnerability, as it reflects a higher dependency on external sources to meet agricultural demand. If a country produces more N fertilizers than it uses, the index is set to 0, implying no vulnerability (see Methods section ‘N-fertilizer supply chain vulnerability index’). This index offers a measure of how well a country can meet its own agricultural fertilizer needs without relying on external sources. The vulnerability index provides a more comprehensive understanding of country-specific food security than the trade balance alone. For example, the United States is a net importer of N fertilizers (Fig. 2c) but has a low vulnerability index (scoring 0 on a scale from 0 to 1) due to its production capacity exceeding internal demand (Fig. 3a). This allows the United States to focus on satisfying domestic needs when necessary. This capacity largely depends on domestically sourced natural gas, meaning the index remains low (0.05) even when considering natural gas imports (Fig. 3b). Conversely, Germany, despite being a net exporter of N fertilizers and initially having a vulnerability index of 0 due to sufficient production capacity (Fig. 3a), shifts to a vulnerability index of 1 when dependency on imported natural gas is taken into account (Fig. 3b). This is because a substantial portion of its N-fertilizer production is reliant on natural gas imports, making its food supply chain more susceptible to external shocks. An example is the energy crisis after the Russian invasion of Ukraine. In 2022, European ammonia production capacity was reduced by 32% compared with the previous year, with half of the industrial curtailments in the region affecting the ammonia sector21,27.
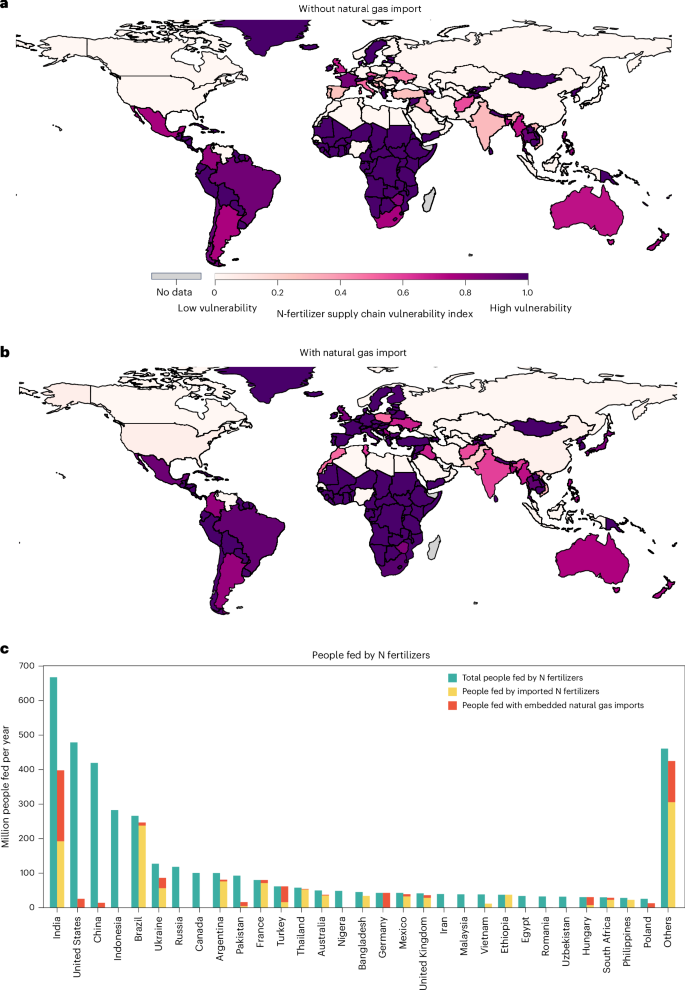
a, Country-specific vulnerability index calculated based on country-specific N-fertilizer production capacity and agricultural usage, without considering natural gas imports. b, Vulnerability index with the inclusion of natural gas imports, subtracting the proportion of fertilizer production that depends on imported natural gas, illustrating an increased vulnerability and highlighting the substantial impact of natural gas on the N-fertilizer supply chain. c, Million people fed per year by N fertilizers. We also estimate the number of people fed by imported N fertilizers, with and without considering the impact of imported natural gas, to illustrate the importance of both fertilizer imports and the underlying energy supply in maintaining food security. Maps were generated using the open-source Python library Cartopy (https://scitools.org.uk/cartopy/docs/latest/) with geographic boundary data from Natural Earth (https://www.naturalearthdata.com/).
Source data
Figure 3c shows the number of people fed per year by N fertilizers. This is calculated by multiplying N-fertilizer use by country-specific nitrogen use efficiency and farm-to-fork nitrogen yield, then dividing by the annual protein intake adjusted for the nitrogen content in food, based on the methodology described by ref. 6 (Methods). Globally, of the 3.9 billion people who rely on N fertilizers for food production, 1.2 billion are dependent on imported fertilizers (Fig. 3c). This number increases to 1.8 billion when considering those who use fertilizers produced locally from imported natural gas (Fig. 3c). This highlights the global dependence on imported N fertilizers, emphasizing the vulnerability of 1.8 billion people to fluctuations in external supplies (Fig. 3c). Most of sub-Saharan Africa and Central and South America have a high vulnerability score.
Trade-offs between low-carbon ammonia pathways
There is a growing push towards alternative ammonia production pathways that can mitigate environmental impacts and enhance the resilience of the ammonia industry. Achieving low-carbon ammonia hinges on decarbonizing hydrogen production, which accounts for more than 90% of the energy demand and emissions in ammonia plants11. Three technologically mature options are available for large-scale centralized ammonia production: (1) fossil-based production with CCS; (2) biochemical processes; and (3) electrolytic processes powered by low-carbon electricity14,16.
Each low-carbon ammonia production pathway presents distinct trade-offs. To better illustrate these differences, we developed a multidimensional trade-off analysis (Fig. 4 and Extended Data Fig. 3), comparing each alternative pathway to the business-as-usual (BAU) unabated natural gas production. Our analysis evaluates key factors, such as production costs, GHG emissions, supply chain complexity, fossil fuel dependency, and water and land use (see Methods section ‘Quantifying trade-offs in ammonia production pathways’ and Supplementary Text 2).
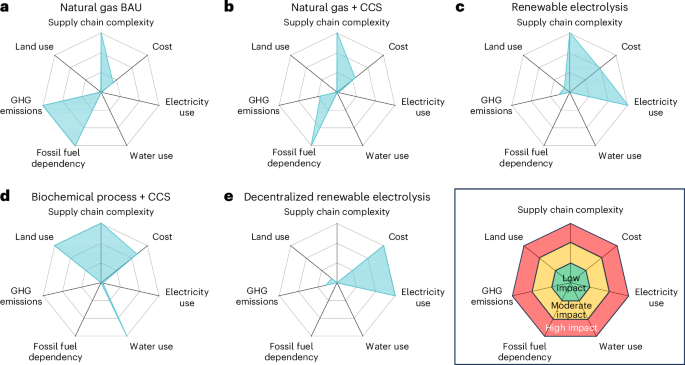
Comparison of various ammonia production methods across seven critical dimensions, namely supply chain complexity, cost (US$ (t NH3)−1), electricity usage (MWh (t NH3)−1), water consumption (m3 (t NH3)−1), fossil fuel dependency, GHG emissions (t CO2e (t NH3)−1) and land use (m2 (t NH3)−1). All impacts are relative comparisons among the production pathways assessed. a, BAU—unabated natural gas production. b, Natural gas with CCS. c, Renewable-based electrolytic production—ammonia production using water electrolysis powered by renewable energy. We have used solar energy as a reference in the figure; see Extended Data Fig. 3 for results for wind energy. d, Biochemical process with CCS—biomass-based ammonia production. e, Small-scale decentralized renewable-based electrolytic production—smaller-scale production using solar energy, situated closer to demand points to minimize transportation. Pathways 1–4, shown in a–d, respectively, represent ‘centralized’ strategies relying on centralized production and extensive distribution networks. Pathway 5, shown in e, represents a ‘decentralized’ strategy, emphasizing supply-side proximity to demand points and smaller-scale operations. The figure illustrates the reference case for each pathway; the detailed quantitative range of values and sensitivity analyses are included in Supplementary Text 2 and are shown in Extended Data Fig. 3. For visualization, we normalized all quantitative metrics by scaling each value relative to the maximum observed across all pathways, setting the maximum value to 1. This approach allows for direct comparison across pathways. Impacts were categorized as low (≤0.33, green), moderate (>0.33 to ≤0.66, yellow) or high (>0.66, orange).
Source data
Upgrading ammonia plants with CCS is cost-effective (201–512 US$ (t NH3)−1, ~50% higher than BAU), especially with low natural gas prices23, and generally uses less water (4.2–13.4 m3 (t NH3)−1), land (4.6–27.6 m2 (t NH3)−1) and energy (0.3 MWhe (t NH3)−1) compared with other low-carbon pathways (Fig. 4). However, it does not fully eliminate GHG emissions due to residual emissions and upstream emissions from natural gas extraction (0.6–0.7 t CO2e (t NH3)−1, ~70% less than BAU). Additionally, this pathway also remains dependent on fossil fuels, subjecting the food supply chain to potential supply shocks and price volatility (Fig. 4)6. The requirement for suitable CO2 storage sites poses a geographical limitation, as not all areas have appropriate suitable geological formations for permanent CO2 storage31. Establishing a carbon transportation and storage network can be complex, costly and may increase lifecycle emissions, depending on the specific transportation methods and regional conditions32.
Biochemical processes for ammonia production can eliminate dependency on fossil fuels and have the potential for negative emissions when coupled with CCS33. Sustainably sourced biomass absorbs biogenic CO2 during growth, and capturing and permanently storing the CO2 released during processing can lead to a net decrease in atmospheric CO2 levels34. However, the infrastructure for biomass handling—encompassing collection, transportation and storage—is costly35. Preprocessing biomass to improve its energy density and handling characteristics further adds to expenses and complexity36. Securing a consistent supply of sustainably sourced biomass at a low price is crucial, as biomass contributes up to 80% of the total costs23. While this pathway can be cost-competitive (215–1,086 US$ (t NH3)−1), it depends heavily on the ability to ensure a reliable and affordable biomass supply. Large-scale ammonia production demands substantial quantities (1.3–2.7 t biomass (t NH3)−1)23,33. Utilizing food crops for bioenergy can compete with food production for humans, exacerbating food insecurity, hence the focus on non-food biomass sources like agricultural and forestry residues37. However, the extensive land area (637–2,894 m2 (t NH3)−1) and water (248–4,727 m3 (t NH3)−1) required for growing sufficient biomass for large-scale production—1 and 3 orders of magnitude greater than that for electrolysis—poses challenges in regions facing water and land scarcity38 (Fig. 4).
Water electrolysis can eliminate dependency on natural gas imports, reducing N-fertilizer supply chain vulnerabilities, and substantially decrease GHG emissions when powered by low-carbon electricity sources (65–81% less than BAU; Fig. 4)22. However, this pathway is highly energy-intensive (8.6–13.1 MWhe (t NH3)−1) and requires gigawatt-scale installations for effective operation22. The feasibility of such setups largely depends on local low-carbon energy availability, which also influences production costs22,39. Typically, the costs of electrolytic ammonia are 2–3 times higher than those of fossil-based production (337–1,218 US$ (t NH3)−1), particularly with off-grid renewable-based systems21,22. Additionally, the land required for solar and wind energy installations can be 20–100 times larger than that needed for CCS (72–3,223 m2 (t NH3)−1), especially in regions with suboptimal solar and wind resources6,22,30 (Fig. 4). These high demands for land and energy pose considerable challenges, especially in regions with resource constraints, and risks of exacerbation of land scarcity30,39.
Small-scale decentralized electrolytic plants are emerging as an alternative solution to large-scale production, aiming to reduce transportation costs and shorten the supply–demand distance. By being located closer to the demand side, these plants can reduce supply chain complexity compared with centralized, large-scale pathways. While the technology used in decentralized plants is like that of large-scale electrolytic plants, decentralized systems often face higher per-unit costs (532–1,894 US$ (t NH3)−1) due to limited economies of scale and the requirement for more expensive control systems40 (Fig. 4 and Methods section ‘Quantifying trade-offs in ammonia production pathways’). A potential solution is to develop modular, small-scale electrolytic ammonia plants that are scalable and adaptable to local conditions and low-carbon energy availability. Modularization facilitates flexible capacity expansion and achieves economies of scale in component manufacturing, narrowing the cost gap with large-scale plants. Further research is required to fully understand the cost reductions associated with this approach. Additionally, small plants offer greater operational flexibility, integrating more effectively with intermittent renewable energy sources and reducing overcapacities and costs41.
Discussion
Currently, N fertilizers, predominantly produced from natural gas in large-scale plants, are carbon-intensive. Approximately 50% of these fertilizers are globally traded, creating a complex and costly logistics network (Fig. 2c). With more than 40% of exports dominated by just four countries, including major producers like Russia, China, Qatar and Saudi Arabia, 1.2 billion people depend on imported fertilizers—a figure that rises to 1.8 billion when considering fertilizers derived from imported natural gas (Fig. 3c). This heavy reliance on trade exposes populations, particularly in the global south, to supply chain shocks and food insecurity. Addressing both decarbonization and food security hinges on targeting ammonia production, a vital precursor to N fertilizers.
Evaluating alternative production pathways is essential, as each method has distinct advantages and challenges. CCS can reduce emissions but remains reliant on natural gas. Electrolytic and biochemical processes can minimize direct emissions but often come with higher costs and resource demands, potentially exacerbating land and water scarcity. Additionally, all centralized production pathways depend on complex supply chains to distribute fertilizers to farmers, particularly for regions far from production facilities or with limited local capacity. These supply chains incur additional costs, including freight, insurance, tariffs, storage, logistics and profit margins, which can substantially increase fertilizer prices41. For instance, in Uganda, the retail price of urea can be double the production cost due to these cumulative expenses (Supplementary Text 3). The high capital investment required for large-scale plants, often in the billions of dollars21, poses considerable financial risks for low-income countries with limited access to capital and high borrowing rates21,40. These challenges, combined with fertilizer price volatility, contribute to the low adoption of fertilizers in certain regions, further exacerbating food insecurity and inequality42.
In response, decentralized small-scale ammonia production plants are emerging as a complementary strategy (Fig. 4e)43. By shifting production closer to demand centres and utilizing local renewable energy sources, decentralized production can reduce transportation costs, emissions and price volatility. Producing ammonia on-demand near farms can enhance fertilizer availability and offer price stability by reducing exposure to fossil fuel price fluctuations43. Although decentralized plants often face higher per-unit production costs due to a lack of economies of scale and the need for more expensive control systems40 (Supplementary Text 2), they require lower upfront capital investments, lowering financial barriers and investment risks.
Decentralized production is particularly promising in regions heavily reliant on imports, distant from production facilities or where high-risk profiles make large-scale projects difficult21. Areas with high transportation and distribution costs, such as parts of sub-Saharan Africa42 where the cost of production can be half the price paid by farmers, or regions like Minnesota in the United States, where long-distance transportation inflates fertilizer costs41, are prime candidates for decentralized production. According to early projections, decentralized production could become competitive in such regions by 203043.
However, challenges remain regarding how fertilizers will be distributed to farmers. A key issue in decentralized ammonia production is handling and applying gaseous ammonia, which requires specialized storage and infrastructure due to its gaseous state at ambient conditions. Currently, only 3% of nitrogen fertilizers are directly applied as ammonia44, while the majority are applied in derivative forms such as urea or ammonium nitrate (Fig. 1). Practical difficulties with on-site ammonia storage may arise, but solutions include converting ammonia into liquid form through pressurization or refrigeration, or processing it into solid fertilizers, which are easier to handle, store and apply44. While these options address handling challenges, they introduce additional complexities and costs at the farm level.
For example, urea production requires carbon dioxide and high-temperature, high-pressure reactors, while ammonium nitrate production involves the catalytic oxidation of ammonia to synthesize nitric acid2. If decentralized plants produce ammonia on-site but transport it to factories for further processing into urea or ammonium nitrate, the additional transportation step—absent in the current centralized model—would increase, rather than reduce, supply chain complexity. To address this, startups are developing small-scale plants that produce ammonia and offer equipment for its direct use. Others are focusing on systems that produce aqua ammonia, a solution of ammonia dissolved in water, which is less volatile, easier to handle, and safer to store and apply than anhydrous ammonia. While these solutions show promise, it remains unclear which technology will prevail as the most efficient and practical.
In addition, new complexities may arise from upstream supply chains for key components such as photovoltaic panels, air separation units and electrolysers. These components, particularly in emerging technologies like proton exchange membrane electrolysers, rely on specialized materials, including rare-earth elements45. This dependence can expose countries to new vulnerabilities, particularly in securing supply chains for these critical materials. Market barriers, such as establishing new supply chains for electrolysers and meeting the increasing demand for rare-earth elements, must also be addressed. Furthermore, large-scale deployment of low-carbon energy technologies introduces challenges related to resource extraction and disposal. Thus, while decentralized production can reduce supply chain complexity by aligning production with demand (Fig. 4), it introduces new logistical challenges that warrant further investigation.
While decarbonizing ammonia production is promising for reducing emissions and enhancing agricultural resilience, its impact on nitrogen usage and environmental nitrogen loss remains uncertain12. Decentralized production could reshape not only the manufacturing but also the formulation, delivery and usage of fertilizers, affecting GHG emissions along the supply chain12. For instance, closer alignment of supply and demand could reduce transportation emissions. However, the overall effect on nitrogen inputs for crop production is unclear. Distributed systems may optimize fertilizer application timing and reduce inefficiencies, but could also increase nitrogen inputs in regions with poor infrastructure, potentially promoting more intensive agriculture12. This shift could benefit areas aiming to enhance food security and reduce emissions from land conversion, but the broader implications require careful consideration.
We primarily focused on comparing production costs, but future research should extend beyond this to consider the entire supply chain (see Methods section ‘Caveats’). This should include calculating transportation distances between exporters and importers, evaluating transportation routes and means of transport, assessing the forms in which fertilizers are imported and transported (for example, ammonia or derivatives), and assessing internal distribution networks using high-resolution geospatial data.
Policy interventions will be critical for the affordable deployment and scaling of low-carbon fertilizers27. Of the 352 low-carbon mitigation projects announced since 2020, only 6 are operational, and 36 are at the final investment decision or construction stage46 (~10 Mt NH3 yr−1 production capacity), partly due to a lack of cohesive policies and regulations. Most low-carbon production pathways currently carry a ‘green premium’, posing challenges for low-income countries. Achieving cost competitiveness will probably require both economies of scale and targeted policy support47. Policies can bridge this gap by providing funding, incentives for low-carbon alternatives, support for pilot projects and fostering public–private partnerships to spur innovation22,23. For example, the US Inflation Reduction Act offers production tax credits for low-carbon hydrogen under sections 45V (for renewable-powered electrolytic hydrogen) and 45Q (for CCS)23. Initiatives such as the Hydrogen Hubs in the United States and the Hydrogen Bank in Europe are also promoting the growth of low-carbon ammonia projects worldwide22.
However, barriers to policy implementation, particularly in low-income regions, could hinder progress. These include limited financial resources, institutional capacity constraints and competing priorities such as short-term food security. For instance, subsidies for imported fossil-based fertilizers are often necessary to address immediate food needs, but redirecting these incentives towards low-carbon local production—while beneficial for long-term food security—may risk short-term disruptions. Additionally, limited access to international climate finance or delays in its disbursement further hinder adoption. Overcoming these challenges will require tailored policies that balance short-term needs with long-term goals, aligning low-carbon fertilizer strategies with broader socio-economic development priorities.
Our study suggests a potential shift in the N-fertilizer industry from large-scale to small-scale ammonia production. However, further research is necessary to optimize global supply chains and assess the feasibility of this transition. Key considerations include minimizing costs, environmental impacts and resource footprints while ensuring supply security. The restructuring will depend on resource availability, fertilizer demand, economic interests, policies and existing technologies. Future research should evaluate low-carbon ammonia technologies, their benefits, and unintended social and environmental consequences, particularly regarding nitrous oxide emissions, water, energy and land use. A holistic approach to sustainable agriculture is needed, integrating technological, economic, environmental and social factors to support a decarbonized, affordable and secure global food system.
Methods
Global mass flow of N fertilizers
We collected data on the worldwide consumption of N fertilizers by product from the International Fertilizer Association44, which reported that 106.3 Mt N were used in agriculture in 2021. This amount is equivalent to 129.2 Mt NH3, given that ammonia is composed of 82% N by mass. We cross-checked these figures with the data from the Food and Agriculture Organization (FAO)9, which reported a slightly higher usage of 108.7 Mt N globally in 2021, indicating a 2% difference. Considering the latest global production data, which showed a total of 183 Mt NH3 produced in 202013, approximately 70% of ammonia was therefore dedicated to agriculture. This percentage is lower than the 80–85% range reported by the International Renewable Energy Agency13, but it aligns with the 70% reported by the IEA11. Finally, to calculate the required feedstock for ammonia production, we multiplied the annual production13 expressed in Mt N by the global percentages of each feedstock used21. This provides an estimate of the amount of synthetic nitrogen produced from different sources. Nitrogen losses during handling, treatment and transport are not included, as the data represent nutrients delivered to end-users44.
N-fertilizer demand in t N km−2 yr−1 is sourced from a spatially explicit (5 arcmin resolution, ~10 km at the Equator) database48 that provides detailed geospatial information on nitrogen usage by crop and fertilizer type for the year 2020. This dataset is considered the most comprehensive and up-to-date for N-fertilizer use30 and represents a total ammonia demand of 120 Mt, approximately 90% of the total ammonia demand recorded by the FAO9 for the same year. The median nitrogen demand is 0.3 t N km−2, while the average is 1.7 t N km−2, indicating the presence of outliers with high demand (Supplementary Fig. 1).
Mapping ammonia plants worldwide
For the location of ammonia plants, we collected data, including the locations and production capacities in kt NH3 yr−1, from UreaKnowHow49, a specialized industry source. We supplemented this with information from Fertilizer Europe50 and a proprietary dataset of North American plants51. To ensure location accuracy, we cross-checked and verified each plant’s coordinates via visual inspection using satellite images from Google Maps, collecting latitude and longitude data. Some plants have multiple production units; we aggregated the data by plant name and location, resulting in a dataset of 407 ammonia plants globally with a total nominal installed capacity of 209 Mt NH3 yr−1 (Fig. 2b). Considering that an ammonia production plant has a capacity factor of 86–90%52,53, we calculated a production of 180–188 Mt NH3 yr−1, aligning with global production estimates.
The average capacity of ammonia plants is 519 kt NH3 yr−1, with 90% of the plants ranging from 91 kt NH3 to 1,200 kt NH3 (Supplementary Fig. 3). Some larger complexes have capacities reaching up to 4,335 kt NH3. Ammonia production facilities have lifespans of up to 50 years, with an average lifetime of 25 years globally11. This varies regionally, with European plants averaging 40 years and Chinese ones 12 years11. Given their longevity, the existing plants are committed to producing up to 15.5 Gt CO2 over their remaining lifetimes, if not decarbonized27.
Our dataset aligns with the IEA11, which reported that China produced 53.5 Mt NH3 in 2019. As 21 Mt N yr−1 (~26 Mt NH3) are used for domestic fertilizer production, and 7 Mt N yr−1 (~8.5 Mt NH3) are dedicated to exports, around 40% of the ammonia produced in China is used for non-agricultural purposed, like plastics, textiles, refrigeration, explosives and pharmaceuticals13,54. This aligns with China’s vast industrial capacities, where ammonia serves as a critical input for several sectors55.
N-fertilizer supply chain vulnerability index
Various indices have been developed to evaluate food supply chain vulnerabilities, integrating climatic events, socio-economic factors and import–export trade dynamics20,56,57. These studies highlight the importance of considering the entire food system, connecting food production to consumption and nutrition, to better understand how to enhance food system resilience20,56,57.
Incorporating trade into assessments of supply chain vulnerabilities has been a common approach, not only in food research but also in other agricultural contexts58. For example, research has examined the depletion of rivers, lakes, aquifers and environmental flows due to unsustainable water consumption driven by global food production. These studies reveal that approximately 15% of unsustainable water use for irrigation is embedded in international food trade, underscoring the interconnected nature of global agricultural systems and their associated vulnerabilities58.
However, there is a noticeable gap in studying the specific vulnerabilities associated with N-fertilizer supply chains. Recent disruptions—such as elevated energy and fertilizer prices—have shown that these factors can have severe, long-lasting effects on food security, often more detrimental than disruptions in food exports19,59 (see historical trend in N-fertilizer production and trade in Supplementary Fig. 4, correlation between the price of natural gas and ammonia in Europe and the United States in Supplementary Fig. 5, and change in the world market of ammonia between 2021 and 2022 in Supplementary Fig. 6). This underscores the urgent need to assess and understand the vulnerabilities within N-fertilizer supply chains, particularly when considering alternative production pathways and geopolitical dependencies.
In response to this gap, we developed the N-fertilizer supply chain vulnerability index (Vi). This is calculated by computing country-specific N-fertilizer production capacity (Pi) to its agricultural usage (Ui), both measured in terms of Mt N yr−1 (based on 2021 data, the most recent available from the FAO9). For countries where production capacity exceeds usage, the vulnerability index is set to 0, as they can fully meet internal demand.
We then adjusted it by considering the reliance on imported natural gas (VN,i), subtracting the proportion of fertilizer production that depends on imported natural gas (ri)60 (equation (2)). This proportion is calculated based on the ratio of imported natural gas to the total natural gas, following the methodology described by ref. 6. We focused on dependence on imported natural gas when defining the N-fertilizer supply chain vulnerability index because coal-based ammonia production is primarily concentrated in China, which has a vast domestic coal supply61. Consequently, coal imports do not substantially impact most countries’ vulnerability to feedstock supply shocks.
The index can also be expressed in terms of people fed by N fertilizers (Fi)6, based on country-specific N-use efficiency ηi (ref. 62), annual protein intake Ii (ref. 9), N content of proteins ρ (18%)63 and farm-to-fork N yield γ (42.5%)64,65 (equation (3) and Fig. 4c). It is important to note that Fi is based on production potential and includes both the local population and those in other countries who benefit from exported surplus.
The estimated number of people fed by imported N fertilizers (FN,i) is calculated using equation (4). The term Ui − Pi represents the deficit in local production, indicating the amount that needs to be imported to meet the agricultural demand.
We then calculated the number of people fed by imported N fertilizers when accounting for embedded natural gas imports (F′N,i).
Quantifying trade-offs in ammonia production pathways
Figure 4 compares the supply chain complexity, fossil fuel dependency, costs, electricity use, water use and GHG emissions, for the following five ammonia production pathways: (1) BAU unabated natural gas production (Fig. 4a); (2) natural gas production coupled with CCS (Fig. 4b); (3) water electrolysis hydrogen production powered by renewable energy (either solar or wind in this analysis; Fig. 4c); (4) biochemical processes using biomass (Fig. 4d); and (5) small-scale decentralized electrolysis powered by solar energy (Fig. 4e; schematic representation in Supplementary Fig. 7 and detailed description in Supplementary Text 4).
Supply chain complexity and fossil fuel dependency were treated as binary variables. We define supply chain complexity in terms of the distribution of N fertilizers from production sites to end-users. Centralized production is associated with high supply chain complexity, whereas decentralized production—where plants could theoretically be co-located with demand sites, as proposed by several companies and startups41,66—exhibits lower complexity. Pathways involving large-scale centralized production (pathways 1–4) were assigned a value of 1 (complex supply chain) due to the requirement of extensive fertilizer distribution networks. In contrast, the decentralized small-scale production pathway (pathway 5) was assigned a value of 0 (no supply chain complexity), as fertilizers are produced locally, eliminating the need for long-distance transportation.
Fossil fuel dependency was assigned a value of 1 for pathways reliant on natural gas feedstocks—namely, the BAU (1) and CCS (2) pathways—and 0 for pathways utilizing renewable energy sources or biomass (3–5). This binary classification highlights the pathways’ reliance on non-renewable resources and associated exposure to fossil fuel market fluctuations.
For each pathway, we calculated the levelized cost of ammonia (LCOA) in US$ (t NH3)−1 considering capital expenditures (CapEx), operating expenditures (OpEx) and fuel costs over the plant’s lifetime (equation (6)). Pathway-specific calculations are detailed in Supplementary Text 2.
where L is the plant’s lifetime in years (30 years); Kj is the set of all technologies and fuels associated with pathway j; CapExl,k is the annualized capital expenditure for technology k in year l; OpExl,k is the operating expenditure for technology k in year l; FuelCostl,k is the annual fuel cost for technology k in year l; DNH3,t is the amount of ammonia produced in hour t; and T is the total number of operating hours per year (~90% or 8,000 h yr−1). Specific equations and parameter values for each pathway, including details on the calculation of CapEx and OpEx, are provided in Supplementary Text 2.
For pathways 1–4, we assumed a production capacity (DNH3,t) of 1,000 t NH3 d−1, representative of traditional large-scale ammonia plants11,67,68. For the decentralized pathway (5), we assumed a smaller capacity of 4 t NH3 d−1, aligning with sizes currently being explored by emerging technologies and startups in the sector69. Owing to limited publicly available data on small-scale ammonia plants, we estimated costs for pathway 5 by scaling the costs of key components—such as renewable energy installations, electrolysers, Haber–Bosch synthesis units and air separation units—from large-scale plants using size–cost correlations from existing literature (Supplementary Text 2). This conservative approach assumes similar per-unit costs and may overestimate costs if modular design and manufacturing efficiencies reduce expenses in small-scale applications70. Future research should explore cost reductions achievable through modularization and economies of scale. For electrolytic pathways (3 and 5), we accounted for variations in solar and wind capacity factors globally to determine the required installed capacities of renewable energy systems (Supplementary Text 2). We included hydrogen and battery storage systems to balance intermittent renewable generation and ensure continuous ammonia production. While detailed hourly optimization models would provide more precise cost estimates, our simplified approach yields results consistent with existing studies and is suitable for comparative analysis (see section ‘Caveats’).
Analysing electricity consumption is critical, as high energy demand can strain local grids and necessitate infrastructure upgrades71. We sourced electricity consumption figures from the IEA11, and for small-scale decentralized electrolysis we compared our assumptions with technical specifications provided by manufacturers69.
We calculated water and land use by multiplying the net energy required to produce one tonne of ammonia by the water and land use per unit of electricity generated from each energy source (see Supplementary Text 2 for details). For natural gas pathways (1 and 2), we considered the water and land use associated with natural gas extraction and processing. For electrolysis pathways (3 and 5), we included the water and land use for solar and wind energy generation. For the biomass pathway (4), we calculated water and land requirements based on the amount of biomass needed to produce one tonne of ammonia. Land use calculations accounted for the full lifecycle of energy production, with the physical footprint of the ammonia plant itself representing a negligible fraction (<0.001%) of the total land use. Water consumption included both process water (for example, for steam methane reforming and electrolysis) and lifecycle blue water used in fuel production.
Our emissions analysis focused on cradle-to-gate lifecycle emissions from ammonia production. This includes not only direct emissions but also upstream and midstream emissions, such as those from the production, processing and transportation of fossil-based feedstock (for example, natural gas leaks in fossil-based production). Additionally, for the electrolytic pathway, we account for emissions from equipment manufacturing, construction, operations, maintenance and plant decommissioning for renewable installations. Further details are provided in Supplementary Text 2.
For visualization purposes in Fig. 4, we normalized all quantitative metrics (LCOA, electricity use, water use, land use and GHG emissions) by scaling each value from 0 to the maximum value observed across pathways, with the maximum set to 1, facilitating direct comparison across pathways. We categorized impacts as low (≤0.33), moderate (>0.33 to ≤0.66) or high (>0.66). All underlying data, including both normalized and absolute results and all input parameters, are described in Supplementary Text 2.
It is important to acknowledge that this analysis is simplified; however, it offers a coherent comparison of decarbonization pathways by applying a consistent methodology across all cases. Furthermore, all cost parameters were standardized to 2024 US$ to ensure comparability of input data. For a more detailed assessment, a plant-specific evaluation would be necessary, considering local resource availability and context-specific cost factors.
Caveats
Ammonia pricing mechanisms are complex due to the absence of a unified global market; prices are determined by regional spot markets using indices such as free on board (FOB)—the price at the point of shipment—and cost and freight (CFR)—which includes freight charges to the destination port. For example, in September 2024, the FOB price in the Middle East for unabated natural gas-based ammonia was around 400 US$ (t NH3)−1, while the CFR price in Europe was approximately 580 US$ (t NH3)−1 (ref. 72). Ammonia produced with CCS and electrolytic ammonia were more expensive, with the latter exceeding 900 US$ (t NH3)−1 delivered to Europe from the US Gulf Coast72.
Ammonia production costs are largely dependent on the energy inputs required for hydrogen production—such as natural gas, coal or renewable energy sources (Supplementary Text 2). This dependence leads to substantial geographical and temporal variations in ammonia production costs, resulting in large fluctuations and market volatility. For instance, over the past decade, global ammonia prices have ranged from as low as 170 US$ (t NH3)−1 in Latin America in 2020 to as high as 1,350 US$ (t NH3)−1 in Europe in late 202273.
Our cost estimates align with those from other studies. According to the IEA, natural gas-based ammonia production typically costs between 250 and 450 US$ (t NH3)−1, increasing to 300–550 US$ (t NH3)−1 when incorporating CCS74,75. Electrolytic production costs vary widely, from 250 to 1,500 US$ (t NH3)−1, depending on electricity prices and location22,75. Similar values have been reported in other studies76,77. For decentralized production, fewer studies are available; however, our estimates are consistent with projections for the 2030 scenario43. Further research is needed, particularly for low-carbon alternatives, which have limited real-world data due to minimal current production levels and the influence of incentives and production tax credits that can drastically affect investment decisions23.
Reporting summary
Further information on research design is available in the Nature Portfolio Reporting Summary linked to this article.
Responses