Lysophosphatidylcholine promoting α-Synuclein aggregation in Parkinson’s disease: disrupting GCase glycosylation and lysosomal α-Synuclein degradation

Introduction
Parkinson’s disease (PD), the second most common neurodegenerative disorder after Alzheimer’s disease, is characterized primarily by motor symptoms such as tremor, bradykinesia, rigidity, and postural instability, as well as non-motor symptoms including cognitive impairment, mood disorders, sleep disturbances, and autonomic dysfunction1,2. The prevalence of PD varies globally but is estimated to affect ~1–2 per 1,000 of the population at any given time. This prevalence increases significantly with age, affecting about 1% of those over 60 and up to 4% of those over 803,4,5. PD is a significant public health issue in China, where it poses a growing challenge due to the country’s large and aging population5,6,7.
Lysophosphatidylcholine (LPC) is a lipid molecule derived from phosphatidylcholine, playing a crucial role in cell membrane integrity and signaling8. Some studies suggest that LPC levels in the serum can increase with age, as well as with certain pathological conditions or a high-fat diet. This increase might be linked to altered lipid metabolism and inflammatory processes commonly seen in aging9,10,11. Diet significantly influences serum LPC levels8,12,13. Various lipids, particularly those involved in membrane structure, bioenergetics, antioxidant protection, and bioactivity—such as lysophosphatidylethanolamine and phosphatidylcholine—have been shown to contribute to neuronal and neuroglial damage. Notably, these lipids have been found to better predict the motor and non-motor symptoms of PD, suggesting that lipid alterations may be associated with the clinical phenotype of PD14,15. Studies indicate that dietary factors, including high intake of saturated fats, trans fats, refined carbohydrates, excessive choline, and alcohol, contribute to elevated LPC levels8,12,13. Our preliminary research on the serum lipid metabolome of PD patients revealed abnormally elevated LPC levels, which are closely linked to the severity and progression of cognitive impairment in PD16. Additionally, increased brain LPC levels have been confirmed in PD rat models. High serum LPC levels can exacerbate inflammatory responses in the brain, contributing to neuroinflammation. Elevated LPC levels can impair the integrity and function of the blood-brain barrier (BBB), leading to increased vulnerability to neurotoxins and contributing to cognitive deficits17,18. LPC can also directly induce neuronal toxicity through mechanisms involving oxidative stress and disruption of cellular homeostasis19. For instance, injection of LPC into the striatum can lead to the loss of neurons in the substantia nigra pars compacta and reduce dopamine neurotransmission20. The purpose of this study is to investigate the pathogenic role of LPC in dopaminergic neuronal damage and explore its underlying mechanisms. By understanding these processes, we aim to uncover potential therapeutic targets for mitigating the impact of elevated LPC levels on neurodegeneration and cognitive impairment.
The aggregation of alpha-synuclein (a-syn) protein is a key pathological hallmark of PD21,22,23. These a-syn aggregates in neurons are primarily composed of damaged mitochondria, phospholipids, sphingolipids, neutral lipids, lipid droplets, cholesterol esters, and a-syn oligomers24,25,26,27. Increasing evidence suggests that the abnormal aggregation of a-syn is closely related to certain fibrils and lipids, and the abnormal accumulation of lipids may exacerbate the entanglement and aggregation of a-syn28,29,30,31. For example, long-chain polyunsaturated fatty acids can promote a-syn oligomerization32,33. Studies have reported that mutations of glucocerebrosidase encoding glucocerebrosidase (GCase) have been demonstrated to be increased the risk of PD34, and the glucosylceramide (GlcCer, a substrate of GCase), a specific sphingolipid composed of sugar moiety and ceramide, can provide a scaffold for a-syn entanglement. GlcCer can directly accelerate the formation of a-syn oligomers by binding to a-syn monomers35,36,37, which may be a critical step in the pathological process of PD.
We speculate that LPC is likely to disrupt the balance of lipid metabolism in dopaminergic (DA) neurons, thus inducing a-syn entanglement and neuronal damage. The precise mechanisms underlying DA neuronal injury in PD remain unclear and warrant further investigation. In this study, we aim to elucidate how LPC exacerbates α-synuclein entanglement by impairing GCase glycosylation. Additionally, we will examine the effects of LPC on the autophagic degradation of α-synuclein and evaluate the effect of solanesol in mitigating LPC-induced neurotoxicity.
Results
LPC aggravates behavioral dysfunction and DA neuron injury in vivo and in vitro
After intraperitoneal injection of 30 mg/kg MPTP treatment daily over a continuous 5 day period into 8 week-old mice, 2 μL of 1 mg/mL LPC was administered into the substantia nigra region of mice at week 10, followed by cognitive and motor behavioral assessments conducted 4 days later (Fig. 1a). Cognitive and motor functions were evaluated using Y-maze and rod-turning experiments. In the control group of mice, the mean exploration time of the new arm was 124.3 s, while in the LPC-injected group, it was 52.00 s, in the MPTP-modeled group, 51.67 s, and in the LPC and MPTP combined intervention group, 39.33 s. Mice subjected to LPC intervention and MPTP modeling exhibited shorter exploration times in new arm (Fig. 1b, c) compared to the control group. Furthermore, mice in the combined LPC and MPTP intervention group displayed the most impaired performances (Fig. 1b, c), suggesting that SN injection LPC-induced cognitive deficits resembled those observed in MPTP-modeled mice with motor deficits. In terms of exercise, compared to the control group, single LPC administration does not reduce the balance maintenance time (Fig. 1d), while single MPTP administration does impair the balance maintenance time on the rod-turning device by mice. When LPC administration is added to MPTP-treated mice, it further reduces the balance maintenance time. This indicates that under normal circumstances, LPC does not impair mice’s motor function, but exacerbates motor function damage in MPTP-induced mice. Immunofluorescence labeling of Tyrosine hydroxylase (TH) in the substantia nigra region using frozen brain sections revealed that 23% of the area was TH-positive in the control group, 17% in the LPC group, 13% in the MPTP group, and 9% in the LPC and MPTP combined intervention group. Compared to the control group, LPC and MPTP mice exhibited reduced TH distribution area and loss of dopaminergic neurons in the substantia nigra region, with LPC enhancing the effects of MPTP (Fig. 1e, f), indicating that LPC-induced cognitive deficits in mice through substantia nigra dopaminergic neuron loss. In addition, TUNEL assays showed that LPC significantly aggravated MPTP-induced-TH+ neuron apoptosis (Supplementary Fig. 1a). MPP+ is a toxic metabolite of the neurotoxin MPTP, used to establish a cell model of PD. Using the mouse dopaminergic neuron cell line MES23.5, apoptosis was assessed via the TUNEL experiment after 10 μg/mL LPC and 20 μM MPP+ for 24 h intervention. Nearly no apoptosis was observed in the control group, while 50% apoptosis occurred in the LPC-intervention group, 65% in the MPP+ group, and 80% in the LPC and MPP+ combined intervention group. Both LPC and MPP+ induced apoptosis compared to the control group, with LPC exacerbating the effects of MPP+ (Fig. 1g, h). Additionally, the proportion of apoptotic cells by flow cytometry detection showed the same trend (Fig. 1i, j).

a Experimental Protocol and Behavioral Assessment in Mice. b, c Time spent in the new arm for Control, LPC, MPTP, and LPC + MPTP Groups in the Y-Maze Test (n = 6, Control vs LPC: p < 0.0001, Control vs MPTP: p < 0.0001, MPTP vs LPC + MPTP: p = 0.0049). d Rod-Turning Performance of Mice (After, n = 6, Control vs LPC: p = 0.4712, Control vs MPTP: p < 0.0001, LPC vs MPTP: p = 0.003, MPTP vs LPC + MPTP: p < 0.0001). e Representative Images of Tyrosine Hydroxylase (TH) Immunofluorescence staining in substantia nigra pars compacta (SNC) dopaminergic neurons in C57BL/6 J mice following 2 μL of 1 mg/mL LPC injection once and 30 mg/kg MPTP treatment daily over a continuous 5 day period. f Distribution analysis of TH-positive cell areas (n = 3, Control vs LPC: p = 0.0004, Control vs MPTP: p < 0.0001, Control vs LPC + MPTP: p < 0.0001). g Representative images of TUNEL staining in MES23.5 dopaminergic neurons after LPC (10 μg/mL) and MPP+ (20 μM) treatments. h Quantification of TUNEL-positive cells (n = 3, Control vs LPC: p < 0.0001, Control vs MPP+: p < 0.0001, Control vs LPC + MPP+: p < 0.0001). i Flow cytometry analysis of apoptosis in MES23.5 dopaminergic neurons following LPC and MPP+ treatments. j Percentage of apoptotic cells (Q3 + Q2) (n = 3, Control vs LPC: p = 0.0300, Control vs MPP+: p = 0.0020, Control vs LPC + MPP+: p < 0.0001).
LPC increases the abundance of the glucosylceramide family in the substantia nigra, thereby exacerbating α-synuclein aggregation
PD is primarily characterized by the abnormal accumulation of α-Synuclein (α-Syn), which manifests in various molecular forms: monomeric α-Syn (~14 kDa), oligomers α-Syn (>14 kDa). Western blot analysis revealed that LPC doses of 5 μg/mL and higher for 24 h led to the ratio of oligomers to monomers of α-Syn increased significantly in vitro (Fig. 2a–d). In addition, the ratio of oligomers to monomers of α-Syn in LPC combined with MPP+ group was significantly higher than that of MPP+ group (Fig. 2e–h). Immunofluorescence co-labeling of TH (red) and α-Syn (green) demonstrated a twofold increase in α-Syn expression in the substantia nigra region following 2 μL of 1 mg/mL LPC intervention for 4 days (Fig. 2i, j). In addition, LPC treatment increased the expression of insoluble α-Syn, soluble α-Syn, and p-α-Syn in SN of MTPTP mice (Supplementary Fig. 1b). Additionally, both 10 μg/mL LPC and 20 μM MPP+ treatments for 24 h resulted in significant α-Syn accumulation compared to the control group in vitro, as shown by in vitro immunofluorescence labeling (Fig. 2k, l). Lipid components appear to play a crucial role in α-Syn aggregation. Principal component analysis (PCA) of lipid sequencing data showed clear differentiation between the control and LPC groups, with an explanatory ratio of 0.246 in the score plots (Fig. 3a). Overfitting was assessed using an orthogonal partial least squares discriminant analysis (OPLS-DA) permutation test with 200 randomized groups, confirming the robustness of the model (Fig. 3b). Differential lipids were identified using VIP prediction values (Fig. 3c) and there was a significant increase in the content of glucosylceramide (GlcCer) GlcCer (d18:1). Western blot analysis indicated that LPC treatment elevated α-Syn levels across all molecular weights. However, the use of the glucosylceramide synthase inhibitor Eliglustat effectively reduced LPC-induced α-Syn accumulation (Fig. 3e–h), it is worth noting that Eliglustat inhibits the formation of all more complex glycosphingolipids, not just GlcCer. These findings suggest that lipid components, specifically GlcCer, play a pivotal role in α-Syn aggregation.
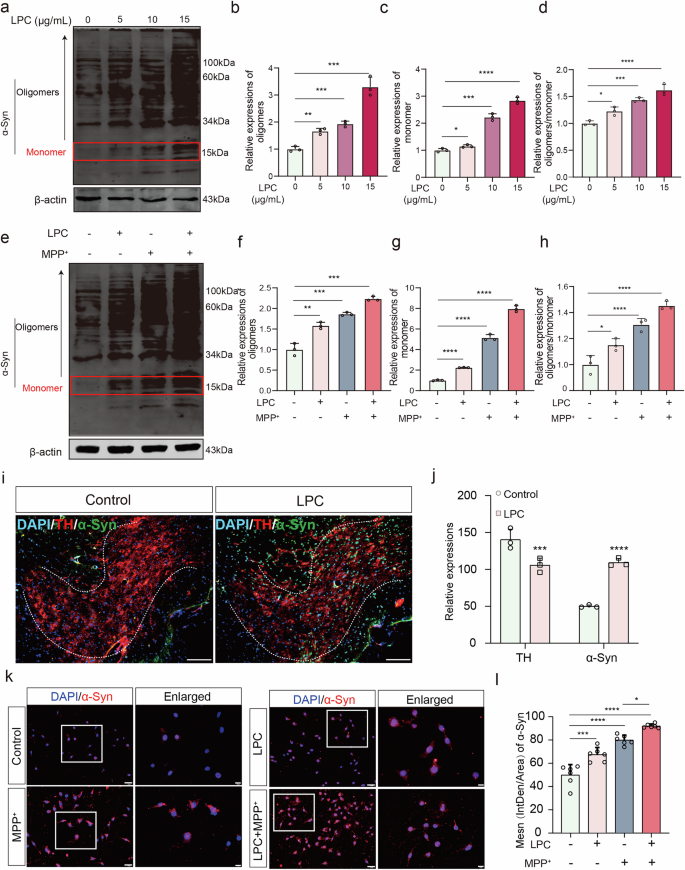
a–d Western blot experiments were conducted to assess α-Synuclein expression levels in MES23.5 dopaminergic neurons following LPC intervention at varying doses (5 μg/mL, 10 μg/mL, 15 μg/mL) of LPC (n = 3, oligomers: Control vs LPC5: p = 0.0074, Control vs LPC10: p = 0.0004, Control vs LPC15: p = 0.0004; monomer: Control vs LPC5: p = 0.0379, Control vs LPC10: p = 0.0001, Control vs LPC15: p < 0.0001). e–h Western blot analyses were performed to evaluate α-Synuclein expression in MES23.5 dopaminergic neurons post-LPC and MPP+ interventions (n = 3, oligomers: Control vs LPC: p = 0.0041, Control vs MPP+: p = 0.0007, Control vs LPC + MPP+: p = 0.0002, MPP+ vs LPC + MPP+: p = 0.0008; monomer: Control vs LPC: p < 0.0001, Control vs MPP+: p < 0.0001, Control vs LPC + MPP+: p < 0.0001, MPP+ vs LPC + MPP+: p < 0.0001; oligomers/ monomer: Control vs LPC: : p = 0.0293, Control vs MPP+: p < 0.0001, Control vs LPC + MPP+: p < 0.0001, MPP + vs LPC + MPP+: p = 0.0352). i Immunofluorescence co-labeling images showing TH and α-Synuclein in SNC dopaminergic neurons of C57BL/6 J mice post-LPC injection. j Quantification of α-Synuclein immunofluorescence intensity in TH-positive regions (n = 3, t = 17.86, p < 0.0001). k Representative α-Synuclein immunofluorescence images in MES23.5 dopaminergic neurons after LPC and MPP+ interventions. l Analysis of α-Synuclein immunofluorescence intensity in MES23.5 dopaminergic neurons (n = 6, Control vs LPC: p = 0.0003, Control vs MPP+: p < 0.0001, Control vs LPC + MPP+: p < 0.0001, MPP+ vs LPC + MPP+: p = 0.01).
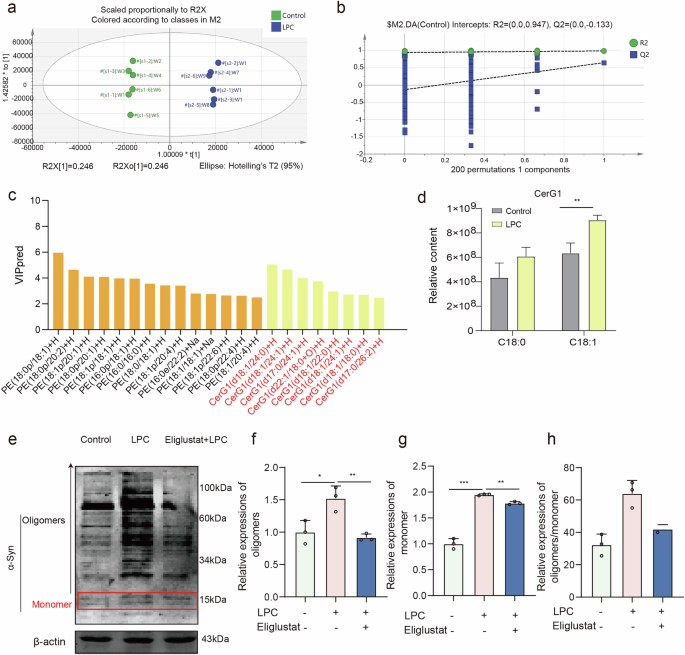
a Scatter plot displaying sample scores relevant to screening of differential lipids via principal component analysis. b Replacement test results of principal component analysis OPLS-DA. c VIP (Variable Importance in Projection) values of identified differential lipids. d The composition of CerG1 (C18:0, and C18:1) among lipids. e–h Western blot experiments assessing α-Synuclein expression levels in MES23.5 dopaminergic neurons post-LPC and Eliglustat interventions (n = 3, oligomers: Control vs LPC: p = 0.0260, LPC vs Eliglustat+LPC: p = 0.0061; monomer: Control vs LPC: p < 0.0001, LPC vs Eliglustat+LPC: p = 0.0011, oligomers/ monomer: Control vs LPC: p = 0.0046, LPC vs Eliglustat + LPC: p = 0.0489).
LPC-mediated Glycosylation deficiency of GCase and Golgi retention cause abnormal accumulation of GlcCer
GCase is a critical enzyme for GlcCer metabolism and lysosomal hydrolase activity. This study investigates the effect of LPC on GCase glycosylation in vitro. Using Western Blot analysis following glycoside endonuclease Endo-H (40 mU/mg protein, 37 °C for 24 h) treatment, GCase appeared as a 55 kDa band in its non-glycosylated form (Fig. 4a, b). LPC intervention at doses of 10 μg/mL and above resulted in a twofold decrease in glycosylated/non-glycosylated GCase ratio compared to the control group (Fig. 4c, d). Meanwhile, LPC intervention did not affect GCase protein expression (Supplementary Fig. 2a). Further analysis involved treating cells with the GCase inhibitor conduritol B epoxide (CBE) 308 μM for 24 h and the GCase agonist ML198 (0.4 μM) for 48 h. Western blot analysis revealed that both 10 μg/mL LPC and 308 μM CBE decreased the ratio of glycosylated to non-glycosylated GCase. Notably, treatment with ML198 effectively mitigated this imbalance (Fig. 4e, f). In addition, GCase activity decreased after LPC intervention (Supplementary Fig. 2b). Immunofluorescence labeling to detect the co-localization of the Golgi marker GM130 with GCase revealed that LPC intervention increased GCase retention in the Golgi from 53% to 62% (Fig. 4g–j). Conversely, co-localization of the lysosomal marker LAMP1 with GCase decreased from 71% to 51% under LPC treatment (Fig. 4k–n). In addition, compared to LPC group, the GCase/LAMP1 colocalization was increased after ML198 treatment (Supplementary Fig. 3). These findings suggest that LPC causes GCase retention in the Golgi and incomplete glycosylation. Lipidomic analysis showed that LPC and CBE treatments increased the abundance of the GlcCer family, leading to abnormal GlcCer accumulation, while ML198 ameliorated these effects (Fig. 4o). Western Blot analysis also demonstrated that LPC and CBE treatments led to increased expression of various molecular weights of α-Syn, whereas ML198 treatment reduced LPC-induced α-Syn aggregation (Fig. 4p–s). In summary, LPC impairs GCase glycosylation, resulting in its retention in the Golgi and subsequent GlcCer accumulation.
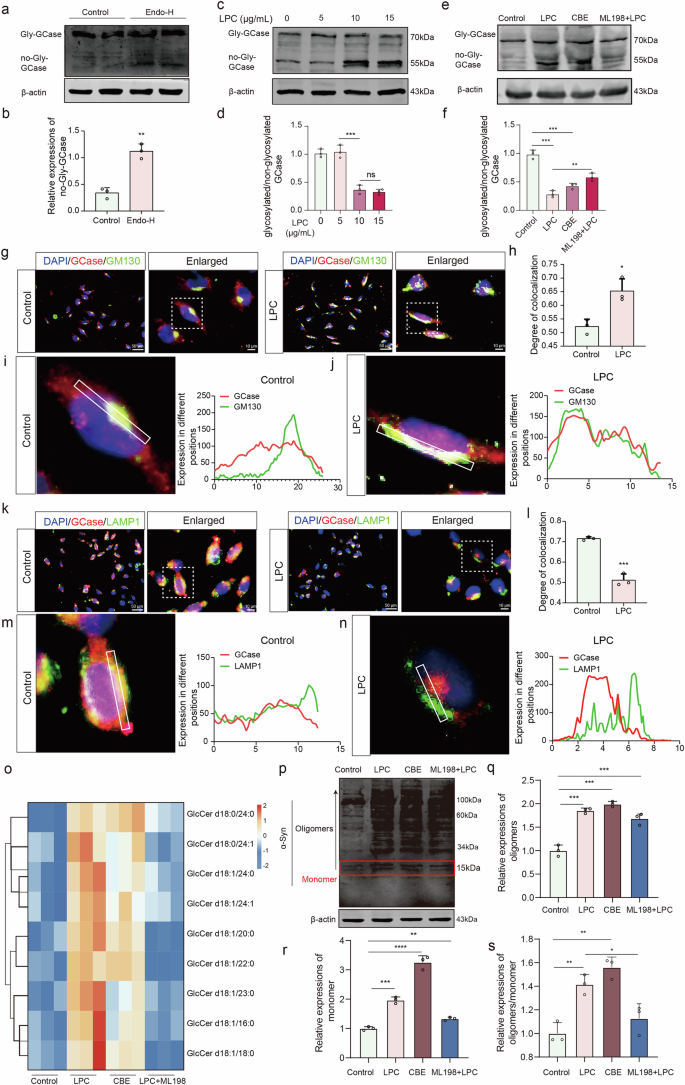
a, b Western blot experiments assessing the expression level of non-glycosylated GCase in MES23.5 dopaminergic neurons after treatment with glycosidic endonuclease Endo-H (n = 3, Control vs Endo-H, t = 7.996, p = 0.0013). c, d Western blot analyses of non-glycosylated GCase expression in MES23.5 dopaminergic neurons following intervention with different doses of LPC (n = 3, Control vs LPC5: p = 0.4962, ns, Control vs LPC10: p < 0.0001, Control vs LPC15: p = 0.0004). e, f Glycosylated/non-glycosylated GCase ratio in MES23.5 dopaminergic neurons analyzed via Western blotting after LPC treatment, CBE intervention, and ML198 administration (n = 3, Control vs LPC: p < 0.0001, Control vs CBE: p < 0.0001, LPC vs LPC + ML198: p = 0.0030). g Immunofluorescence co-labeling images of GCase and GM130 in MES23.5 dopaminergic neurons post-LPC intervention. h–j Statistical analysis of changes in the co-labeling degree of GCase and GM130 (n = 3, t = 4.331, p = 0.0123). k Immunofluorescence co-labeling image of GCase with LAMP1 in MES23.5 dopaminergic neurons after LPC intervention. l–n Statistical analysis of changes in the co-labeling degree of GCase and LAMP1 (n = 3, t = 11.30, p = 0.0003). O Heatmap illustrating alterations in the abundance of the glucosylceramide family in MES23.5 dopaminergic neurons following LPC intervention analyzed by high-performance liquid chromatography-mass spectrometry. p–s Western blot analyses were conducted to assess α-Synuclein expression in MES23.5 dopaminergic neurons following modulation of glucosylceramide levels. (n = 3, oligomers: Control vs LPC: p = 0.0004, Control vs CBE: p = 0.00002, Control vs ML198 + LPC: p = 0.0033; monomer: Control vs LPC: p = 0.0002, Control vs CBE: p < 0.00001, Control vs ML198 + LPC: p = 0.0023; oligomers/ monomer: Control vs LPC: p = 0.0052, Control vs CBE: p = 0.0007, LPC vs ML198 + LPC: p = 0.0428).
LPC Inhibits GRASP65 expression, disrupts Golgi structure, and impairs GCase glycosylation, leading to cognitive and motor deficits in mice
To investigate the absence of glycosylated GCase, we identified GRASP65 as a key mediator regulating Golgi stacking, vesicle tethering, and glycosylated modifications38,39. Western blot analysis revealed a dose-dependent reduction in GRASP65 expression following LPC intervention (Fig. 5a, b). In vitro immunofluorescence showed concurrent reductions in GRASP65 and TH expression post-10 μg/mL LPC treatment for 24 h (Fig. 5c–e). Stereotactic injections of LV-GRASP65 and LV-GRASP65-RNAi into the SN region were performed, followed by behavioral assessments using the Y maze (Fig. 5f, g). Exploration times in the new arm for the control, LPC-intervened, GRASP65 knockdown, and LPC-intervened groups after GRASP65 overexpression were 125.7 s, 58.47 s, 45.47 s, and 102.8 s, respectively. Both LPC modeling and LV-GRASP65-RNAi injection induced cognitive deficits, while LV-GRASP65 injection ameliorated LPC-induced impairments (Fig. 5h, i). In vitro, MES23.5 cells were infected with LV-GRASP65 and LV-GRASP65-RNAi to obtain GRASP65 OE and KD stable cell lines, which were established via puromycin selection. Western blot confirmed that LV-GRASP65 increased GRASP65 expression, whereas LV-GRASP65-RNAi inhibited it (Fig. 6a, b). Laser confocal microscopy of the Golgi marker GM130 showed that the GM130-positive area doubled in both the 10 μg/mL LPC and GRASP65 knockdown groups compared to the control group. Overexpression of GRASP65 relieved the LPC-induced expansion of the GM130 distribution area (Fig. 6c, d). Transmission electron microscopy further revealed that LPC intervention changed the Golgi apparatus from a compact, stacked structure to a loosely distributed state (Fig. 6e). Western blot analysis of GCase glycosylation indicated that non-glycosylated GCase expression was more than doubled in the LPC intervention and GRASP65 knockdown groups compared to the control group, while GRASP65 overexpression reduced the ratio of glycosylation to non-glycosylation in Gcase (Fig. 6f, g). Immunofluorescence labeling of α-Syn showed that α-Syn expression was significantly increased in both the LPC intervention and GRASP65 knockdown groups. Overexpression of GRASP65 mitigated this increase in α-Syn expression (Fig. 6h, i), and GRASP65 overexpression significantly suppressed LPC induced-insoluble α-Syn, soluble α-Syn, and p-α-Syn expression in SN (Supplementary Fig. 4). In conclusion, GRASP65 plays a crucial role in the intact glycosylation of GCase. LPC-induced downregulation of GRASP65 disrupts GCase glycosylation, leading to GlcCer accumulation and increased α-Syn levels, thus contributing to neurodegenerative processes.
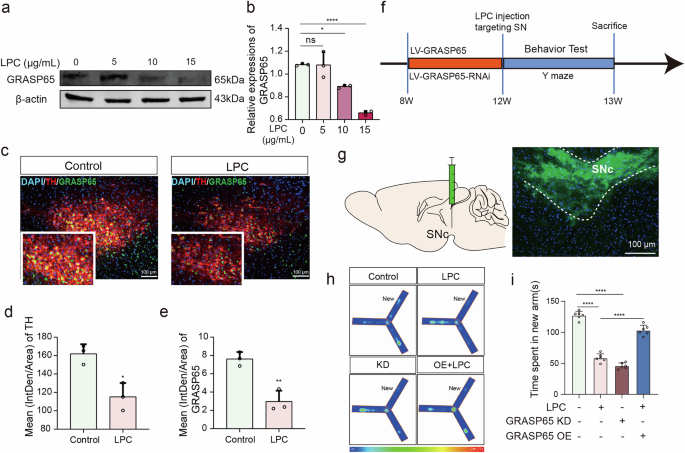
a, b Analysis of GRASP65 expression levels in MES23.5 dopaminergic neurons via WB assay following intervention with varying doses of LPC (n = 3, Control vs LPC10: p = 0.0147, Control vs LPC15: p < 0.0001). c Fluorescence staining images depicting TH and GRASP65 in SNC dopaminergic neurons of C57 mice post-LPC (1 mg/mL) injection and MPTP modeling. d, e Quantification of immunofluorescence intensity for TH and GRASP65 (n = 3, TH: t = 4.433, p = 0.0114; GRASP65: t = 5.741, p = 0.0046). f Flowchart illustrating virus injection, LPC injection, and behavioral phenotype testing procedures. g Schematic representation of lenti-virus injection in the SNC region of C57 mice. h, i Time spent time in new arm for Control, LPC, GRASP65 knockdown (KD), and LPC + GRASP65 overexpression (OE) groups in the Y-maze experiment (n = 6, Control vs LPC: p < 0.0001, Control vs GRASP65 KD: p < 0.0001, LPC vs LPC + (GRASP65 OE): p < 0.0001).
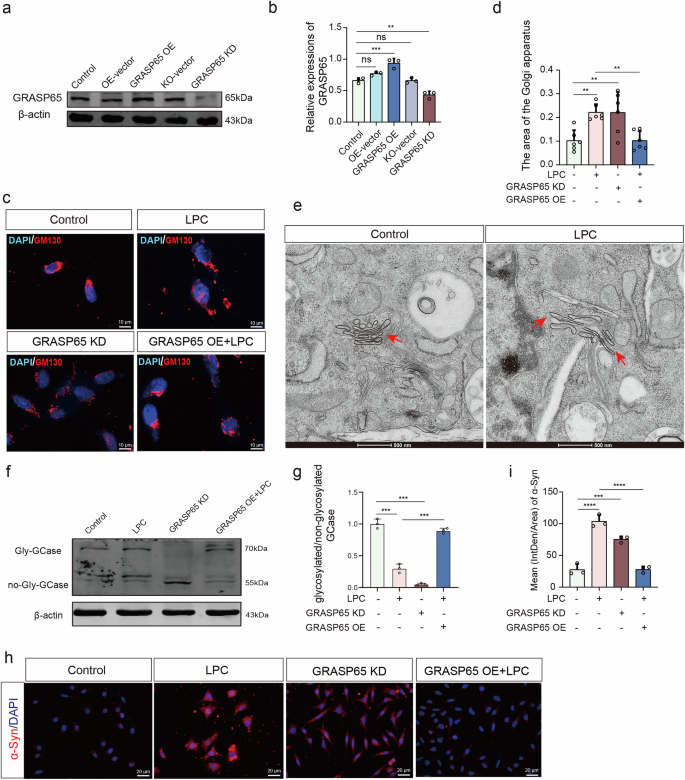
a, b Western blot experiments assessing GRASP65 expression levels in MES23.5 dopaminergic neurons transfected with GRASP65 overexpression versus knockdown virus (n = 3, Control vs GRASP65 OE: p = 0.0004, Control vs GRASP65 KD: p = 0.0020). c Fluorescence staining images depicting MES23.5 dopaminergic neurons transfected with GRASP65 overexpression versus knockdown virus and labeled with GM130 following LPC intervention. d Quantification of GM130 positive area (n = 3, Control vs LPC: p = 0.0068, Control vs GRASP65 KD: p = 0.0073, Control vs LPC + GRASP65 OE: p > 0.9999, ns). e Transmission electron microscopic observation of morphological changes in the Golgi apparatus after LPC intervention in MES23.5 dopaminergic neurons. f, g Western blot analyses of glycosylate/non-glycosylated GCase expression in MES23.5 dopaminergic neurons following transfection with GRASP65 overexpression versus knockdown virus and LPC intervention (n = 3, Control vs LPC: p < 0.0001, Control vs. GRASP65 KD: p < 0.0001, LPC vs LPC + GRASP65 OE: p < 0.0001). h Fluorescence staining images showing labeled α-Syn on MES23.5 dopaminergic neurons transfected with GRASP65 overexpression versus knockdown virus followed by LPC intervention. i Quantification of α-Syn fluorescence intensity (n = 3, Control vs. LPC: p < 0.0001, Control vs. GRASP65 KD: p = 0.0002, LPC vs. LPC + GRASP65 OE: p < 0.0001).
LPC-mediated GPR35 activation induces ERK phosphorylation, Caspase-3 activation, and GRASP65 cleavage, resulting in Golgi structure disruption
To investigate the specific mechanisms by which LPC exerts its effects, we performed MES23.5 cell RNA sequencing and identified differentially expressed genes using volcano plots (Fig. 7a). Additionally, we analyzed data of midbrain dopaminergic neurons from MPTP models obtained from the GEO database (GSE213100), constructing volcano plots to screen for differential genes in a similar manner (Fig. 7b). We then generated Venn diagrams to identify intersecting up- and down-regulated genes from both datasets, resulting in 20 up-regulated intersecting genes (Fig. 7c). These 20 genes were further analyzed using a clustering heatmap (Fig. 7d). Recent studies have suggested that orphan receptor families may be self-activated by the endogenous ligand LPC. Therefore, orphan receptor 35 (GPR35), identified as a significant finding from our sequencing efforts, has captured our attention. We obtained the 3D structures of GPR35 (PDB:8H8J) and LPC (PubChem ID: 5311264) from the RCSB PDB and PubChem databases, respectively, and performed molecular docking using AutoDock software. The binding energy between LPC and GPR35 was calculated to be -0.89, indicating spontaneous binding without external energy (Fig. 7e). Subsequently, we explored downstream effectors of GPR35 activation. KEGG pathway analysis suggested the activation of the ERK pathway (Fig. 7f). Western blot analysis demonstrated that activation of GPR35 by 10 μg/mL LPC for 24 h and 79 nM Pamoic acid for 24 h mediated ERK phosphorylation and increased Cleaved-Caspase3 expression. In contrast, inhibition of GPR35 with 100 nM CID2745687 for 10 min blocked LPC-induced ERK phosphorylation and reduced Cleaved-Caspase3 expression (Fig. 7g–i). As shown in Supplementary Fig. 5, GPR35 knockdown significantly reduced LPC-induced expression of p-ERK and cleaved caspase-3 expression and increased GRASP65 expression. As Cleaved-Caspase3 directly downstream of p-ERK cleaves GRASP65, we showed through Western blot that activation of Cleaved-Caspase3 by 10 μg/mL LPC for 24 h and 10 μM Ratpinal for 12 h inhibited GRASP65 expression. Inhibition of Cleaved-Caspase3 using 100 nM Z-DEVD-FMK for 24 h restored GRASP65 expression to levels affected by LPC (Fig. 7j–l). Furthermore, immunofluorescence labeling for Cleaved-Caspase3 (red) and GM130 (green) revealed that LPC-induced activation of Cleaved-Caspase3 increased the co-localization of Cleaved-Caspase3 with GM130 from 21% to 42%. The GM130 positive area also increased with increased Cleaved Caspase3 expression intensity (Fig. 7m–p).
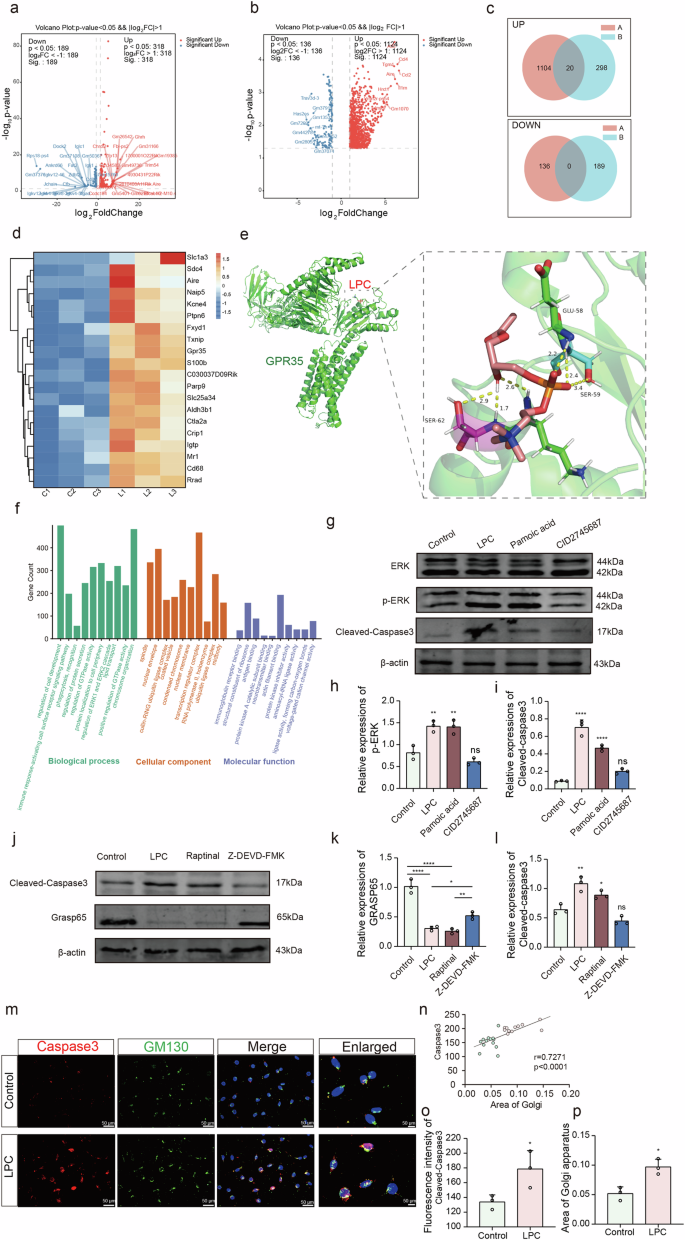
a Volcano plot illustrating the top 50 differentially expressed mRNAs following LPC modeling, highlighting up- and down-regulated transcripts. b Volcano plots delineating the top 20 differentially expressed mRNAs identified through analysis of the GEO database GSE213100, indicating both up- and down-regulated genes. c Venn diagrams displaying the intersecting up- and down-regulated genes derived from both LPC modeling and GEO database analysis. d Heatmap visualizing the expression patterns of intersecting up-regulated genes. e Schematic representation illustrating the docking results of LPC and GPR35. f Gene Ontology (GO) and Kyoto Encyclopedia of Genes and Genomes (KEGG) pathway analyses conducted on the differentially expressed genes. g–i Western blot analyses of p-ERK expression levels following intervention with LPC, GPR35 agonist, and antagonist (n = 3, Control vs LPC: p = 0.0025, Control vs Pamoic acid: p = 0.0029, LPC vs LPC + CID2745687: p = 0.0029), and Cleaved-Caspase3 expression levels (n = 3, Control vs. LPC: p < 0.0001, Control vs Pamoic acid: p < 0.0001, LPC vs LPC + CID2745687: p < 0.0001). j–l Western blot analyses of Cleaved-Caspase3 and GRASP65 expression levels post-intervention with LPC, Caspase3 agonist, and antagonist (n = 3, Cleaved-Caspase3: Control vs LPC: p = 0.0016, Control vs Raptinal: p = 0.0431, LPC vs LPC + Z-DEVD-FMK: p = 0.0001, GRASP65: Control vs LPC: p < 0.0001, Control vs Raptinal: p < 0.0001, LPC vs LPC + Z-DEVD-FMK: p = 0.0252). m Immunofluorescence co-labeling plots depicting Cleaved-Caspase3 with GM130 post-LPC intervention. n Statistical correlation analysis of Cleaved-Caspase3 and Golgi area (n = 12, r = 0.7271, p < 0.0001). 0 Statistical assessment of the co-localization degree of Cleaved-Caspase3 with GM130 (n = 3, t = 4.431, p = 0.0114). p Quantification of GM130 positive area (n = 3, t = 4.530, p = 0.0106).
LPC-mediated perturbations result in impaired autophagic flux, leading to compromised degradation and clearance of α-Synuclein
Through RNA-seq on midbrain substantia nigra region of control and LPC modeling mice, we found the majority of cellular components associated with these differential genes were related to lysosomes (Fig. 8a–c). It suggested that LPC intervention may influence autophagic processes. We examined two autophagy markers40, P62 and LC3B, using Western blotting. The results showed that LPC intervention elevated P62 expression (Fig. 8d, e), indicating an impediment to the autophagy process. Additionally, LPC decreased LC3BII expression (Fig. 8d, f), suggesting that LPC might hinder the maturation of autophagosomes. Additionally, immunofluorescence labeling of α-Syn (green) and P62 (red) showed increased expression of both proteins, along with an increased degree of co-localization (Fig. 8g–l). Simultaneously, immunofluorescence demonstrated increased α-Syn expression, decreased LC3B expression, and an increased degree of co-localization between the two (Fig. 8m–r). The GFP-RFP-LC3 reporter assay indicated that LPC suppressed the formation of autophagosomes and autolysosomes compared to control group (Supplementary Fig. 2c). To investigate the mechanism by which LPC blocks autophagy, we assessed the acidification of acidic organelles in MES23.5 cells using immunofluorescence co-labeling of the lysosomal marker LAMP1 and Oregon Green 488 dye. The results indicated that the intensity of OG488 fluorescence in the LAMP1-positive region was reduced after LPC intervention compared to the control group (Fig. 9a, b), suggesting that LPC impairs the lysosomal acidification process. Additionally, immunofluorescence labeling of LC3B (red) and LAMP1 (green) showed a decrease in the co-localization of the two markers from 69% to 56% following LPC intervention (Fig. 9c–g), which suggested that the fusion process of autophagosome and lysosome is blocked.
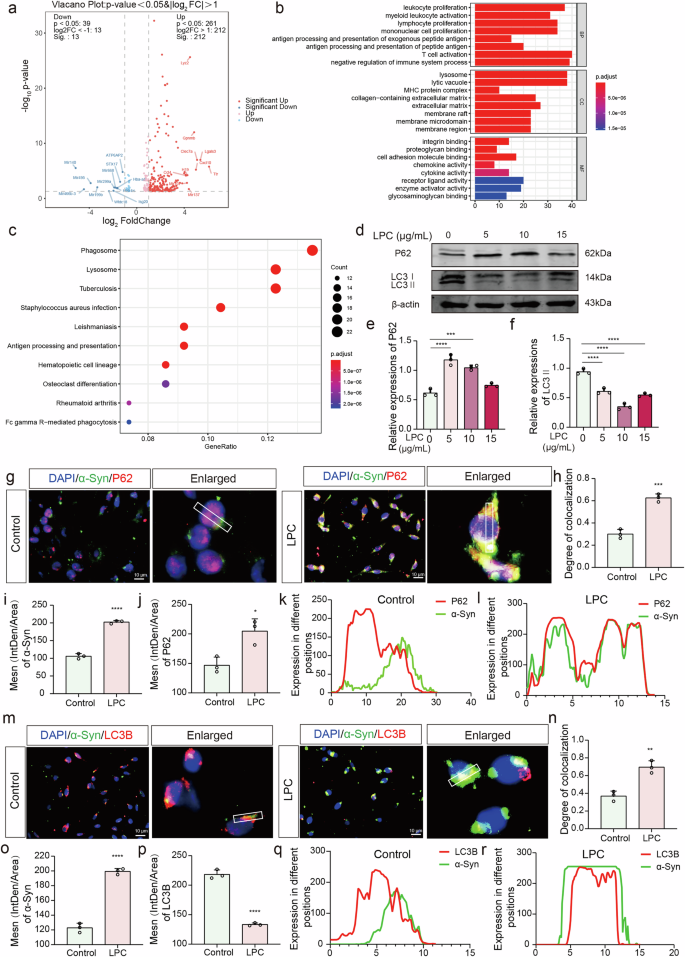
a Volcano plot illustrating the top 20 mRNAs identified for both up- and down-regulation. b, c GO and KEGG pathway analysis targeting differentially expressed genes. d–f Western blot (WB) experiments assessing the levels of the autophagy indicator P62 in MES23.5 dopaminergic neurons following intervention with varying doses of LPC (n = 3, Control vs LPC5: p < 0.0001, Control vs LPC10: p = 0.0001, Control vs LPC15: p = 0.1170, non-significant), and LC3B II levels (n = 3, Control vs LPC5: p < 0.0001, Control vs LPC10: p < 0.0001, Control vs LPC15: p < 0.0001). g, h Immunofluorescence co-labeling of α-Syn with P62 in MES23.5 dopaminergic neurons post-LPC intervention and co-localization analysis (n = 3, t = 10.4, p = 0.0005). i Statistics of α-Syn immunofluorescence intensity in MES23.5 dopaminergic neurons (n = 3, t = 19.74, p < 0.0001). j Statistics of P62 immunofluorescence intensity in MES23.5 dopaminergic neurons (n = 3, t = 4.301, p = 0.0157). k, l ImageJ line plot depicting the co-localization analysis of α-Syn and P62. (m, n) Immunofluorescence co-labeling of α-Syn and LC3B in MES23.5 dopaminergic neurons following LPC intervention and co-localization analysis (n = 3, t = 6.313, p = 0.0032). o Statistics of α-Syn immunofluorescence intensity in MES23.5 dopaminergic neurons (n = 3, t = 17.98, p < 0.0001). p Statistics of LC3B immunofluorescence intensity in MES23.5 dopaminergic neurons (n = 3, t = 18.35, p < 0.0001). q, r ImageJ line plot depicting the co-localization analysis of α-Syn and LC3B.
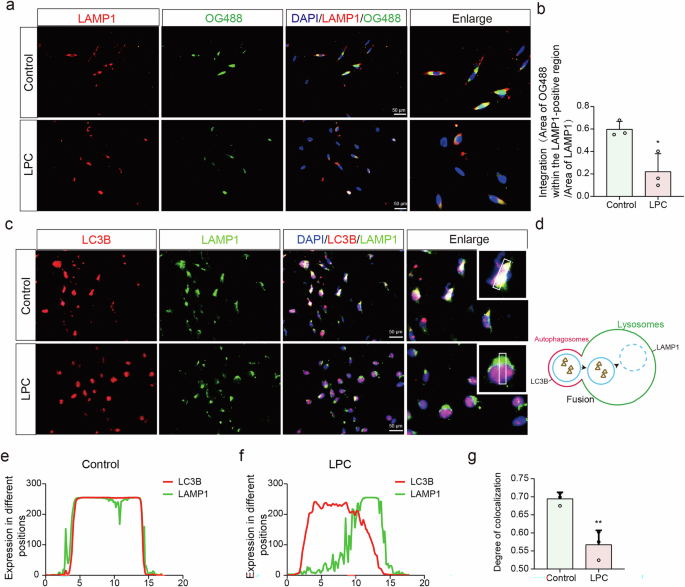
a Immunofluorescence co-labeling of OG488 with LAMP1 following LPC intervention. b Quantification of OG488 fluorescence intensity within LAMP1-positive regions (n = 3, Control vs. LPC: t = 3.736, p = 0.0202). c Immunofluorescence co-labeling of LAMP1 and OG488. d Diagram of the fusion process between autophagosome and lysosome. e–g Statistical assessment of changes in LC3B and LAMP1 co-labeling intensity (n = 3, t = 5.076, p = 0.0071).
Solanesol presents a dual role: simultaneous ERK Inhibition and lysosomal acidity restoration shield dopaminergic neurons from LPC-induced injury
Coenzyme Q10 has been extensively studied for the treatment of neurodegenerative diseases. Coenzyme Q10 promotes neuronal survival by improving mitochondrial function, reducing ROS production, and regulating ERK signaling. Solanesol has higher stability and bioavailability as a precursor of Coenzyme Q10. Thus, we used solanesol to treat LPC-induced PD-like symptoms, administering a total of 16 mg of solanesol by gavage to LPC-modeling mice for 14 days. Behavioral assessments were performed by the Y-maze (Fig. 10a). The average time for mice to explore the new arm was 135.2 s in the control group, 41.60 s in the LPC intervention group, and 81.03 s in the solanesol-treated group, indicating that solanesol effectively ameliorated the cognitive deficits caused by LPC (Fig. 10b, c). Western blot analysis showed that 20 μM solanesol significantly reduced the abnormal accumulation of α-Syn induced by LPC for 24 h (Fig. 10d–g). Furthermore, Western blotting for phosphorylated ERK, GRASP65, and Cleaved-Caspase3 revealed that solanesol treatment significantly inhibited ERK phosphorylation and Cleaved-Caspase3 expression, thereby restoring GRASP65 expression (Fig. 10h–k). The acidification Oregon Green 488 dye results showed that the intensity of OG488 fluorescence in LAMP1-positive regions was reduced after LPC intervention compared to the control group. Solanesol treatment significantly restored the lysosomal acidic environment (Fig. 10n, o). Furthermore, flow cytometry analysis revealed that solanesol treatment did seem to reduce the LPC-induced apoptosis, although not significantly (Fig. 10l, m). Moreover, Immunofluorescence results showed that, compared to the LPC treatment group, Solanesol intervention significantly decreased GM130/GCase colocalization while markedly increasing GCase/LAMP1 colocalization (Supplementary Fig. 6a, b). These observations suggest that Solanesol may promote the proper trafficking of GCase, restoring its localization to the lysosomes.
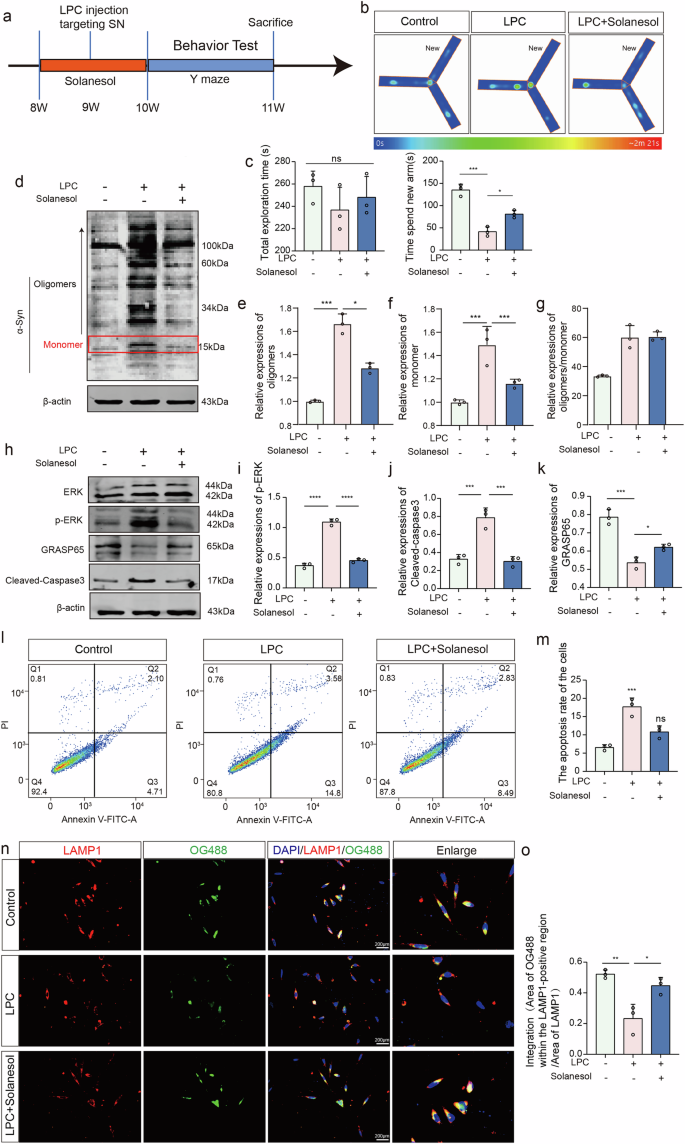
a Schematic illustrating the process of drug injection and behavioral phenotype testing in mice. b, c Time spent in new arm in the Y- maze (n = 6, Control vs LPC: p < 0.0001, LPC vs LPC+Solanesol: p = 0.0001). d–g WB analysis of individual molecular weight α-Syn expression levels post-LPC and Solanesol interventions (n = 3, oligomers: Control vs LPC: p = 0.0061, LPC vs LPC + Solanesol: p = 0.0026; monomer: Control vs LPC: p = 0.0002, LPC vs LPC + Solanesol: p = 0.0004; oligomers/ monomer: Control vs LPC: p = 0.001, LPC vs LPC+Solanesol: p = 0.0098). h–k Expression levels of p-ERK, GRASP65, and Cleaved-Caspase3 analyzed by WB assay (n = 3, p-ERK: Control vs LPC: p < 0.0001, LPC vs LPC+Solanesol: p < 0.0001; GRASP65: Control vs LPC: p = 0.0002, LPC vs LPC+Solanesol: p = 0.0362; Cleaved-Caspase3: Control vs LPC: p = 0.0007, LPC vs LPC+Solanesol: p = 0.0006). l Flow cytometry analysis of apoptosis in MES23.5 dopaminergic neurons following LPC and Solanesol treatments. m Statistical analysis of the percentage of apoptotic cells (Q2 + Q3) (n = 3, Control vs LPC: p = 0.0005, LPC vs LPC+Solanesol: p = 0.0068). n, o Immunofluorescence co-labeling of LAMP1 and OG488.
Discussion
PD is a prevalent neurodegenerative disorder characterized by the loss of dopaminergic neurons and the formation of Lewy bodies, which are enriched with aggregated α-syn41,42. Some studies have identified various substances for the early diagnosis of PD or for predicting motor and non-motor functions, such as serum neurofilament light chain, cerebrospinal fluid LAMP2, neurofilament light chain, and syntaxins43,44. However, there are currently no compounds that effectively combine both anti-aggregation and degradation functions for the low-molecular-weight oligomers of α-syn, which are recognized as the most effective neurotoxic agents in the pathogenesis of PD, that have been successfully used in clinical treatment of the disease45. In this study, we found that LPC promoted the formation of α-synuclein tangles and oligomers through the metabolic reprogramming of GlcCer and damaged the autophagy pathway and lysosomal acidification of α-synuclein.
In the brain, ~0.01% of neurons are responsible for dopamine production, playing a crucial role in regulating various physiological processes. The loss of dopaminergic neurons is the most significant pathological hallmark of PD, leading to progressive deterioration of motor abilities and cognitive function46,47. In our study, we employed a PD mouse model, which included LPC stereotactic injection and intraperitoneal MPTP injection, followed by behavioral assessments using the rotarod and Y-maze tests. Our findings revealed that while LPC alone caused damage to the dopaminergic system, it did not induce motor and cognitive deficits as severe as those observed with MPTP. Furthermore, we observed that LPC treatment resulted in the loss of dopaminergic neurons and a significant increase in α-Syn expression across all molecular weights within these neurons. These results suggest that LPC may contribute to the pathogenesis of PD by accelerating the aggregation of α-Syn into toxic oligomers, leading to the degeneration of dopaminergic neurons. In this study, we confirmed that LPC increased GlcCer abundance and aggravated α-Syn accumulation. Treatment with the glucosylceramide synthase inhibitor Eliglustat reversed the damage caused by LPC. GlcCer is a neuroactive esterified lipid and one of the main components of neuronal cell membranes. However, GlcCer levels are abnormally increased in both PD patients and mouse models48. In vitro experiments indicate that GlcCer directly facilitates the conversion of recombinant α-synuclein into a protease-resistant form, representing a toxic conformational change. This affects the autophagic process in cells, leading to protein misfolding and metabolic disturbances, ultimately impacting neuronal survival49.
Alpha-synuclein (α-Syn) can form toxic oligomers through interactions with lipids or small molecules and post-translational modifications28. It has been reported that the N-terminus of α-Syn has an affinity for sphingolipids, and this binding induces a conformational change to a more stable α-helical structure50. In brain tissue from patients with PD or in body fluids from mouse models of PD, the expression of various lipid metabolic enzymes is abnormal51. For instance, increased sphingomyelinase activity has been reported in the PD brain, elevating ceramide levels and activating apoptotic processes51,52. Our lipid sequencing confirmed that LPC intervention increases the abundance of the GlcCer family, a clinical manifestation also observed in Gaucher disease. Gaucher disease studies have revealed GCase gene mutations and GlcCer metabolic changes, which are common clinical features of PD53. Under normal physiological conditions, GCase hydrolyzes GlcCer to produce glucose and ceramide, maintaining intracellular sphingolipid metabolic balance. Initially, we hypothesized that LPC intervention might inhibit GCase expression. However, sequencing data showed that LPC did not affect GCase transcript levels54. Our experimental results demonstrated that LPC hinders GCase glycosylation, preventing its transport from the Golgi to the lysosome. Certainly, the interaction between α-syn and GCase represents a complex bidirectional relationship. Mutations in the GBA gene (encoding GCase) are recognized as genetic risk factors for PD. GBA mutations reduce GCase activity, leading to the accumulation of glucolipids, particularly in lysosomes55,56. Our findings show that altered glycosylation of GCase impairs the degradation of GlcCer, promoting its accumulation and enhancing α-syn aggregation within neurons. Additionally, altered GCase can disrupt the autophagy-lysosome pathway, further impairing α-syn clearance57. Changes in GCase may also result in metabolic dysregulation, as evidenced by our lipidomic data, where multiple lipid metabolism pathways are perturbed. Such dysregulation can destabilize α-syn or promote its aggregation. In addition, accumulated α-syn interferes with proper folding and trafficking of GCase, hindering its lysosomal transport58. α-syn can directly bind to GCase, inhibiting its enzymatic activity and obstructing GlcCer degradation. Moreover, α-syn aggregates may form membrane pores, causing proton leakage from lysosomes and raising the lysosomal pH59. This bidirectional relationship creates a vicious cycle where reduced GCase activity hinders α-syn degradation, and α-syn accumulation further inhibits GCase function, accelerating PD progression.
Although previous studies suggest that N-glycosylation of Gcase has limited effects on its structural stability and enzymatic function60, this prompted us to hypothesize that more complex glycosylation, such as Golgi-mediated O-glycosylation, could play a pivotal role in regulating Gcase activity. The Golgi apparatus, the main organelle involved in glycosylation, was observed to change from a compact to a loose structure upon LPC intervention. Additionally, LPC reduced the expression of the Golgi structural protein GRASP65, disrupting Golgi structure and leading to defective GCase glycosylation. GRASP65, a peripheral protein on the Golgi apparatus, is involved in Golgi stacking61, maintaining cis-Golgi structure, and ensuring the integrity of glycosylation38. In most mammalian cells, the Golgi apparatus typically presents as a continuous ribbon structure. However, in neurodegenerative diseases, the Golgi apparatus in specific neurons, such as dopaminergic neurons, often fragments, a common feature of many neurodegenerative diseases62. Knockdown of GRASP65 in Hela cells resulted in Golgi stack fragmentation and a significant reduction in proteins involved in N-glycosylation, leading to defective glycosylation. These findings suggest that GRASP65 plays a crucial role in maintaining Golgi integrity and protein glycosylation. We propose that the loss of GCase glycosylation is due to LPC-induced inhibition of GRASP65 expression. LPC likely disrupts Golgi structure by altering Golgi membrane curvature39,63,64. Current evidence indicates that phospholipase A2 (PLA2) and lysophosphatidylcholine acyltransferase (LPAT), which directly regulate LPC content, are involved in modulating Golgi membrane curvature65. Although we have observed morphological changes in the Golgi apparatus indicative of membrane curvature alteration and GCase O-glycosylation, this aspect was not fully explored. Given the relative lack of research in this area, comprehensive glycoproteomics and structural biology studies will be essential to pinpoint the specific O-glycosylation sites on Gcase and their relationship with its conformation and enzymatic function.
RNA-Seq and GEO database GSE213100 were performed to identify receptors binding LPC to dopaminergic neurons. Screening genes with altered expression in both datasets revealed that the G protein-coupled receptor GPR35 was a common intersection. Since the identification of GPR35 as an orphan receptor GPCR in 1998, there has been limited information available on this receptor, partly due to the scarcity of ligands that regulate it66. Recent proposals suggest that endogenous lipids, including LPC, may activate orphan receptors such as GPR119, implying that LPC might also act through GPR3567. GPR35 has three downstream molecular pathways: RhoGEF-RhoA-ROCK1/2, PLC-β-DAG, and ERK-JNK-P38, along with cAMP-PKA and AKT66,68. Gene Ontology (GO) analysis indicated significant activation of the ERK pathway. Experimental results showed that LPC promoted the phosphorylation of ERK and increased the expression of Cleaved-Caspase3, suggesting that GPR35 may exert its effects through ERK phosphorylation. It has been reported that Cleaved-Caspase3 cleaves GRASP65 at three specific sites in the C-terminus of GRASP65 (Asp320, Asp375, and Asp393)69,70. This suggests that the decrease in GRASP65 expression observed in this study is due to Cleaved-Caspase3 activity.
This study elucidates the specific mechanism by which LPC induces α-Syn aggregation3, a process typically managed by autophagy under normal physiological conditions71,72. Monomeric α-Syn can be degraded through chaperone-mediated autophagy73,74, while oligomeric α-Syn is degraded by the fusion of autophagosomes and lysosomes to form autolysosomes75,76. GO and KEGG pathway analyses revealed changes in lysosome-related pathways and genes. LPC intervention was found to increase the expression of P62 and decrease the expression of LC3II, indicating that LPC impairs the autophagy process and exacerbates α-Syn aggregation. Moreover, LPC reduced the co-localization of autophagosomes and lysosomes, suggesting that α-Syn autophagosomes failed to fuse with lysosomes. The regulation of key protein expression involved in this process by LPC may be a focal point for future research. Studies have shown that changes in autophagy associated with neurodegenerative diseases are linked to the expression or modification of various related genes. This study highlights the direct autophagic regulation of dopaminergic neurons by abnormal LPC, accompanied by a decrease in LC3II. Furthermore, some studies reviewed that the mutual regulation of neuroinflammation and autophagy is crucial for the damage and repair of dopaminergic neurons in PD. LPC, as a metabolic product of the phospholipid family, has been confirmed to promote central inflammatory responses by activating microglial cells. In the future, our research will also focus on exploring the dialog mechanism between LPC and “microglia-dopaminergic neurons” to address the mechanisms of dopamine damage. In our study, we also found that, LPC intervention significantly reduced lysosomal acidity and attenuated α-Syn-dependent lysosomal degradation function. Studies indicate that lysosomal acidification is regulated by a dual system involving V-ATPase and the CLC family, both modulated by intracellular lipid signals77,78. We propose that LPC disrupts intracellular lipid balance and affects the lysosomal acidification process, though the precise mechanisms require further exploration.
During the study, to mitigate the damage caused by LPC, we introduced the small molecule drug solanesol for treatment. The results demonstrated that solanesol significantly ameliorated LPC-induced motor and cognitive dysfunction in mice, reduced α-synuclein (α-Syn) accumulation, and improved LPC-induced lysosomal acidification deficits. These findings suggest that solanesol holds substantial potential as a novel small molecule therapeutic for neurodegenerative diseases. Solanesol, a precursor of Coenzyme Q10, is a potent antioxidant with anti-inflammatory, membrane-stabilizing, antibacterial, and anti-ulcer properties79,80,81,82. Coenzyme Q10 has been shown to improve functions in various neurodegenerative diseases, such as PD, amyotrophic lateral sclerosis, Alzheimer’s disease, and multiple sclerosis83. It primarily prevents intracellular lipid peroxidation and participates in intracellular signaling. Additionally, Coenzyme Q10 can partially prevent ERK content alterations, highlighting its importance in cellular metabolism84. In our experiment, we observed that LPC-induced ERK phosphorylation via GPR35, and solanesol treatment reduced p-ERK levels, thereby mitigating LPC-induced damage. It should be noted that our study was performed in a rodent cell line and rodent animals; future studies may use iPSC-derived dopaminergic neurons to further strengthen our conclusions.
In summary, this study elucidated the mechanisms by which LPC induces abnormal α-Syn aggregation in dopaminergic neurons, causes lysosomal clearance obstacles, and leads to dopaminergic neuron apoptosis, thereby accelerating the development of PD (Fig. 11). These findings highlight the importance of LPC, GCase glycosylation and intracellular lipid homeostasis in α-Syn aggregation, providing new directions and insights for PD treatment.
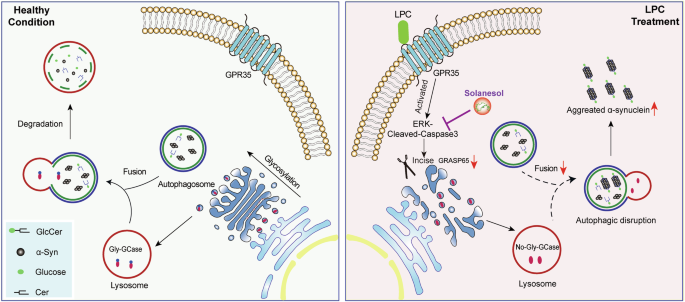
Graphic summary.
Methods
Animals
All experimental procedures were conducted in strict accordance with the guidelines stipulated in the Care and Use of Laboratory Animals, as prescribed by the United States National Institutes of Health. Furthermore, ethical oversight was ensured by adhering to the regulatory framework delineated by the Ethics Committee of the Experimental Animal Center at Xuzhou Medical University, with formal approval obtained under Protocol Numbers L202211S018. The experimental cohort comprised C57BL/6 J male mice, which were housed and maintained under standardized conditions. Specifically, these mice were domiciled in a controlled facility where environmental parameters such as temperature (23 ± 1.5 °C) and humidity (45 ± 15%) were meticulously regulated, and a 12 h light-dark cycle (lights on from 7:00 pm to 19:00 am) was enforced. Mice aged between 8 and 12 weeks were selected for inclusion in the study. Prior to commencement of experimental procedures, all mice underwent a minimum acclimatization period of 7 days within this controlled environment. Each experimental group consisted of no fewer than three mice. The procurement and utilization of mice were conducted in strict adherence to regulatory protocols and were facilitated through the Laboratory Animal Centre of Xuzhou Medical University, with authorization granted under License Number SYXK [Su] 2020-0048.
1-Methyl-4-phenyl-1,2,3,6-tetrahydropyridine induced PD model
Mice (6–8 weeks, 21–23 g) were chosen based on the experimental design to undergo intraperitoneal injection of 1-methyl-4-phenyl-1,2,3,6-tetrahydropyridine (MPTP). The establishment of subacute Parkinson’s disease (PD) models involved the intraperitoneal administration of 30 mg/kg MPTP (Cat# M0896, Sigma, St. Louis, MO, USA) daily over a continuous 5 day period. Control mice received comparable injections of normal saline solution for the purposes of comparison.
Stereotaxic injection
Male C57BL/6 J mice (6–8 weeks, 21–23 g) were subjected to deep anesthesia using nembutal (Sigma Aldrich, 57-33-0) (45 mg/kg) prior to bilateral injection into the substantia nigra (SN). The injection coordinates were set at anterior–posterior -3.1 mm from bregma, mediolateral ±1.4 mm from midline, and dorsoventral -4.4 mm from the dura, according to the Mouse Brain in Stereotaxic Coordinates85. The brain stereotaxic procedure is referenced from previous articles86,87. Each mouse underwent bilateral administration of 2 μL of 1 mg/mL Lyso-phosphatidylCholine (LPC, dissolved in 50% ethanol) (Sigma-Aldrich, 9008-30-4) via a trace syringe connected to a micro-injection pump, which remained in situ for 2 min to ensure optimal stabilization. Following this period of stabilization, LPC infusion commenced at a rate of 0.2 μL/min, followed by a subsequent 10 min resting phase to facilitate LPC diffusion. The syringe was then gradually retracted, and the incision site on the scalp meticulously sutured. Postoperative care involved maintaining mice in a thermoregulated environment and providing nutritional support in the form of peanuts. After a latency period of 5 days, mice underwent perfusion and histological assessments.
Midbrain protein extraction protocol
Following euthanasia of the C57BL/6 J mouse via cervical dislocation, the entire brain was meticulously extracted and positioned within a designated brain mold (RWD-68713). Subsequently, the bregma was delineated, and the midbrain substantia nigra region was precisely excised, with a posterior displacement of 3.1 mm employing a surgical scalpel. Protease inhibitors (KeyGen BioTECH, Cat#KGP610) were then introduced into the cell lysate (Beyotime, Cat#P0013B), followed by homogenization of the tissue and subsequent centrifugation to isolate the supernatant. The protein concentrations within the resultant supernatant were quantitatively determined utilizing the BCA protein assay (Yeasen Biotechnology (Shanghai) Co., Ltd, Cat# 20200).
Tissue processing
Male C57BL/6 J mice were subjected to profound anesthesia induced by nembutal (Sigma Aldrich, 57-33-0). Following anesthesia, a midline incision was made in the chest to expose the heart, into which a perfusion needle was carefully inserted into the left ventricle. The right atrium was then incised to facilitate the infusion of pre-cooled normal saline, ensuring thorough removal of all blood from the circulatory system. Subsequently, a 35 ml solution of 4% paraformaldehyde was perfused to fix the tissues. The brains were subsequently postfixed for 24 h in 4% paraformaldehyde and then transferred to a 30% sucrose solution for cryoprotection (Leica CM1950). The cryostat freezer table temperature was set to -22°C, with the cabin temperature maintained at -20°C. The mouse brain was retrieved from the -80°C freezer, swiftly placed into the cryostat, and prepared by removing the cerebellum and olfactory bulb. The brain tissue was then embedded in OCT freezing embedding agent, and 20 μm-thick brain slices were sectioned and affixed onto glass slides. Finally, the prepared brain slices were stored in a -20°C freezer for subsequent analysis.
Y-Maze (ZH-MGY, AnHui ZhengHua Biologic Apparatus Facilities, China)
Prior to each trial involving mice, the maze underwent disinfection with 75% alcohol to mitigate the presence of residual odors. Visual cues, affixed above the maze via a scaffold, were meticulously maintained in a consistent configuration throughout all testing sessions. During the initial trial, one of the arms was sealed off with a door, affording the mice the opportunity to freely explore the remaining two arms for a period of 5 min. Subsequently, following a 60 min intertrial interval, the mice were reintroduced into the maze, with access granted to the previously closed arm. This phase allowed unrestricted exploration of all three arms for an additional 5 min duration. Notably, the selection of the initially closed arm and the open arm remained consistent across all trials. For analytical purposes, an “arm entry” was operationally defined as the moment when all four paws of the mouse entered a particular arm. A comprehensive entry was considered achieved only when all four limbs of the mouse were fully inside the designated arm. Video tracking technology was utilized to monitor and record the time spent by the mice within the various arms. The analytical focus centered on evaluating the exploration time devoted to both the novel and familiar arms during the 5-min duration of the second trial.
The spin rod test (ZH-600B, AnHui ZhengHua Biologic Apparatus Facilities, China)
The spin rod test serves as a robust methodology for assessing motor coordination and balance in mice, necessitating their ability to maintain equilibrium on a rotating bar. This apparatus facilitates the quantification of key parameters such as falling time delay, rotational speed leading to a fall, and the extent of mouse locomotion during the evaluation. On the day of experimentation, mice are housed within their respective cages and afforded a minimum of 15 min for acclimatization within the testing environment. During this acclimatization period, individual mouse weights are meticulously recorded on the designated datasheet. For subsequent trial identification, non-toxic ink is employed to mark each mouse with distinctive stripes on the base of their tails. The spinning rod device is then activated, commencing the experimental protocol, which encompasses three trials, each separated by a 15 min intertrial interval. If warranted, successive batches of mice can undergo testing within a single trial prior to progression to the subsequent trial. Notably, no preliminary training regimen precedes the testing phase. The device operates in turbo mode, spanning rotational speeds from 4 to 40 revolutions per minute (rpm) over a duration of 300 s. Upon activation, the instrument initiates an “acceleration wait” phase, maintaining a steady rotation speed of 4 rpm until the start button is pressed. Mice are then gently placed onto the rod, and endeavors are made to encourage forward locomotion to facilitate balance maintenance. Initially, the rod rotates at a consistent speed of 4 rpm, allowing mice to orient themselves within their respective channels. Once all mice exhibit readiness, as indicated by their capacity to sustain forward movement at 4 rpm for a brief duration, the start button is pressed. This action triggers an acceleration phase, increasing the rotational speed from 4–40 rpm over a 40 s interval. Throughout the experimental procedure, the rotating device automatically captures and records pertinent metrics, including the latency of each mouse’s fall from the rod, the rotational speed at the time of fall, the distance traversed by the mouse, and the rationale for experiment termination (e.g., falling, jumping, or passive rotation).
Western blot analysis
Cell or tissue samples were lysed in RIPA lysis buffer (P0013B, Beyotime) with protease inhibitor. The soluble and insoluble a-syn protein were extracted according to previously studies88,89. Thirty micrograms of each sample underwent electrophoresis on 10 ~ 15% gels employing SDS-PAGE and were subsequently transferred to nitrocellulose (NC) membranes (BioTrace, Cat#P/N 66485). To minimize nonspecific binding, the membranes underwent blocking for 2 h at room temperature (25°C) in a wash buffer containing 5% skim milk. Following blocking, the primary antibodies were incubated overnight at 4 °C, comprising rabbit anti-α-Syn (HUABIO, Cat#ET7107-31), rabbit anti-Grasp65 (ABclonal, Cat#A2316), rabbit anti-GBA (GCase, Bioss, Cat# bs-11779R), rabbit anti-P62/SQSTM1 (Proteintech, Cat#18420-l-AP), rabbit anti-LC3B (Proteintech, Cat#18725-1-AP), rabbit anti-Cleaved-Caspase3 (CST, Cat# 9661S), rabbit anti-ERK1/2 (bioworlde, Cat#BS1112), rabbit anti-Phospho-alpha Synuclein (HUABIO, Cat# ET7107-30), rabbit anti-p-ERK1/2 (bioworlde, Cat# AP0484), and mouse anti-β-actin (Proteintech, Cat#66009-l-lg). Subsequent to three 10 min room temperature washes with washing buffer, the secondary antibody, diluted at 1:20,000 in washing buffer, was applied and incubated for 2 h at room temperature. Following an additional three 5 min room temperature washes, protein expression was visualized utilizing a dual infrared laser imaging system (Odyssey LI-COR). The densitometry of protein bands was normalized to β-actin, serving as an internal reference for quantification. Glycoside endonuclease Endo-H was used to distinguish the molecular weight of non-glycosylated and glycosylated GCase.
Cell culture
MES23.5 cells (YS1332C) were cultured in Dulbecco’s Modified Eagle Medium (DMEM, BasalMedia Co., Ltd, Cat# L130KJ) supplemented with 10% fetal bovine serum (FBS, NEST Biotechnology, Cat# 209111) and 1% penicillin-streptomycin at 37 °C in a humidified atmosphere containing 5% CO2. GCase activity of MES23.5 cells was measured according to the manufacturer’s instruction (Abcam, Cat# ab273339).
TUNEL assay
TUNEL assay was performed using TUNEL Cy5 Apoptosis Detection Kit (APExBIO, Cat# K1135) according to manufacturer’s manual. Briefly, the cells were fixed with 4% paraformaldehyde in phosphate-buffered saline (PBS, BDBIO HangZhou China, Cat# L205) for 20 min at the designated processing time. For subsequent processing, a Proteinase K solution was prepared by diluting it with 1× PBS to a concentration of 2 mg/mL, further diluted to a final concentration of 20 μg/mL. Subsequently, 100 μL of the diluted Proteinase K solution was added dropwise to each sample, ensuring comprehensive coverage of the entire cell plates, and incubated for 20 min at room temperature. Following this step, cell plates underwent three washes with PBS, each lasting 5 min. In preparation for detection, 5× Equilibration buffer was diluted into 1× Equilibration buffer with ddH2O at a 1:10 ratio. Next, 100 μL of 1× Equilibration buffer was added dropwise to each sample, covering all regions to be detected, and incubated for 10-30 min at room temperature. The labeling solution was then prepared by combining 34 μL ddH2O, 10 μL 5× Equilibration buffer, 5 μL Cy5-dUTP Labeling Mix, and 1 μL Terminal deoxynucleotidyl transferase (TdT) Enzyme. After aspiration of the 1× Equilibration buffer post-incubation, 50 μL of the labeled reaction solution was added dropwise to the sample, placed in a light-protected black box, and incubated at 37 °C for 60 min. Finally, the cells were incubated with a 4’,6-diamidino-2-phenylindole (DAPI)-containing anti-fluorescent quenching agent for 5 min, and images were captured using immunofluorescence microscopy (Olympus BX43 + DP74). Brain tissue sections underwent a comparable protocol, entailing incubation with 0.3% Triton X-100 for 20 min followed by blocking with 10% FBS. Post-PBS washing, sections were exposed to TUNEL reaction mixture and sheep anti-Tyrosine Hydroxylase (TH, Abcam, Cat#ab113). Then, Brain tissue sections were subjected to three rounds of PBS washing, each lasting 5 min, prior to incubation with secondary antibodies for 2 h at ambient temperature, followed by a further three washes. Imaging was facilitated through immunofluorescence microscopy (ZEISS LSM880).
Transmission electron microscopy
MES23.5 cells, cultured in a 100 mm cell culture dish (SAINING Biotechnology, Cat# 1022000), were allowed to reach confluence. The cells were then trypsinized using trypsin and the digestion was halted using complete medium. The resulting cell suspension was centrifuged at 600 g for 5 min, and the supernatant was carefully removed. Subsequently, 1 ml of PBS was added to resuspend the cells, which were then transferred to a 1.5 ml EP tube. After another centrifugation at 1500 g for 10 min, the supernatant was discarded. The cells were fixed using an electron microscopy fixative solution containing 4% paraformaldehyde and 2.5% glutaraldehyde in a solvent of 0.1 M PB. Fixation was allowed to proceed for a minimum of 24 h. Following fixation, resin embedding was employed, and the resin was meticulously trimmed with a blade to expose the embedded sample for subsequent ultra-thin sectioning. The sample sections were cut using an ultramicrotome and carefully placed onto a copper mesh. Osmic acid was utilized to stain the tissues, followed by staining with acetic acid uranium and lead. The prepared samples were then subjected to examination using transmission electron microscopy (Tecnai G2 Spirit Twin).
Cell transfection
During cell passage, cells were seeded into 6-well plates(BaiDi Biotechnology Co., Ltd. Cat#H803000) at a density of ~4 × 10 ^ 5 cells per well, ensuring a cell density of around 20% per well, in preparation for virus transfection. HiTransG A&P (GENE) was diluted 25-fold using DMEM, and the virus (GENE, LV-Gorasp1-RNAi, 95552-1; LV-Gorasp1, 63362-1) was added based on the corresponding virus titer. Following configuration, MES23.5 cells were infected in a 6-well plate for 12–16 h, during which the cell status was closely monitored. After the infection period concluded, stable transfer strains were screened using a puromycin-containing complete medium for a duration of 1 month. Verification of viral transfection efficiency was conducted through SDS-PAGE and observation using immunofluorescence microscopy (Olympus BX43 + DP74).For GPR35 knockdown, cells were transfected with GPR35 small interfering RNA (siRNA) using jetPRIME transfection reagent according to the manufacturer’s protocol. The siRNA sequences utilized are as follows: CCUGGAUGCCAUCUGUUACUA. For autophagic flux detection, cells were transfected with tandem fluorescent-tagged LC3 (GFP-RFP-LC3) virus (Hanbio Biotechnology Co. Ltd., China) based on the different pH stability of RFP and GFP fluorescent proteins.
Flow cytometry assay
Cell apoptosis was evaluated utilizing an Annexin V-FITC/PI-Apoptosis Kit (APExBIO, Cat#K2003-20). MES23.5 cells, post-passage, were cultured until reaching ~80% confluency in an incubator. Subsequently, varying doses of exogenous LPC were administered, and following a 24-h treatment period, the cells underwent trypsinization followed by centrifugation at 350 g for 5 min. The resulting cell pellet was resuspended and washed with phosphate-buffered saline (PBS), followed by an additional centrifugation step to remove the supernatant. Subsequently, MES23.5 cells were resuspended in 500 μL of binding buffer, and a mixture of 5 μL Annexin V-FITC and 5 μL Propidium Iodide (PI) was added. After a 15 min staining period in the dark, flow cytometry analysis was performed using a FACScanto II flow cytometer. Cells negative for PI staining and positive for Annexin V staining were classified as early apoptotic cells, while those positive for both PI and Annexin V staining were identified as late apoptotic cells.
RNA sequencing
The RNA sequencing was performed as previously described90. For library construction, 1 μg of RNA per sample was used. The RNA was converted into double-stranded cDNA following the protocol provided by the reverse transcription kit manufacturer. The double-stranded cDNA was then digested and labeled with Tn5 transposase. Enrichment PCR was subsequently carried out using HiFi PCR Mix for NGS. Library quantification was conducted with an Agilent 2100 Bioanalyzer. Paired-end sequencing was performed on an Illumina NovaSeq platform, with sequencing services provided by GENEWIZ Biotech. The reads were aligned to the mouse genome using the STAR aligner (http://code.google.com/p/rna-star/). Genes with a fold change of ≥1.5 and a P-value < 0.05 were identified as significantly differentially expressed. Gene Ontology (GO) enrichment analysis of these differentially expressed genes (DEGs) was conducted using Metascape (http://metascape.org).
Drug treatment
MES23.5 cells were cultured in DMEM supplemented with 10% FBS and 1% Penicillin–Streptomycin. One day after passaging, the cells were treated for 24 h with 10 μg/mL LPC (Sigma-Aldrich, 9008-30-4) and 20 μM MPP+. To prepare the solanesol solution, 100 mg of solanesol (MCE, Cat#HY-N0576) was dissolved in 15.8 mL of DMSO to achieve a concentration of 10 mM. For cell treatment, the effective concentration was 20 μM with an intervention time of 12 h. In vivo, each mouse received a total of 16 mg administered by gavage over 14 days. For the preparation of Conduritol B Epoxide (CBE, a glucocerebrosidase inhibitor), 5 mg (yuanye Bio, Cat#6090-95-5) was dissolved in DMSO to make a 50 mg/mL solution, yielding a final concentration of 308 μM for 24 h. ML198 (a glucocerebrosidase agonist) was prepared by dissolving 1 mg (yuanye Bio, Cat#1380716-06-2) in DMSO. 0.4 μM ML198 was added for 24 h following a 24-h LPC treatment. Pamoic acid (a GPR35 agonist) was prepared by dissolving 1 mg (MCE, Cat#HY-W008613) in 2.58 mL of DMSO to make a 1 mM solution. 79 nM Pamoic acid with an intervention time of 24 h was choosed. For the preparation of CID2745687 (a GPR35 inhibitor), 1 mg (MCE, Cat#HY-107537) was dissolved in 2.53 mL of DMSO to make a 1 mM solution. After a 24-h LPC intervention, 100 nM CID2745687 was applied for 10 min. Raptinal (a caspase-3 agonist) was prepared by dissolving 1 mg (MCE, Cat#HY-121320) in 2.59 mL of DMSO to make a 1 mM solution. An intervention concentration of 10 μM Raptinal for 12 h was used. Finally, Z-DEVD-FMK (a caspase-3 inhibitor) was prepared by dissolving 1 mg (MCE, Cat#HY-12466) in 1.5 mL of DMSO to make a 1 mM solution. 100 nM Z-DEVD-FMK was added for 36 h.
Immunocytochemistry
Cultivated within 24-well plates pre-coated with cellular substrates, the cells were promptly fixed in 4% paraformaldehyde dissolved in phosphate-buffered saline (PBS) for a duration of 20 min upon reaching the designated processing interval. After fixation, permeabilization was achieved utilizing a solution comprising 10% fetal bovine serum (FBS) and 0.3% Triton-X-100 in PBS at ambient temperature. Primary antibody immuno-labeling ensued overnight at 4 °C, featuring antibodies such as rabbit anti-α-Syn (HUABIO, Cat#ET7107-31), rabbit anti-Grasp65 (ABclonal, Cat#A2316), mouse anti-GM130 (BOSTER, Cat#M05865-2), rabbit anti-GBA (GCase, Bioss, Cat#bs-11779R), mouse anti-CD107a/LAMP1 (Proteintech, Cat# 67300-l-lg), rabbit anti-P62/SQSTM1 (Proteintech, Cat#18420-l-AP), rabbit anti-LC3B (Proteintech, Cat#18725-1-AP), mouse anti-α-Syn (Abcam, Cat# ab1903), rabbit anti-Cleaved-Caspase3 (CST, Cat# 9661S). Following three successive PBS washes for a duration of 5 min each, cellular specimens were incubated with secondary antibodies for 2 h at ambient temperature, and subsequently subjected to three additional washing steps. Imaging was conducted utilizing an Olympus BX43 microscope. Brain tissue sections underwent a comparable protocol, entailing incubation with 0.3% Triton X-100 for 20 min followed by blocking with 10% FBS. Post-PBS washing, sections were exposed to primary antibodies, including sheep anti-Tyrosine Hydroxylase (TH, Abcam, Cat#ab113), rabbit anti-α-Syn (HUABIO, Cat#ET7107-31), and rabbit anti-Grasp65 (ABclonal, Cat#A2316). Brain tissue sections were subjected to three rounds of PBS washing, each lasting 5 min, before incubation with secondary antibodies for 2 h at ambient temperature, followed by a further three washes. Imaging was facilitated through immunofluorescence microscopy (Olympus BX43 + DP74).
Lipidomic analysis
The lipidomic analysis was performed as previously described91. Briefly, Lipidomic analysis was conducted with a Thermo Scientific Exactive Plus mass spectrometer, coupled with a Vanquish UHPLC system, operating in both positive and negative ion modes. Separation was achieved using an ACQUITY UPLC BEH C18 column (1.7 μm, 2.1 × 100 mm, Waters) at 40 °C, employing a gradient of mobile phase A (10 mM ammonium acetate in acetonitrile: water) and phase B (10 mM ammonium acetate in isopropanol: acetonitrile). To monitor interrun and interproject variability, a quality control (QC) spike mixture, comprising pooled samples, was included. Lipid identification was performed using LipidMaps (www.lipidmaps.org), and statistical analyses were carried out with SIMCA version 14.1 software.
OG lysosome-loading procedure
Oregon Green 488 dye (APExBIO, Cat#195136-58-4) is a vibrant, green-fluorescent dye optimized for excitation with a 488 nm laser. It features a high extinction coefficient and fluorescence quantum yield and remains pH-insensitive within the physiological range. Nonetheless, its pKa of 4.6 renders it suitable for monitoring pH variations within lysosomes. For imaging preparation, cells were cultured overnight in 24-well plates pre-coated with appropriate substrates. The culture medium was supplemented with 1 mg/mL Oregon Green (OG) and cells were incubated for 15–16 h. Post-incubation, the dye was thoroughly washed out over a period of at least 4 h before imaging. Immunofluorescence microscopy was performed using an Olympus BX43 microscope equipped with a DP74 camera to capture the images.
Statistical analysis
All graphical representations of data were meticulously crafted using Prism 8 (GraphPad, La Jolla, CA, USA) in conjunction with Photoshop 2022 and Illustrator 2021 (Adobe, San Jose, CA, USA). Data presentation adheres to the convention of means ± standard errors. For comparative analyses among three or more groups, one-way analyses of variance (ANOVAs) were employed, while Student’s t-tests were utilized for comparisons between two groups. The significance threshold for all statistical tests was set at p < 0.05. Lipidomics principal component analysis was executed using SIMCA. Bioinformatics analyses, including the generation of results such as volcano maps, cluster heat maps, GO-KEGG cluster maps, and Venn diagrams, were conducted using online platforms (https://cloud.oebiotech.cn/, http://www.bioinformatics.com.cn/). Quantification of immunofluorescence and grayscale detection of SDS-PAGE results were carried out on representative images using ImageJ. Colocalization analysis was performed using the EzColocalization plugin in ImageJ (https://imagej.net/ij/).
Responses