Machine learning map of climate policy literature reveals disparities between scientific attention, policy density, and emissions

Introduction
Current efforts to reduce emissions fall far short of what is required to keep global warming well below 2° as established in the Paris Agreement1. In fact, global carbon emissions continue to rise, despite requirements to reach net-zero emissions within the next 30–50 years. To avoid the worst impacts of climate change, countries need to increase the ambition of their emissions reductions pledges, and to close the implementation gap between pledges and current policies. Only decades remain before CO2 emissions need to reach net-zero in mid-century2 and achieving this will require rapid learning from evidence on which policy instruments work in what contexts3.
Although current mitigation policies are insufficient to meet emissions reductions targets as specified in nationally determined contributions (NDCs), which in themselves are insufficient to achieve the temperature target of the Paris agreement1, thousands of policies have been implemented across sectors and regions, and there are some limited examples of emissions reductions in some jurisdictions and sectors4. Moreover, it has been shown that the number of policies a country enacts is associated with stronger emissions reductions5,6. Policies from around the world are collected in databases7,8 that comprise 7074 individual policies across 198 countries and territories. These databases present a valuable resource for policy learning that can help to bridge the emissions gap9.
There is also a substantial scientific literature on climate policy instruments, made up of both ex-post evaluations of instruments that have already been implemented, as well as ex-ante studies of how different instruments could reduce emissions. Both of these strands of literature are necessary for effective policy learning. However, efforts to systematize this literature10,11 have remained limited in scope in terms of instrument coverage, or outcomes studied. Key challenges that hinder systematic learning are the difficulty in defining system boundaries for climate-relevant policies, as well as a lack of consistent and comprehensive climate policy typologies.
Further, the sheer size of the literature on climate polices – which is scattered across many different scientific communities and encompassing many different sectors, instrument types, and frames of analysis – makes large-scale evidence synthesis in this area especially challenging. Given this scale and diversity of research, it is increasingly hard for scientists to stay abreast with research developments within their own fields. This is also a challenge for science assessments such as those carried out by the Intergovernmental Panel on Climate Change (IPCC)3, which is tasked with providing comprehensive assessments of the science of climate change. Digital technologies, machine learning, and natural language processing (NLP) therefore present promising avenues for making tractable the task of the IPCC, and for enabling large-scale synthetic work on which the IPCC must build12,13,14,15.
In this paper, we take a critical step towards accelerating learning on climate policies by displaying an overview of developments in the field. We use machine-learning methods from natural language processing (NLP) to systematically map the scientific literature on climate policies16. A systematic map “collates, describes, and catalogues available evidence” in order to “identify evidence for policy-relevant questions, knowledge gaps, […], and knowledge clusters”16. Rather than directly providing answers to questions about the effects of climate policies, this map shows us what has been studied and where, thereby potentially informing directions for primary research (including through funding), and enabling further evidence synthesis work, from individual reviews to scientific assessments like the IPCC. Given the size of the literature, the traditional, hand-based approach to assembling such a map is not feasible when it comes to research areas with many thousands of papers. Using a set of over 2500 hand-coded documents, we fine tune the language model ClimateBERT17 to identify the subset of 84,990 studies in the broader climate literature that investigates climate policy instruments, categorise them by policy type and sector, and determine the type of analysis applied. Our automated classification pipeline enables us to provide a living systematic map in support of research activities as well as science assessments in this space18.
In the following sections, we first characterise what a climate policy is, and develop a new typology of climate policy instruments which addresses inconsistencies and gaps in existing schemes. This allows us to operationalise a working definition of a climate policy which we use to hand-code studies and train a machine-learning model to identify and categorise the wider climate policy-relevant literature. After using our model to predict inclusion and category labels for hundreds of thousands of potentially relevant documents, we explore the landscape of climate policy research, identifying which types of instruments have been studied and where. We contrast the density of climate policy research with the density of actual policies19, and the distribution of emissions, allowing us to investigate where, and in what sectors, policy research matches enacted policies.
We set out to identify articles that study climate policy instruments which address the mitigation of climate change (instruments addressing adaptation are covered in an accompanying piece20). This requires unambiguous definitions and a comprehensive, fine-grained typology of policy instruments. We must also establish a workable definition of what constitutes a climate mitigation policy instrument. To establish clear system boundaries, we include policies only when emissions reductions are mentioned, or when a policy is unambiguously motivated by the desire to reduce GHG emissions or GHG concentrations. This is the case when a policy directly targets GHGs such as with a carbon tax or GHG emissions standard (see Methods for further discussion).
As such, an article on subsidies for renewable energy technologies would not be included unless emission reductions or climate targets were mentioned, while an article on a carbon tax or GHG emissions trading system would be included. This is because a government may have multiple reasons for supporting renewable energy technologies, such as energy security, a desire to move away from nuclear, or a reduction in local air pollution, while the climate motivation for pricing carbon is unambiguous. The instrument itself explicitly targets the reduction of greenhouse gas emissions.
We acknowledge that this means many studies of policies that have important effects in reducing emissions will be missed, but choose a definition that can be applied consistently and with minimal ambiguity. Since we do not have access to each policy and the motivations of the decision makers who enacted them, we focus on what the study itself says. If a study looks at a policy in the context of climate change or emissions reduction, we consider it a study on climate policy. We do not propose this as a superior or conclusive definition of climate policies, but simply one which can be applied with minimal ambiguity. Our dataset, on the explicit climate policy literature, therefore only represents a subset of the literature on policies that are relevant to mitigating climate change, yet it is the largest database of climate policy literature we are aware of.
We develop a new typology of climate policies (Fig. 1), which bridges the two existing typologies used in two main climate policy databases: Climate Change Laws of the World (CCLW)7 and the Climate Policy Database by the NewClimate Institute (CPDB)8. The explicit typology inherent in the International Energy Agency (IEA) policy database21 is not made public. Our typology is structured in three levels. For clarity, the typology is defined by the means by which governments or municipalities pursue policy goals. At the top level, means can be either making agreements with other actors, either state or non-state (agreements), providing funding or altering economic incentives (economic instruments), mandating what other actors must or must not do (regulatory instruments), providing information or building capacity in the expectation that it changes the behaviour of other actors (information, education, and training), or setting targets or strategies, or altering institutional arrangements (governance, strategies and targets). The second level of the hierarchy adds details on the specific type of instrument, e.g. a carbon price vs. a subsidy, while the third level offers further specifications e.g. by distinguishing between carbon taxes and emissions trading schemes, which both change economic incentives by putting a price on carbon.

A typology of climate policy instrument types.
Supplementary Figs. 1 and 2 show the similar clusters of instrument types between our new typology and the existing policy database typologies, indicating that their structures are broadly similar. However, there are some important differences. For example, in the CCLW typology, research and development (R&D) comes under the top-level category “capacity building”, whereas we include it under investment, which is itself a sub-category of economic instruments. This is because the government, in providing funding for R&D, operates through providing resources, not by providing information. A change of curriculum in publicly funded entities, on the other hand, would be considered under the category of information, education, and training. CCLW provides a separate category for “direct investment”, with sub-categories relating to climate finance, and the provision of public goods. We argue that clarity is created by assigning sub-categories to parent categories based on how they do what they do (in this case by spending money).
This is based on the classic NATO typology22, helping to tie this work to the broader policy literature. Nodality corresponds to information, education and training, Authority corresponds to regulatory Instruments, Treasure corresponds to economic instruments, and Organisation corresponds to governance, strategies and targets. Agreements could conceivably be allocated to Authority, but given their particular function in the climate change policy realm, we assign these to a separate category. Our typology differs somewhat from the typology introduced by Sterner and Robinson23, which allows for more fine-grained distinctions between what we classify as economic instruments, but less fine-grained distinctions between what we classify as information, education, and training instruments, agreements, and governance, strategies and targets.
Strategies and targets constitute a special case of climate policy, as it could be argued that they are not instruments at all, being merely an expression of policy goals rather than means to achieve those goals. However, we argue that strategies and targets are a particular type of governance arrangement, and that they themselves have effects. As well as setting expectations for businesses and citizens, they also bind current and future governments – either legally or implicitly – to take actions in line with the strategy or target, or justify why they did not do so. We therefore include such instruments in our typology, but discuss these critically in the results section.
After converting the policy types in the CCLW and NCI databases to our own typology, we merge both databases using the title, country, and date fields using the cosine similarity of the titles. We calculate the cosine similarity of each policy in the CCLW database to each policy from the NCI database assigned to the same country and from a year not more than 1 year apart from the year given in the CCLW database. We then annotate by hand the pair with the highest similarity as either duplicated or not, assuming all pairs with a cosine similarity of 1 are duplicates, and all pairs with a cosine similarity of 0 are unique. From 2058 policies in CCLW and 5962 policies in NCI we compile 7551 unique policies, which we use for the analysis in this paper. Each individual policy can be mapped to one or more of our top level categories, and one or more sector.
To identify and classify the literature on climate change instruments, we search the open access bibliographic database OpenAlex with a query (reproduced in full in supplementary materials) which aims to identify the whole of climate literature24. This query may miss specific climate-relevant policies that do not refer to emissions reductions or climate goals, but according to our operational definition of climate policy literature, such documents would not be included in our study. Our query returned 1,026,371 studies.
We proceeded to screen these documents, marking those that were relevant according to our definition, and, if they were relevant, recording the specific climate policy instrument they focused on (at each of our 3 levels). If multiple instruments were analysed, we recorded each of these. We also recorded the sector targeted by the instrument (marking cross-sectoral where this was not specified or where the paper discussed general reductions in emissions), as well as the name of the policy instrument, the country in which the policy was enacted or envisioned, the governance level at which the policy was enacted or envisioned (sub-national, national, or supra/inter-national), whether the study provided ex-post or ax-ante analysis, or whether the methodology was quantitative or qualitative.
After hand-screening, we trained machine learning classifiers to classify each of these categories, and used a pre-trained geoparser25 to extract the locations mentioned in each study. We assessed (see methods for training and evaluation details) a variety of pre-trained language models26,27, including ClimateBERT, which had undergone additional pre-training on climate relevant texts (including scientific abstracts)17.
Based on F1 scores (which are bounded between 0 and 1 and describe the harmonic mean of precision, the proportion of predicted positive cases that are truly positive, and recall, the proportion of truly positive cases which are predicted positive) for the different labels, we find that ClimateBERT17 predicts the categories inclusion, sector, and the top level of the instrument typology best (Table 1). Here we observe a macro F1 score of 0.66 (table 1), although performance varies widely from our least frequent category (information, education and training, which achieved an F1 score of 0.31 with 57 labelled examples) to our most frequent category (economic instruments, which achieved an F1 score of 0.86 with 460 labelled examples). Classifier performance was not always reliable at the more detailed level, although our best model could identify carbon pricing with an F1 score of 0.77 (294 labelled examples), it achieved an F1 score of 0 for the category “Institutions” (44 labelled examples). We therefore refer in the following sections to instruments at the top level of the hierarchy, as well as in individual cases to specific sub-instruments that were well classified.
Results
A growing climate policy literature
In total, we estimate that the number of papers relevant to climate policy instruments is 84,990 (Fig 2a). 26% of this total has been published since 2020. The most common instrument types are economic instruments, comprising 41,568 papers, and governance strategies and targets (34,432 papers). Since 2017, papers on governance, strategies, and targets have become the most common; in 2022, out of a total of 8120 published papers, 4518 were on governance, strategies and targets, compared to 3263 papers on economic instruments (Supplementary Fig. 8). However, the majority of the governance, strategies, and targets papers we identified in screening and labelling referred primarily to targets. 80% of studies on governance, strategies and targets published in 2022 did not refer to any other instruments apart from agreements (with 13% also referring to economic instruments, and 7% referring to regulatory instruments). Just as national policies fall short of the commitments made by governments (the aforementioned implementation gap), a large portion of the scientific literature deals with policy commitments without describing how these might be implemented (e.g. because they provide a technological assessment of a scenario that reaches a target).

Growth of literature on climate policy instruments (a). The distribution of papers across instrument types and sectors (b), where bar heights correspond to the number of papers in each sector and widths correspond to the share of mentions of instruments within papers on each sector.
The type of instrument studied varies substantially across sectors (Fig 2b). For example, of the 5000 documents studying policies in the industry sector, 76% analyse economic instruments, while only 8% study regulatory instruments. Studies on economic instruments also outnumber those on regulatory instruments in all other sectors except the buildings sector, where regulatory instruments (32%) substantially outnumber economic instruments (20%) in policy studies. The buildings sector is also the only sector in which enacted regulatory instruments outnumber enacted economic instruments (Supplementary Fig. 4).
For effective policy learning on climate solutions, we need both ex-ante studies – which provide modelling or other future-looking evidence on the potential or predicted effects of a policy – and ex-post studies – which when properly synthesised can tell us what policies have worked, under what conditions, and why. Bodies of evidence on different instrument types have different proportions of ex-post and ex-ante studies (Fig. 3). Ex-ante studies substantially outnumber ex-post studies where documents analyse economic instruments as well as governance, strategies and targets. On the other hand, for regulatory instruments, information instruments, and agreements, the share of ex-post and ex-ante studies is close to equal. Overall, around half of studies do some form of ex-post analysis, while around 7 in 10 studies do some form of ex-ante analysis (note that studies can be labelled as both ex-post and ex-ante).

a–e Shares of studies by policy instrument type. f Shares in all documents. Note: Shares may add up to more than 1, as documents can contain both ex-post and ex-ante analysis.
Disparities in scientific attention, policy density, and GHG emissions
Normalizing regional publication patterns by emissions helps to understand whether the scientific community devotes also more attention to studying emissions reductions in those countries or regions. For example, while the U.S. and China, the two largest emitters, are studied in a sizable 34% of the climate policy instrument literature, their GHG emissions share is considerably larger with 40% (Fig 4a). When we normalise the number of studies by the GHG emissions of each country in 2021 (and exclude very small countries with less than one 1 Mt of emissions), the UK becomes the most studied country relative to its emissions, with 11,716 studies per Gt of GHG emissions, closely followed by Sweden, with 11,036 studies per Gt of GHG emissions. The USA and China, with 1337 and 158 studies per Gt respectively, occupy ranks 31 and 89 (out of 158 countries for which we have data) respectively. Interestingly, the UK and Sweden are both countries that have sustained substantial reductions in emissions over the last decade4.
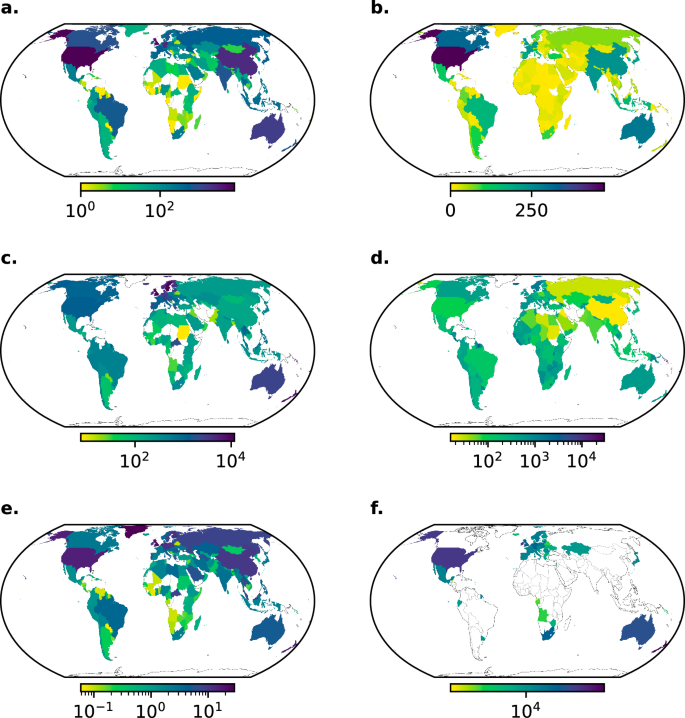
a Number of studies by country. b Number of policies by country, according to CCLW and New Climate Institute databases. Number of studies (c) and policies (d) relative to greenhouse gas emissions in 2021. e Number of studies over number of policies. f Number of studies divided by annual percentage emission reductions.
To what extent does the distribution of policy literature match the density of climate policies across countries? The two highest emitting countries also display a large number of policies (Fig 4b), but this is relatively small, after normalising for their emissions (Fig. 4d). The ratio of studies to policies is again high for the USA and China (Fig. 4e), and particularly low for Africa. This suggests that we may have substantial knowledge gaps on African climate policy, while the USA and China are highly studied given the amount of policies they have been enacting. However, we note that Sub-Saharan African countries in particular are relatively policy dense given their share of global emissions (Fig. 4d), and considering the fact that as non-Annex I countries they were not committed to reduce emissions under the Kyoto Protocol. Further, our literature identification strategy may, by focussing on studies indexed in English and on the explicit climate policy literature, be less able to identify climate-policy relevant literature in sub-Saharan Africa.
An alternative perspective is to consider where emissions reductions have actually been achieved, and whether these cases have been well studied in the literature. When we look at sustained periods of annual emissions reductions, following4 (see methods for further details), we find that the number of studies per maximum annual percentage reduction in emissions is highest in Canada, the USA, and Australia, which are all wealthy countries that have achieved relatively low reductions despite a large amount of scientific coverage. By contrast, some of the countries that have achieved the most impressive sustained average annual reductions – such as Greece, Denmark, and Iceland – have received relatively little scientific attention. Both may be important for policy learning: a focus on countries struggling to achieve reductions may highlight political barriers to climate action; whereas a focus on successful cases could point to good instrument design and/or promising near-term entry points to emissions reductions9,28. Looking at emissions reductions over a shorter timespan (Supplementary Fig. 5) reveals additional countries that have achieved emissions reductions, albeit with less certainty that these are “sustained”. Among these countries, Brazil is much studied (621 studies), despite its modest reduction of 0.3% reductions per year, while Argentina is less frequently studied (25 studies) despite its larger reduction of 1% per year.
Instrument types in science and policy
Scientific attention to policies of different types may match the share of policies of different instrument types to a greater or lesser extent in each country, keeping in mind the limitations in the scope of both literature and policy databases. A greater divergence between scientific and policy attention may indicate that the priorities or preferences of scientists and policymakers are divergent, either (depending on perspective) because scientists do not adequately direct their attention to the policy types that are politically feasible in a country, or because policymakers do not enact policies that are supported and studied by the majority of scientists. Looking more closely at individual countries, we can measure the extent to which the instrument types in the literature match those of enacted policies by summing the difference between the percentage of studies, and the percentage of enacted policies on each policy instrument. This varies widely by country (Fig. 5). Of countries with at least 5 enacted policies and 50 policy studies, Korea, Portugal, Finnland, Norway, and Switzerland have distributions of instrument types in the literature which most closely resemble the distribution of enacted policies. Laos, Russia, Singapore, the Philippines, and South Africa have distributions of instrument types in the literature which differ most strongly from the distribution of enacted policies. In each of the latter cases, the share of literature on economic instruments substantially outweighs the share of enacted economic policy instruments.

The distribution of instrument types in scientific literature (upper bar) and enacted policies (lower bar) for each country in countries with the 20 most similar (a) and least similar (b) distributions of policy and scientific attention. Dissimilarity (which is bounded by 0 and 1 and represented by a cross) is given summing the differences between shares for each instrument. Country labels show the number of studies, followed by the number of policies.
Moreover, arguments about whether scientific attention has been allocated appropriately given political constraints and concerns (or conversely whether policymakers have sufficiently heeded scientific knowledge29) have been particularly focused on economic instruments (particularly carbon pricing), given perceptions of the difficulty of enacting such policies, and (claimed) limited effectiveness30,31,32. Here we examine whether the distribution of climate policy research is disproportionately focused on economic instruments such as carbon prices as compared to the distribution of actually existing climate policies. We find that the share of studies focussing on economic instruments (49%) is indeed somewhat higher than the share of policies which use economic instruments (35%) (Fig. 6). However, there is significant regional variation in this finding: in North America, the ratio of study share to policy share stands at 1.21:1, compared to 2.55:1 in Africa, and a mere 0.82:1 in Europe.

The share of studies (green dots), compared to the share of enacted policies (purple dots) for each policy instrument type in each region.
Within economic instruments, we explore the distribution of pricing and subsidy instruments, analysing how this has changed over time, and how this varies across regions. Globally, the share of papers on economic instruments looking exclusively at prices (including emissions trading schemes) compared to subsidies has shrunk over the last two decades, from 92% in 2005, to 77% in 2022. This decreasing dominance of price instruments is globally consistent, although there is a large variation in the proportion of literature focusing on prices in each continent (see Supplementary Fig. 7). In South America and Asia, 69% of the economic instruments literature focuses on prices, whereas this figure stands at 79% in Europe, 83% in Asia, 86% in North America, and 89% in Oceania.
Unlike economic instruments, where scientific attention is generally greater than policy density, regulatory instruments are comparatively understudied across all regions. Regulatory instruments are described by the IPCC as enjoying “greater political support”, but being “more economically costly”33. The disproportionally low attention to regulatory instruments could be a sign that science focuses on those policies seen to be more efficient policies at the expense of policies which command political support, potentially inadequately reflecting political economy concerns that result in seemingly “second best” policy landscapes34. This may result in scientific blind spots in terms of how well such second-best instruments perform, and how they interact with other instruments.
Varying sectoral coverage in scientific and policy attention
In terms of sectoral coverage, a large number of documents discuss the power sector, or cross-sectoral emissions reductions (28% and 33% of paper-sector mentions respectively) (Fig. 7). The power sector is also the largest source of emissions, accounting for 37% of global net GHG emissions in 2021. Shares of papers per sector were similar to, or slightly greater than the share of emissions across all sectors with the exception of industry, which accounted for 23% of global GHG emissions, but only 8% of scientific attention, and 13% of implemented policies. This stark difference suggests that scientific attention and policies targeting industry are falling short of the importance of the industry sector in terms of emissions.

Blue dots show the share of total emissions in each sector. Orange dots show the share of total papers which address each sector. Green dots show the share of total policies which address each sector.
In contrast, the buildings and transport sectors are notable in that their policy and scientific attention outweighs their contribution to emissions (Fig. 7). However, despite the relatively small contribution of these sectors in terms of emissions (compared to the attention they receive) there has been limited progress in reducing emissions in these sectors as compared to the power sector4. The increased policy and scientific attention could therefore be evidence of attempts to redress the lack of progress.
In Supplementary Fig. 6, we plot the share of papers on each sector in each country against the share of emissions in each sector and each country. We find that for all sectors but waste, there is a significant positive relationship (dashed line) between a country’s share of emissions in the sector, and the share of scientific papers addressing that sector. However, in each case the distribution is far from proportional (solid line), and there is substantial variation between countries. For example, 34% (5GT CO2) of China’s total emissions in 2021 came from the industry sector, but only 14% (748) of the studies addressed this sector. On the other hand, transport only accounted for 7% of Chinese emissions, but 17% of the studies focus on it. In contrast, the transport sector is understudied in the US, with 24% of publications compared to 29% of emissions.
Finally, we explore how the literature covers policies enacted or envisioned across governance levels (Supplementary Fig. 3). The largest number of studies (44,138) looks at policies at the national level, rather than at the sub-national (10,811) or supra/international (41,138) levels. This is a relatively new development, as supra/international policies were the focus of the highest share of studies before 2010 (excluding 6 years during the 90s when there were very few papers published). Since 2000, the share of papers looking at national and sub-national policies has been increasing, from 40% and 5% respectively in 2000, to 51% and 13% in 2022. This may suggests an increasing focus on implementation details, or also the increasing recognition of multi-level governance issues35. Papers on sub-national and national policies more often address economic, regulatory, and information instruments than papers on supranational and international policies, which more often address governance and agreements.
Discussion
In this study, we use machine-learning to systematically map the literature on climate policy instruments. Just as in the broader climate literature, as well as in science more generally14,36, we find a vast and fast-growing scientific literature of 84,990 publications. Assessing this literature, or even subsets of this literature, systematically and comprehensively is challenged by its scale. We argue that systematic mapping, especially computer-assisted systematic mapping, has to play a growing role in the scientific process to help researchers, policymakers, and assessment processes keep abreast with the scientific evidence at reasonable costs. Successes in further automating these processes towards living maps, which could maintain a comprehensive picture of the available literature as it is produced, would increase the utility of mapping efforts even further18.
Automation of the kind in this computer-assisted map allows literature to be surveyed at scales that would otherwise be impossible, but it also brings in additional uncertainties. All of our classifiers produce erroneous predictions to non-trivial extents, and struggle increasingly with the granular classification of policy instrument types where we have few labelled examples. Future research may build on these foundations, through the use of a combination of more powerful machine-learning models, training techniques adapted for sparse training data, or additional labelled examples. The extent to which our models are wrong is well quantified, and the adjustment of probability thresholds offers an opportunity to trade off different types of model errors – false positives and false negatives – against each other when these models are used in practice, according to the needs of the specific use case.
Further, though our working definition of the climate policy literature provides clarity on system boundaries, it means that our literature map does not comprise all literature on policies that could have a beneficial effect in mitigating climate change, such as energy policies that do not explicitly mention climate. This may in turn affect our results on the distribution of studies (across sectors, countries, and instrument types), if there are differences in the extent to which climate mitigation is an explicit focus of policymaking in climate-relevant policies across these categories. Moreover, within the confines of our system boundaries, we may miss studies that are not indexed in OpenAlex, and we will miss, or mislabel, studies that receive erroneous predictions from our models. Because we only screened, coded, and applied our machine learning models based on the titles and abstracts of studies, we may also miss studies that address climate policies, or specific aspects of climate policy, within the main text of the paper, without mentioning these in the title or abstract.
In addition, there is a risk that our findings are affected by our search strategy being in English. While English is the international language of much peer-reviewed scientific literature, and where papers are written in languages other than English they are often indexed with English abstracts, it has been shown that extending searches beyond English can increase global coverage of evidence synthesis projects37. We should therefore assume that our coverage in non-anglophone countries is lower than in anglophone countries. Extending searches into languages other than English is at present difficult to implement, and beyond the scope of this project, but advances in multilingual NLP approaches may make this tractable in the future. Further, in Supplementary Fig. 10, we show the distribution of content types in our database; it is likely that the inclusion of posted-content (preprints, 12% of studies) makes our database slightly more focussed on North American and on Economic Instruments. Beyond distinguishing between studies of different kinds, because of the scale of the analysis, it is not possible to assess the quality of the studies, except through imperfect metrics such as number of citations and impact factor. However, we refrain from using these due to concerns that this would introduce more biases.
Despite these limitations, the map is close to as comprehensive as we believe is currently feasible, and we do not have reasons to fear that omissions or differences in article quality are systematic, such that our main conclusions about the distribution of climate policy research, and how this relates to the sectoral and geographical distribution of policies and emissions would be substantially affected. These conclusions can help to inform discussions both on what climate policy literature should be investigating, or on what policy instruments policymakers should be implementing. For example, economic instruments are more widely studied than actually applied in climate policy, while regulatory instruments are widely used in climate policy but less frequently studied. In this way, and by linking these two datasets with outcomes on emissions reductions, our research can shed light on important potential research gaps, in terms of understudied success stories, cases where policies have not been sufficient to reduce emissions, as well as sectors – such as the industry sector – which have received little attention in science and policy despite their sizeable emissions footprints.
Future work may explore the links between emissions, policies, and the scientific literature further, for example by using other measures of policy stringency, or by exploring sectoral and temporal dynamics, or variation across abatement costs. Matching studies to individual policies could help to explore the extent to which different types of enacted policies are evaluated, helping to identify gaps in the primary literature.
Ultimately, evidence-based decision-making should be informed not only by individual primary studies but by high quality systematic reviews38. A search for evidence synthesis keywords in our database (“systematic map” OR “systematic review” OR “meta-analysis”) provides some suggestive evidence that there may be a substantial evidence synthesis gap39 in the climate policy instruments literature. We find that 0.33% (281) of our 84,990 papers match an evidence synthesis keyword in the title or abstract. This proportion is an order of magnitude lower than the 3% identified in the domain of climate and health12. Filling this evidence synthesis gap will support the IPCC and other climate assessments3, and enhance policy learning.
We make our map available as a community resource in interactive and searchable form at https://climateliterature.org/#/project/policymap. We aim to enhance the value of this resource by automating the process of updates, making it a living systematic map18. Over time, we aim to incorporate additional categories where classifiers can be developed. This online map could serve as a useful resource for IPCC authors or policymakers as well as a starting point for consolidated efforts to close the evidence synthesis gap through systematic reviews, or ecosystems of interconnected systematic reviews and meta-analyses across the broad spectrum of combinations of policy instruments, sectors, and outcomes. Providing such systematic and comprehensive assessments of climate solutions is vital given the urgency of increasing climate policy ambition and closing the implementation gap.
Methods
We apply supervised machine learning to scale up a systematic map, following a pre-registered protocol40. After retrieving documents likely to be relevant to climate change, we screen and code 2580 papers by hand. We train machine learning models to reproduce the screening and coding decisions and estimate the performance of these models using cross-validation. We then describe the distribution of papers on climate policy instruments, comparing this to the distribution of enacted policies and of emissions. The following sections describe each of the aforementioned steps in detail.
Literature retrieval
We started by querying the publication database Web Of Science Core Collection, using a Query adapted from ref. 24 to include specific climate policies such as carbon pricing, which are unambiguously related to climate change. Due to access constraints, we were not able to update our search using Web of Science, so our final query was conducted using the open source database OpenAlex. Our final query returned 1,026,371 documents in February 2023.
Defining climate policy instruments
Defining a climate policy instrument is non-trivial because emissions can be influenced by a wide range of policies, many of which might also be enacted for other reasons. A minimally inclusive approach would be to include policies that are explicitly motivated by climate change. However, this would miss a large number of relevant policies that may not explicitly mention climate change, but do help states or municipalities to reach mitigation targets.
A maximally inclusive approach would be to include all policies that could conceivably have an effect on emissions. However, this is not without its difficulties. Legislation that provides public transport infrastructure certainly meets the condition of conceivably having an effect on emissions. But while the rationale for considering legislation from the last three decades to provide public transport infrastructure is clear, this position becomes less tenable as we go back further in time. Public transport infrastructure has many other benefits than reducing emissions caused by motorised private car transport, and has been provided since long before climate change was an objective for decision makers.
This becomes even more complex as we consider the full range of policies which may be able to affect emissions. For example, scholars from ecological economics have argued that alternative policy goals such as redistributing income41, or reducing working time42 can contribute to mitigating climate change (or even are necessary to meet ambitious climate goals). Should we then consider all legislation which redistributes income via the tax system31, or which restricts working time as climate policy instruments? Given the close links between emissions and economic activity43, one could argue that large parts of economic and public law is climate-change relevant. Indeed, non-climate lockdown policies, observed during the COVID-19 pandemic, have precipitated the sharpest fall yet observed in global fossil fuel emissions44.
Trying to include all policies which might affect emissions quickly becomes intractable. It is true that to achieve net-zero, climate change will need to be tackled as a cross-cutting concern across government departments and sectors45, rather than as a single issue to be addressed with its own policies. However, while viewing all policy as climate policy may be a helpful frame to encourage the mainstreaming of climate change across policymaking, such an expansive definition offers insufficient focus in our attempt to analyse the literature on climate policies.
We therefore employ a hybrid approach that takes into account the policy itself, as well as the focus of the paper. Some policies, such as subsidies for public transport use, may be enacted for a variety of reasons (e.g. to reduce road traffic congestion, to improve air local air quality, or to enable greater mobility). Other policies may have additional benefits other than reducing emissions, but are unambiguously motivated by the desire to reduce emissions (or in the case of CDR to reduce GHG concentrations). This is the case when they directly target emissions or withdrawals, for example with a carbon tax, or emissions standard. Studies which mention policies in the latter category are included regardless of the content of the title and abstract. Studies in the former category are included only when the title or abstract makes reference to climate change or GHG emissions, withdrawals or concentrations.
In our scheme therefore, a policy becomes a climate policy when a study analyses it in the context of climate change and GHG emissions. In other words, legislation that funded a public transport network at the start of the 20th Century would be seen as a climate policy in the context of a study analysing the effects of that transport network on emissions. While this makes the system boundaries clear, it does mean that we miss studies that would be relevant to fully understanding climate policies. For example, a paper analysing the emissions effects of a public transport subsidy would be included. However, another study analysing public perceptions of that same policy (without mentioning climate change) would not be included, though this may be useful to analysts looking to study the feasibility of this measure as a lever to mitigate emissions. This means that we do not have the full literature on all policies which may affect emissions (which we refer to as the climate mitigation relevant policy literature). Rather, we focus on the explicit climate mitigation policy literature.
Screening and coding
We proceeded to manually screen and code 2580 documents by hand, judging, for each document the following categories:
-
1.
whether it was about climate change,
-
2.
whether it addressed mitigation,
-
3.
whether it addressed policies
-
4.
what policy instrument types the document describes, at each level of our typology (Fig. 1)
-
5.
what sectors the policy or policies apply to, according to the typology used by the IPCC
-
6.
the governance level of the polices (sub-national, national, supranational)
-
7.
whether the analysis was ex-post or ex-ante
-
8.
whether the analysis was qualitative or quantitative
-
9.
which countries were mentioned (resolving sub-national entities to the country containing them)
The first three questions were concatenated into a single measure of relevance, which took the value of 1, if all three questions were answered with yes.
The initial two batches of documents were screened and coded using the NACSOS platform46 at the title and abstract level by the whole author team. Differences in opinion were discussed in plenum. Once common agreement had been found around definitions and the coding scheme, we proceeded to double-code the remaining documents. After reviewing each batch of documents, the coding pair discussed and resolved all coding inconsistencies bilaterally, before reporting on any issues that came up, and raising any labels that could not be resolved, in a weekly meeting with the entire coding team and the lead author. Supplementary Table 1 shows the intercoder agreement scores for each category.
Batches of documents were double coded, with all disagreements resolved in a further discussion (if necessary involving a third opinion). Inter-coder agreement for high-level categories ranged from 0.38 for the evidence category ex-ante to 0.8 for the sector category buildings (Supplementary Table 1). Batches were either drawn at random from the whole query, or selected using a machine learning algorithm trained to return relevant documents. Overall, 2580 documents were screened and annotated by hand.
Machine learning assistance
We trained machine learning models to reproduce the coding decisions described above. Specifically, we investigated a variety of transformer-based language models47, which are pre-trained with a masked language model objective (in which models must predict missing words from the surrounding words in text sequences) on very large text corpora to learn useful representations of texts. These can be fine-tuned on a dataset of texts and labels – in this case the titles and abstracts of the documents, and the labels we assigned during manual coding – in order to predict the likely labels for a set of unlabelled texts. In addition to our base model distilroberta26,48, which works much like the original BERT model47, but is optimised and reduced to a more compact form, we assess two models which incorporate additional pre-training before the fine-tuning step.
ClimateBert17, which is based on distilroberta, received additional pre-training49 on a corpus of climate change related texts. This additional domain adaptation may increase its ability to perform tasks related to climate-related texts. SciNCL27 is pre-trained on a large corpus of scientific texts and uses the corpus’ citation network to inform its text representations via contrastive learning.
For each model, modellers must set hyperparameters – or settings which describe how a model is trained – which can influence the performance of the model. The optimal set of hyperparameter settings is not known for any given dataset, so we therefore optimize the hyperparameters within a given search space (Table 2) using an algorithmic approach50.
We use nested cross-validation51 to estimate the performance of our model – and its hyperparameter optimisation procedure – on unseen data. To do this, we split our labelled dataset into 3 outer test/outer train splits. Iterating through each of these, we split the outer train split into 3 inner validation/inner train splits. We then optimise the hyperparameters, selecting the set of hyperparameters that achieves the best F1 score on average when the model is trained on the inner train split, and validated on the inner validation split. This set of best parameters is then used to train the model on the outer training set, and this model is then evaluated on the outer test set. After iterating through all outer and inner splits, we are left with 3 performance estimates of the model and hyperparameter selection process. We repeat this process for each model, and each classification objective, and report the mean and standard deviation of the F1 scores (the harmonic mean of precision and recall).
To select the final model used for making predictions, we repeat the process from the inner loop on the outer loop. That is, we select the set of hyperparameters that achieves the highest average performance across each of the 3 outer train/test splits, and use these settings to train a model using the whole dataset. This set of hyperparameters does not necessarily equal any of the sets of hyperparameters that have been evaluated in the preceeding step, as its purpose is not to evaluate any particular set of hyperparameters, but rather to evaluate the hyperparameter-setting procedure.
Because a small proportion of documents in the dataset were relevant to climate policy, selecting documents for manual screening and coding by hand would have left us with few relevant documents, and few examples of specific categories of climate policies. We therefore alternated between coding batches of documents drawn at random, and batches of documents predicted by a machine learning model (trained on the subset of available data) to be relevant. For efficiency’s sake, these predictions were made by a simple support vector machine model trained on term frequency inverse document frequency representations of texts52.
When training on the relevance objective, we consider only those labelled documents for validation that were randomly selected for screening. This ensures that the estimation of our model performance is not biased by the fact that the data it is evaluated on is not representative of the data it is used to make predictions on. When training on subsequent objectives, all irrelevant documents are removed from the dataset, and documents selected both at random and from the set of predicted relevant documents are used in testing and validation. As the predictions for these classifiers are only made on those documents predicted to be relevant in the first instance, the documents used for testing are broadly representative of the documents the model makes predictions on.
After the initial collection of data from Web of Science at the start of the project, updating the search using Web of Science was not possible due to technical and access constraints, so the search was repeated using the open source scholarly database Open Alex, the successor of Microsoft Academic Graph. After merging this dataset with the initial dataset, keeping only those documents that were in both, the models were used to make predictions on all documents that had not yet been seen.
Geoparsing
In addition to the predictions made by our fine-tuned transformer models, we used a pre-trained geoparser53 to extract locations from the studies and resolve these to the country containing them. In addition, we compiled a dictionary of country adjectives to identify documents that mentioned countries indirectly, for example by talking about the German climate law, without mentioning a place in Germany or Germany itself. In addition, we removed all mentions of the Montreal protocol, the Paris agreement, the London protocol, and the Kyoto Protocol, using regular expressions.
Emissions trends
Following ref. 4, we calculate a linear model on log emissions over the 10 years to 2021. The coefficient represents the annual change in emissions expressed as a percentage.
Policy database sensitivity
To explore the extent to which results are sensitive to the choice of policy database, we repeat our analysis with each database on its own, as well is with the set of combined policies. Though there was some small variation, the overall picture remained similar (Supplementary Fig. S11).
Query
((CO2 OR “carbon dioxide” OR methane OR CH4 OR “carbon cycle” OR “carbon cycles” OR “carbon cycling” OR “carbon budget” OR “carbon budgets” OR “carbon flux” OR “carbon fluxes” OR “carbon mitigation”) AND (climat*)) OR ((“carbon cycle” OR “carbon cycles” OR “carbon cycling” OR “carbon budget” OR “carbon budgets” OR “carbon flux” OR “carbon fluxes” OR “carbon mitigation”) AND (atmospher*)) OR
(“carbon emission” OR “carbon emissions” OR “sequestration of carbon” OR “sequestered carbon” OR “sequestering carbon” OR “sequestration of CO2″ OR “sequestered CO2″ OR “sequestering CO2″ OR “carbon tax” OR “carbon taxes” OR “CO2 abatement” OR “CO2 capture” OR “CO2 storage” OR “CO2 sequestration” OR “CO2 sink” OR “CO2 sinks” OR “anthropogenic carbon” OR “capture of carbon dioxide” OR “capture of CO2″ OR “climate variability” OR “climatic variability” OR “climate dynamics” OR “change in climate” OR “change in climatic” OR “climate proxies” OR “climate proxy” OR “climate sensitivity” OR “climate shift” OR “climatic shift” OR “coupled ocean-climate” OR “early climate” OR “future climate” OR “past climate” OR “shifting climate” OR “shifting climatic” OR “shift in climate” OR “shift in climatic”) OR
(“atmospheric carbon dioxide” OR “atmospheric CH4″ OR “atmospheric CO2″ OR “atmospheric methane” OR “atmospheric N2O” OR “atmospheric nitrous oxide” OR “carbon dioxide emission” “carbon dioxide emissions” OR “carbon sink” OR “carbon sinks” OR “CH4 emission” OR “CH4 emissions” OR “climate policies” OR “climate policy” OR “CO2 emissions” OR “CO2 emission” OR dendroclimatology OR dendroclimatological OR (“emission of carbon dioxide” NOT nanotube*) OR (“emissions of carbon dioxide” NOT nanotube*) OR “emission of CH4″ OR “emissions of CH4″ OR “emission of CO2″ OR “emissions of CO2″ OR “emission of methane” OR “emissions of methane” OR “emission of N2O” OR “emissions of N20″ OR “emission of nitrous oxide” OR “emissions of nitrous oxide” OR “historical climate” OR “historical climatic” OR IPCC OR “Intergovernmental Panel on Climate Change” OR “methane emission” OR “methane emissions” OR “N2O emission” OR “N20 emissions” OR “nitrous oxide emission” OR “nitrous oxide emissions”) OR
(“climate change” OR “climatic change” OR “climate changes” OR “climatic changes” OR “global warming” OR “greenhouse effect” OR “greenhouse gas” OR “greenhouse gases” OR “Kyoto Protocol” OR “warming climate” OR “warming climatic” OR “cap and trade” OR “carbon capture” OR “carbon footprint” OR “carbon footprints” OR “carbon neutral” OR “carbon neutrality” OR “carbon offset” OR “carbon sequestration” OR “carbon storage” OR “carbon trading” OR “carbon trade” OR “changing climate” OR “changing climatic” OR “climate warming” OR “climatic warming”).


Responses