Machine learning prediction of ammonia nitrogen adsorption on biochar with model evaluation and optimization

Introduction
Nitrogen is an essential nutrient for plant growth and development, yet it may be introduced into aquatic environments through agricultural soils, livestock wastewater, urban leachate, and numerous industrial sectors such as fertilizer production, food processing, rubber, textiles, oil refining, and paper manufacturing1,2. Ammonia nitrogen (NH₄⁺-N) represents one of the primary forms of nitrogen in aquatic systems, constituting the majority of soluble nitrogen in wastewater and serving as a key contributor to eutrophication3,4. It has been reported that NH₄⁺-N concentrations as low as 3 mg/L can exert toxic effects on certain fish species5. Thus, the prompt removal of ammonia nitrogen from water bodies is critical for maintaining a healthy aquatic ecosystem4. Presently, the common methods employed for the removal of NH₄⁺-N include biological processes, ion exchange, electrochemical treatment, chemical precipitation, breakpoint chlorination, and adsorption3,5,6. Among these, adsorption is highly regarded and extensively applied in water treatment technologies due to its simplicity, cost-effectiveness, and the absence of secondary pollution4,7,8,9,10.
Currently, various adsorbents have been extensively studied for the removal of NH₄⁺-N, including zeolites, bentonite, polymeric clays, biochar, and activated carbon5,10,11,12. Biochar, in particular, has attracted significant attention due to its large specific surface area, well-developed pore structure, high carbon content, abundant oxygen functional groups, and high cation exchange capacity13,14,15. Additionally, biochar as an adsorbent not only offers favorable cost-effectiveness but can also be applied to soil as a fertilizer after NH₄⁺-N adsorption, thereby achieving resource recycling15,16. Recent studies have demonstrated that the adsorption of NH₄⁺-N by biochar primarily involves physical mechanisms (physical adsorption, electrostatic attraction, and ion exchange) as well as chemical mechanisms (chemical adsorption, surface complexation, and surface precipitation)5,8,17,18. Consequently, the adsorption performance of biochar towards NH₄⁺-N is significantly influenced by its physical and chemical properties, as well as experimental conditions19,20. However, traditional batch adsorption experiments are labor-intensive, time-consuming, and costly, presenting significant challenges to elucidating the complex interrelationships and influencing factors governing adsorption performance21,22,23. Therefore, there is an urgent need to establish comprehensive predictive models to clarify the independent contributions of various factors and enhance understanding of the adsorption capacity of biochar for NH₄⁺-N.
Machine Learning (ML) is a technology that learns patterns from data automatically through algorithms and makes predictions or decisions based on these patterns24. Recent studies have employed ML to model and predict the removal of NH₄⁺-N by adsorbents25,26,27,28,29. For instance, Yolcu et al.27 proposed a hybrid predictive model combining response surface methodology (RSM) with feedforward neural networks and Elman recurrent neural networks to predict the efficiency of zeolite adsorption of NH₄⁺-N from landfill leachate, achieving an accuracy of 95%. Additionally, artificial neural networks (ANN) have been used to model NH₄⁺-N removal by waste foundry sand, with results indicating high prediction accuracy, as reflected by a correlation coefficient exceeding 0.9825. Similarly, Ohale et al.28 employed ANN and an adaptive neuro-fuzzy inference system (ANFIS) to optimize and predict the adsorption efficiency of NH₄⁺-N from abattoir wastewater using iron-functionalized crab shells, with the ANFIS model (R² = 0.9998) demonstrating superior predictive performance compared to other models. Moreover, a recent study explored the combination of RSM and ANN to optimize NH₄⁺-N removal from cattle manure under microwave irradiation, revealing that the RSM-ANN model exhibited higher accuracy in predicting and estimating NH₄⁺-N removal efficiency compared to the standalone RSM model26.
Although ML has been employed to predict NH₄⁺-N removal from wastewater using various adsorbents, several challenges remain: (1) studies specifically focusing on the adsorption performance of biochar towards NH₄⁺-N using ML are still limited24; (2) the heterogeneity of biochar properties and their complex interactions with NH₄⁺-N introduce unique modeling challenges that have yet to be fully addressed; (3) the relationships between the physical properties, chemical characteristics, and adsorption conditions of biochar with its equilibrium adsorption capacity need more comprehensive exploration; (4) datasets are often of limited scale, lacking sufficient features and modeling support, generally encompassing only experimental conditions25,26,27. Therefore, this study aims to utilize the physical and chemical properties of biochar, along with experimental conditions, as inputs to estimate the equilibrium adsorption capacity of NH₄⁺-N onto biochar. The objectives of this study are: (1) to apply appropriate data processing methods for analyzing data collected from relevant published studies; (2) to compare and select suitable ML models for predicting the adsorption performance of biochar towards NH₄⁺-N (The reasons for selecting these models have been listed in Supplementary Note 1); (3) to elucidate the influence of key feature variables on adsorption capacity; and (4) to develop a Python-based application integrating the selected model to evaluate the adsorption performance of biochar.
Methods
Data collection
The data for this study were collected from published literature available in the Web of Science, Google Scholar, and Scopus databases (2014–2024). The search terms used were: “TS: [Biochar AND NH₄⁺-N AND (Adsor* OR Remov*)]”. Following the preliminary screening, 417 sets of adsorption data were gathered, representing 46 distinct biochar types (Data availability section). It is important to note that, compared to some previous studies, the amount of data collected in this research is sufficient for ML applications30,31,32,33. The parameters were divided into three categories: chemical properties of the biomass, physical properties of the biochar, and experimental conditions. The chemical properties of the biomass included carbon content (C, wt.%), the molar ratio of oxygen and nitrogen to carbon [(O + N)/C], the molar ratio of hydrogen to carbon (H/C), the molar ratio of oxygen to carbon (O/C), and ash content (Ash, %). The physical properties of the biochar comprised specific surface area (SSA, m²/g), total pore volume (V, cm³/g), and the pH of the biochar (pH_bio). The experimental conditions were experimental temperature (Temp, °C), the pH of the solution (pH), and the ratio of the initial concentration of NH₄⁺-N to the dosage of biochar (C₀, mg/g). It is worth noting that all data collected in this study were free of bias. The methodology employed for collecting data can be referenced in a previously published work19.
Data preprocessing
The proportion of missing values, which has not been reported in previous literature, was found to be 2.88% (pH_bio, BET, V). To address these missing values, the K-Nearest Neighbors (KNN) algorithm was employed for imputation19,34,35,36. By utilizing the most similar neighboring samples to fill in the gaps, the KNN algorithm effectively preserves the intrinsic structure and similarity of the data, avoiding the distortions that may arise from the simple mean or median imputation37. Before conducting ML, it is often necessary to enhance the normality of the data and stabilize variance, allowing the model to fit the data better and improve predictive accuracy32. In this study, normality was assessed based on the skewness and kurtosis of the data, and the Box-Cox transformation was applied to improve the model’s normality38. The Box-Cox transformation is a statistical method that converts data to a distribution closer to normality, aiming to reduce skewness and thereby enhance the performance of ML models38,39. The formula for the Box-Cox transformation (BCT) is as follows38:
Where x represents the original data, BCT (x) denotes the transformed data, and λ is a parameter determined through maximum likelihood estimation.
To mitigate the impact of multicollinearity among features on the ML model, this study employed Pearson correlation coefficients (PCC) to examine the relationships between variables40. Moreover, to ensure that features are on comparable scales and to prevent features with larger magnitudes from dominating the training process, Z-score normalization was applied to the data before model training41. Compared to other normalization techniques, Z-score normalization effectively addresses disparities in feature magnitudes, reducing the model’s sensitivity to these differences and enhancing its robustness and accuracy42.
Machine learning model construction
This study systematically compared 12 different ML models, encompassing six tree-based ensemble models, three kernel-based models, and three deep-learning models. The specific models included: Random Forest (RF), Gradient Boosting Decision Trees (GBDT), Extreme Gradient Boosting (XGBoost), Light Gradient Boosting Machine (LightGBM), Categorical Boosting (CatBoost), Extremely Randomized Trees (ET), Support Vector Machines (SVM), Kernel Ridge Regression (KRR), Gaussian Process Regression (GPR), Multilayer Perceptron (MLP), Convolutional Neural Networks (CNN), and Long Short-Term Memory (LSTM). One of the objectives of this study was to evaluate the effectiveness of these models in predicting the adsorption performance of NH₄⁺-N on biochar. It should be noted that RF, GBDT, XGBoost, LightGBM, CatBoost, and ET are classified as tree-based ensemble models, while SVM, KRR, and GPR fall under kernel-based ML models. In contrast, MLP, CNN, and LSTM are categorized as deep learning models. The theoretical underpinnings of these algorithms are provided in Supplementary Table 1.
The dataset was split into a training set and a test set in an 8:2 ratio. Bayesian optimization combined with 5-fold cross-validation was employed to determine the optimal hyperparameters for each model43. Compared to conventional methods such as grid search and random search, bayesian optimization offers a more intelligent approach to finding the optimal hyperparameters while reducing computational costs44. This advantage is particularly notable in high-dimensional or computationally expensive search spaces. The hyperparameters and their respective ranges used in this study are detailed in Supplementary Table 1. It is worth noting that the selection of hyperparameters was based on previous studies, preliminary results, and the specific characteristics of the data in this study. Efforts were made to maintain consistency in the range of selected hyperparameters wherever possible. Additionally, to ensure model stability and avoid the impact of dataset partitioning on the model, a 5-fold cross-validation method was implemented after identifying the optimal hyperparameters, and model performance was thoroughly evaluated across 50 randomly generated training and test sets (resulting in 250 data points). The model performance was assessed using root mean square error (RMSE) and the coefficient of determination (R²) on both the training and test sets, with the formulas for RMSE and R² provided in Eqs. (2) and (3), respectively22.
Where yi and xi denote the predicted and experimental values, respectively; (bar{{y}_{i}}) represents the average of the experimental values, and n is the number of samples.
Model interpretation
Feature importance and partial dependence are critical for enhancing the interpretability of ML models, facilitating a deeper understanding of the model’s decision-making process and thereby improving its credibility and reliability45. In this study, Embedded Feature Importance (EFI) and Shapley Additive Explanations (SHAP) were employed for comprehensive analysis19,32. SHAP values quantify the average impact of each feature on the model’s predictions and explicitly outline the contribution of individual feature values to specific predictions46. It has been reported that SHAP is based on game theory, with its mathematical formulation shown in Eq. (4) 47,48. This is particularly important for explaining the dynamics of complex tree-based models and identifying key features. Additionally, partial dependence plots (PDPs) were used to illustrate the influence of critical features on adsorption capacity22,49. PDPs reveal the relationship between feature values and model predictions by creating copies of the dataset for each value of the selected feature, allowing the model to generate predictions and compute the average predicted values, as shown in Eq. (5)49,50.
Where ({varnothing }_{i}) is the SHAP value for feature i; N represents the set of all features; S is a subset of features not including I; f(S) represents the model output given the subset S.
Where ({hat{f}}_{{PDP}}({x}_{j})) is the partial dependence function for feature xj; (f({x}_{j},{x}_{-j}^{left(iright)})) represents the model prediction given feature xj and the other features x-j; n is the number of data points, and the average is taken over the marginal distribution of the other features x-j.
Results and discussion
Description of datasets
As illustrated in Table 1, the dataset describing NH₄⁺-N adsorption by biochar shows substantial variability across several variables, as indicated by their standard deviations and the range between minimum and maximum values. For instance, the BET surface area demonstrates considerable variability, ranging from 0.41 to 185 m²/g, highlighting the heterogeneity of biochar samples, which may be attributed to different feedstocks or processing conditions51. The median values for variables such as C, H/C, O/C, (O + N)/C and pH_bio are close to their mean values, suggesting a symmetric distribution centered around the mean. However, variables like V exhibit a noticeable difference between the mean (0.2519) and median (0.0078), indicating a skew in the data.
Skewness is used to assess the symmetry of a data distribution, reflecting both the direction and degree of its asymmetry52. Similarly, kurtosis describes the degree of peakedness or the thickness of the tails in the distribution52. After applying the Box-Cox transformation (BCT), the skewness for most variables has been significantly reduced, bringing their distributions closer to normality. For example, the skewness of C decreased from −2.03 to −0.9, indicating an improved, more symmetric distribution. Reducing skewness is crucial for subsequent statistical analyses, as it ensures more reliable and unbiased modeling. Kurtosis values provide insight into the shape of the data distribution, especially regarding tail heaviness and outliers53. Initially, the kurtosis for Ash content is 3.80, suggesting a distribution with heavier tails and potential outliers. Following the BCT, the kurtosis reduces to −0.75, indicating a more platykurtic distribution, which is desirable for analysis. Similarly, the BET surface area shows a reduction in kurtosis from 2.71 to −1.22, which implies fewer extreme values and a more balanced dataset for analysis. Overall, the application of the BCT has effectively reduced both skewness and kurtosis across the dataset, making the variables more suitable for detailed statistical analysis and predictive modeling.
Pearson correlation coefficient analysis
To mitigate the impact of collinearity among the various features on ML outcomes, this study conducted a PCC analysis to eliminate highly collinear variables54. Figure 1 and Supplementary Fig. 1 presents the PCC analysis, delineating the critical interactions between several input features and the target value of equilibrium adsorption capacity (Q). Notably, some features demonstrate significant correlations with Q. For example, the initial concentration (C₀) exhibits a strong positive correlation of 0.58 with Q, indicating that higher initial concentrations can enhance adsorption capacity. This effect can be attributed to the more significant concentration gradient, which promotes a higher driving force for mass transfer, thereby increasing the rate and extent of adsorption55. Additionally, the molar ratio of hydrogen to carbon (H/C) shows a weak negative correlation with Q (−0.13), which implies that a higher H/C ratio may slightly reduce the adsorption capacity. A more detailed discussion will be provided in Section (Partial dependence plots (PDP) analysis).

Pearson correlation coefficients between input features and the target adsorption capacity (Q).
Based on previous research, acorrelation coefficient threshold of |r | > 0.7 between variables is considered an appropriate indicator of when collinearity begins to distort model estimation and subsequent predictions52 significantly. Notably, the O/C and (O + N)/C ratios exhibit a strong correlation (0.94), possibly because the nitrogen content in the collected biochar data is relatively low, resulting in a minimal impact on the ratio. This strong correlation suggests that these features could lead to collinearity issues. With O/C having a more significant influence on Q compared to (O + N)/C, (O + N)/C was removed prior to ML to mitigate the adverse effects of collinearity.
Performance evaluation of machine learning models
Figure 2 presents the scatter plots and data distributions for the experimental and predicted adsorption capacities across 12 different ML models. Parameter optimization was executed using Bayesian optimization, and the optimal parameters are listed in Supplementary Table 1. The RMSE and R² values for training and test sets for each model are shown. From Fig. 2, it is evident that all models exhibit relatively consistent performance between the training and test sets, with no significant signs of overfitting. This indicates that the models possess strong generalization capabilities for predicting adsorption performance. Among these models, CatBoost (Fig. 2e) stands out with exceptional performance, achieving an RMSE of 0.3617 on the training and 0.5378 on the test set. Additionally, its R² value for the test set reaches 0.9329, underscoring its superiority in predictive accuracy and model robustness. In contrast, other models perform slightly less well. For instance, LightGBM (Fig. 2d) and GBDT (Fig. 2b) have test set RMSE values of 0.5965 and 0.5599, respectively, which, although commendable, fall short of CatBoost in terms of precision.

a RF, b GBDT, c XGBoost, d LightGBM, e CatBoost, f ET, g SVM, h KRR, i GPR, j MLP, k CNN, l LSTM.
The ensemble learning models, as a whole, demonstrate robust predictive performance, particularly CatBoost, LightGBM, and GBDT, which show close RMSE and R² values between the training and test sets, highlighting their consistency and generalization ability. Notably, CatBoost not only yields the lowest RMSE on the test set but also achieves a high R² value, indicating its remarkable capability in handling the complexity of the data. This superior performance can likely be attributed to CatBoost’s unique mechanism for handling missing values and categorical features, allowing it to more effectively extract features in high-dimensional, complex datasets56. Furthermore, CatBoost employs a symmetric tree structure and a gradient-based balancing mechanism during training, which helps mitigate overfitting and enhances the model’s robustness and generalization57.
In contrast, deep learning models (such as CNN and LSTM) perform poorly on this task. For example, LSTM (Fig. 2l) records an RMSE of 1.8082 and an R² value of only 0.2410 on the test set, indicating insufficient capability in capturing the data patterns. This may be because deep learning models typically excel with larger datasets, where their nonlinear mapping abilities are more pronounced, but underperform with smaller datasets and limited feature tasks58. Similarly, CNN (Fig. 2k) follows this trend, with a test set RMSE of 1.5422 and a relatively low R² value, further reinforcing the limited applicability of deep learning models for this type of task. Traditional models like KRR (Fig. 2h) and SVM (Fig. 2g) also exhibit commendable stability, but their overall performance remains somewhat inferior to that of ensemble learning models, particularly in terms of the test set RMSE and R² values. This discrepancy may be because single kernel functions often struggle to capture the complex nonlinear relationships in more intricate datasets59. By contrast, ensemble learning models, especially tree-based methods, can automatically adapt to the feature distribution and nonlinear relationships within the data without the need for manually specified feature transformations or kernel functions60.
To evaluate the stability of the ML models, this study conducted stability tests across various models. The resulting data have been uploaded to GitHub for reference (Data availability section). Figure 3 illustrates the stability assessment outcomes for the 12 ML models, showcasing CatBoost’s superior performance across several metrics. Throughout both the training and test phases, the CatBoost model consistently exhibited low RMSE (Fig. 3a, b) and low MSE (Fig. 3c, d), as well as the highest R² values (Fig. 3e, f), demonstrating its exceptional fitting capability and predictive accuracy. Among all models, CatBoost displayed consistently low errors and high precision on the test set, outperforming most other models such as RF, GBDT, XGBoost, and LightGBM. In contrast, deep learning models like LSTM and CNN exhibited greater instability, particularly regarding RMSE and MSE on the test set (Fig. 3b, d), failing to maintain their strong performance from the training set. Notably, LSTM’s performance on the test set was significantly inferior, potentially due to its complex reliance on input data features, which, in the context of this study’s dataset, could not fully exploit its advantages given the smaller sample size and limited feature set. CatBoost’s outstanding performance can be attributed to several built-in regularization mechanisms, such as L2 regularization, and its stochastic treatment of training data, both of which effectively prevent overfitting61. Moreover, CatBoost benefits from well-optimized default parameter settings, which yield stable results across a wide range of tasks. This feature further contributes to the model’s reliability and stability in terms of performance.
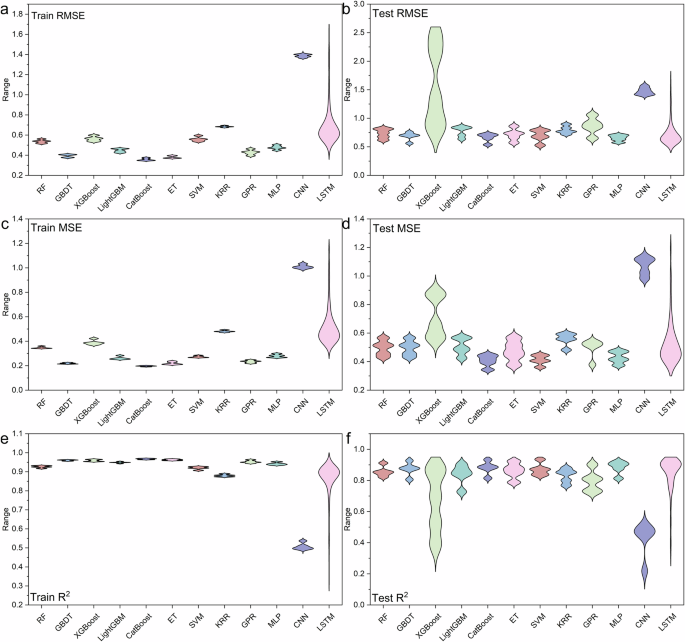
a Train RMSE, b Test RMSE, c Train MSE, d Test MSE, e Train R2, f Test R2.
Residuals are defined as the differences between actual and predicted values, and analyzing their distribution allows for an assessment of the model’s fit and predictive accuracy19. The residual analysis in Fig. 4 demonstrates that most models, such as RF, CatBoost, and GBDT, exhibit relatively symmetric residual distributions, indicating minimal bias and good predictive performance. The residuals for these models are centered around zero, with their kernel density curves approximating a normal distribution. Among them, the CatBoost model’s residuals are tightly clustered around zero, with the normal distribution of residuals demonstrating a sharp peak, indicating minimal bias and consistent performance. It can also be noted that a small number of data points exhibit larger errors at low concentrations, which may be due to limitations in model sensitivity or data variability at these lower levels. This suggests that CatBoost maintains a high degree of fit accuracy on both the training and test sets, thereby effectively mitigating the risk of overfitting. Moreover, the concentrated and normal distribution of the residuals further corroborates the reliability and robustness of the CatBoost model. However, certain models, particularly CNN and LSTM, show noticeable skewness in their residuals, with deviations from symmetry and bias evident in the test sets. This suggests systematic over- or under-predictions, highlighting the need for further optimization of these models or preprocessing adjustments to improve their accuracy and generalization. Therefore, based on the before-mentioned analysis and the findings illustrated in Fig. 4, CatBoost has been chosen as the suitable ML model for subsequent analyses.

a RF, b GBDT, c XGBoost, d LightGBM, e CatBoost, f ET, g SVM, h KRR, i GPR, j MLP, k CNN, l LSTM.
Model interpretation
This study used embedded feature importance (EFI) and Shapley additive explanations (SHAP) to analyze the factors affecting NH₄⁺-N adsorption in biochar. Figure 5a shows the EFI analysis, which quantifies the relative importance of different features in the ML model. The initial concentration of NH₄⁺-N to the dosage of biochar (C₀) is the most influential factor, followed by experimental temperature (Temp), carbon content of biochar (C), and total pore volume (V). These results indicate that experimental conditions, particularly C₀ and Temp, play a significant role in determining adsorption capacity. Regarding the adsorption process, the dominant role of C₀ is consistent with previous studies22,62. The likely reason is that the relative quantities of the adsorbate (NH₄⁺-N) and the adsorbent (biochar) play a critical role in the mass transfer process. Additionally, Temp significantly impacts the adsorption process in aqueous phases by affecting adsorption equilibrium, diffusion rates, solubility, adsorbent surface characteristics, and the adsorption enthalpy63. The pie chart inset in Fig. 5a demonstrates that experimental conditions account for the most significant contribution to NH₄⁺-N adsorption (67.2%), followed by the chemical properties of biochar (18.2%) and its physical properties (14.7%). This might be because experimental conditions directly affect the main forces and interactions involved in adsorption, such as electrostatic forces, hydrogen bonding, and Van der Waals forces.

a EFI analysis (b) SHAP value visualization.
The SHAP analysis in Fig. 5b provides further insights into how each feature influences the model output. SHAP values indicate the magnitude and direction of each feature’s impact on the prediction. The larger the SHAP value, the greater the positive impact of the feature on the prediction result; conversely, the smaller the SHAP value, the greater the negative impact. For example, C₀ and Temp have a strong positive influence on adsorption, as higher SHAP values are associated with higher feature values, suggesting enhanced adsorption capacity. The variability in SHAP values for features such as Ash content indicates nonlinear interactions, where adsorption behavior does not consistently increase or decrease with feature values. A more detailed discussion of the impact of each feature on NH₄⁺-N adsorption will be provided in the next section.
Partial dependence plots (PDP) analysis
Partial dependence plots (PDP) provide insights into the relationship between specific features and the prediction outcomes of ML models64. The gray lines in the plots represent actual model predictions, while the blue line indicates the fitted values. Figure 6a shows that the adsorption capacity of biochar for NH₄⁺-N increases with the initial concentration (C₀) up to ~50 mg/g, driven by an enhanced concentration gradient and greater interaction between NH₄⁺-N molecules and the biochar surface. Beyond 50 mg/g, the adsorption stabilizes, likely due to saturation of adsorption sites and potential blockage of biochar pores by excess NH₄⁺-N65,66. As shown in Fig. 6b, increasing the temperature from 25 °C to 35 °C enhances adsorption capacity, attributed to higher kinetic energy of NH₄⁺-N molecules and faster diffusion to biochar surfaces. However, experimental data indicate that higher temperatures and pH values (>8.6) lead to NH₄⁺-N volatilization into gaseous ammonia, limiting adsorption67. Similarly, Fig. 6c reveals an optimal pH range of 6 ~ 9 for adsorption, influenced by competition between H⁺ and NH₄⁺ for adsorption sites at low pH and NH₃·H₂O formation at high pH. When the pH > 9, NH₄⁺-N undergoes conversion into its inorganic form (NH₃·H₂O), as indicated by reaction (6), which is unfavorable for adsorption68.
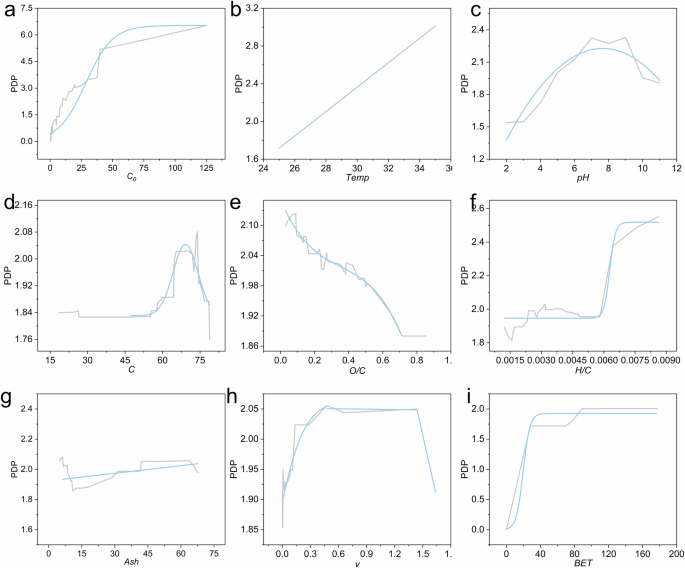
The gray line in the figure shows the actual values predicted by the ML model, while the blue line indicates the fitted values. a C0, b Temp, c pH, d C, e O/C, f H/C, g Ash, h V, i BET.
Carbon content (C) significantly impacts biochar’s adsorption performance, as depicted in Fig. 6d. When C < 0.60, the adsorption capacity increases due to the larger specific surface area. However, at C > 0.75, the decline in surface functional groups reduces adsorption efficiency69. The surface of biochar contains various oxygen-containing functional groups, such as carbonyl, carboxyl, hydroxyl, and phenolic hydroxyl groups, which play a critical role in the adsorption of NH₄⁺-N70. Figure 6e highlights the critical role of oxygen-containing functional groups in NH₄⁺-N adsorption, facilitated by strong electrostatic interactions with positively charged NH₄⁺-N molecules70. Additionally, studies have suggested that NH₄⁺ can act as a Brønsted or Lewis acid, and the adsorption of NH₄⁺-N on biochar surfaces generally involves reactions with these oxygen functional groups, resulting in the formation of amines or amides10,70. The H/C molar ratio represents the aromaticity characteristics of biochar, which may directly influence its adsorption performance71. The H/C molar ratio (Fig. 6f) also affects adsorption, with higher ratios indicating more hydrophilic groups that enhance adsorption efficiency through hydrogen bonding and electrostatic interactions72. Ash content shows a nonlinear effect on NH₄⁺-N adsorption (Fig. 6g), as alkaline minerals in ash influence biochar surface alkalinity. However, excessive ash can block micropores, reducing effective adsorption sites73. Finally, the porous structure (Fig. 6h) and large surface area (Fig. 6i) of biochar facilitate mass transfer and adsorption, although physical adsorption is not the predominant mechanism, given the complexity of electrostatic and ion-exchange interactions10,73,74.
GUI application development
To facilitate the advancement of the CatBoost model, this study has developed a graphical user interface (GUI) in Python, integrating the optimized CatBoost model as illustrated in Fig. 7. This GUI allows for direct prediction of the NH₄⁺-N adsorption capacity of biochar by entering values for ten essential features, thus aiding in optimizing experimental design and supporting practical implementation. The interface includes input fields for parameters related to the chemical properties of biochar, physical characteristics of biochar, and experimental conditions. All relevant source code is available in the Data Availability section on GitHub. Users can open the file titled “GUI.ipynb” provided in this study, input the necessary parameters, and click the “Predict” button to obtain the predicted adsorption capacity displayed at the bottom of the screen.

The graphical user interface for biochar adsorption capacity based on the CatBoost model.
Challenges and future directions
Table 2 compares various studies using ML models to predict the adsorption performance of adsorbents for NH₄⁺-N. This study stands out due to its significantly larger dataset of 417 data points and 11 features, compared to earlier works that used smaller datasets (14–60 data points) and fewer features (3–7). The larger dataset and wider range of features provide a more robust and generalizable model, leading to a deeper understanding of the complex relationships involved. This study employed a variety of ML models, including RF, GBDT, XGBoost, LightGBM, CatBoost, ET, SVM, KRR, GPR, and MLP, with CatBoost emerging as the best-performing model. The R² value of 0.9657 achieved by CatBoost is comparable to or better than those of previous studies (R² values ranging from 0.9629 to 0.9998), indicating high predictive capability. Another advantage of this study is the availability of code and data, which enhances transparency and reproducibility. Unlike many previous studies, this study provides both, ensuring that the findings can be independently verified and built upon by future researchers.
This study presents an innovative approach for predicting biochar adsorb NH₄⁺-N through ML, which facilitates efficient adsorbent selection and reduces the need for labour-intensive experimental trials. This methodology can also serve as a reference for environmental studies applying ML to optimize adsorbents, potentially enhancing water treatment processes across different sectors. Additionally, another major advantage of this study is the comprehensive comparison of various ML models, offering insights into the best-performing models for predicting adsorption efficiency and thereby improving the accuracy and reliability of treatment outcomes. Moreover, the integration of the physical and chemical properties of biochar with experimental conditions provides a holistic perspective on adsorption behavior.
However, the study does have some limitations. The availability and quality of data used for model training present challenges; although 417 adsorption datasets were used, there is still limited coverage of certain conditions and features, which may restrict the model’s applicability in diverse environmental scenarios. Besides, in real wastewater, multiple contaminants are often present, and the interactions among these contaminants, as well as their effects on the adsorption of NH₄⁺-N by biochar, have not been adequately discussed. Moreover, the deep learning models demonstrated weaker performance, suggesting the need for further improvements to enhance their adaptability to smaller datasets.
In this research, twelve ML models were systematically evaluated for predicting the equilibrium adsorption capacity of NH₄⁺-N onto biochar. Among these models, tree-based ensemble methods consistently outperformed kernel-based and deep learning models, with the CatBoost algorithm achieving the highest accuracy (R² = 0.9329, RMSE = 0.5378). The CatBoost model’s robust performance is attributed to its ability to handle complex datasets, mitigate overfitting, and process missing or categorical data effectively. Stability and residual analyses further validated CatBoost’s reliability, making it the optimal model for this study.
The feature importance analysis revealed that experimental conditions contributed most significantly to NH₄⁺-N adsorption (67.2%), followed by the chemical properties (18.2%) and physical characteristics (14.7%) of biochar. PDPs indicated that experimental conditions such as C₀ > 50 mg/g and a pH range of 6–9 are more favorable for adsorption, providing deeper insights into the nonlinear effects of key variables like temperature, carbon content, and pH on adsorption capacity. To facilitate practical applications, a Python-based GUI integrating the CatBoost model was developed. This tool allows researchers to efficiently predict NH₄⁺-N adsorption by inputting experimental parameters, thereby optimizing experimental design and enhancing decision-making in environmental engineering.
This study demonstrates the potential of ML in advancing the understanding and optimization of adsorption processes. The proposed framework can be extended to other adsorption systems or environmental scenarios, promoting more efficient and sustainable water treatment solutions. Future work should focus on incorporating real wastewater scenarios and exploring the influence of multiple contaminants to enhance the model’s applicability.


Responses