Mathematical model of the inflammatory response to acute and prolonged lipopolysaccharide exposure in humans

Introduction
Sepsis arises from an unbalanced host response to infection, leading to severe and possibly life-threatening organ dysfunction1. The estimated worldwide incidence of sepsis approaches 50 million cases annually2. The 11 million deaths related to sepsis represent approximately 20% of global mortality2. A particularly high incidence ranging from 5 to 35% is observed in the (very) preterm neonatal population3. In Europe, adjusted mortality rates for sepsis still exceed 30%4 for adults. To improve patient outcomes and reduce mortality, rapid detection and provision of treatment are essential5,6. For instance, previous research has demonstrated that every hour that antibiotic treatment is delayed corresponds to a 10% increase in mortality in neonates with sepsis6.
The pivotal role of inflammatory mediators known as cytokines in the initiation and orchestration of the immune response makes them a central focus in understanding sepsis pathology7. There are both pro- and anti-inflammatory cytokines, with tumor necrosis factor (TNF), interleukin (IL)-6, and IL-1β as prominent examples of the former, and IL-10 of the latter. Cytokines can be measured in blood and, especially IL-6, have been associated with sepsis diagnosis, severity, and prognosis8,9. A better understanding of the pathophysiology of sepsis, especially pertaining to the inflammatory host response, may lead to more optimized ways to detect and treat sepsis. Experimental modeling of the inflammatory response in sepsis, both in vitro and in vivo, may prove to be instrumental in achieving this goal.
To investigate immune response dynamics, different models of inflammation are available, each with distinct advantages and limitations. These in vitro and in vivo models of inflammation can provide insight into the dynamics of the response to inflammatory stimuli and the pathophysiology of sepsis. An example of in vitro experiments in this field is stimulating isolated immune cells with bacterial endotoxin (also known as lipopolysaccharide [LPS]) and measuring the subsequent production of cytokines. Other in vitro models use organoids or small tissue samples to study inflammatory responses ex vivo10. Whilst these in vitro models can offer significant insight into intra- and, to a more limited extent, intercellular inflammatory cascades, they cannot capture complex systemic immune responses observed in whole organisms.
In vivo models help address some of these limitations. By administering LPS to laboratory animals or healthy human volunteers, a transient inflammatory response is provoked, inducing the production of the aforementioned cytokines but also clinical manifestations such as fever, flu-like symptoms, and hemodynamic changes11. However, these so-called experimental endotoxemia experiments typically involve bolus injections of LPS11,12,13,14,15, which only mimic a short-term, acute response and differ considerably from the protracted nature of real infections. Human LPS infusion models are rare but do exist16,17,18,19. However, these models only extend the exposure to LPS to several hours. Animal models have also utilized LPS infusion, but the responses differ considerably from those in human experiments. As an example, rodent models show bi- or multi-phasic fever responses which are not observed in humans20, cytokine concentrations are elevated for longer compared to humans21, and rodents require much higher dosages of LPS to elicit robust responses22.
To bridge these gaps between in vitro and in vivo models and to better predict and reflect clinical scenarios, in silico models have been developed. Such models have proven to provide valuable insights into other areas of biomedical research23. A range of in silico models already exist, however, they have several limitations. Firstly, they are typically developed and validated to exclusively simulate responses to short-term LPS stimulation rather than prolonged exposures. Additionally, these models generally do not describe changes in vital signs over time. Some mathematical models also group cytokines into pro-inflammatory and anti-inflammatory categories24, rather than describing them individually, despite clinical evidence suggesting that individual cytokine concentrations are diagnostically valuable25. Furthermore, the inflammatory response consists of pro- and anti-inflammatory components, with the latter providing negative feedback to the former. To date, in silico models generally either do not model IL-10 and therefore lack this feedback mechanism26,27,28,29, cannot be linked to time-concentration curves30, are solely calibrated and validated on animal data, or suffer from a combination of those.
Nevertheless, some advanced in silico models address several of these issues. Early models that did so were based on murine data31, whereas later modeling attempts used data obtained from human subjects32. Later, the human model was extended with thermal, pain, and cardiovascular interactions33. However, these mathematical models still have several unaddressed limitations. To start, they are often highly complex, with numerous parameters that are challenging to identify and interpret, leading to non-uniqueness in solutions. Moreover, these models also still primarily focus on short-term bolus injections of LPS. This makes them less suitable for simulating prolonged endotoxin exposure, which more accurately mirrors real infection scenarios19,33,34. Recent efforts have involved calibrating the existing model structure to human responses based on LPS infusion data35. However, these models begin to oscillate and become unstable with extended LPS exposure, and they fail to exhibit proper dose-response behavior. Therefore, they provide little additional information compared to in vivo experiments.
In this work, we present a well-validated ordinary differential equation (ODE) model that accurately captures the inflammatory response for different dosages of bolus injections and continuous infusion of LPS in humans. The model is designed based on in vitro experimental data and calibrated and validated on in vivo data. Furthermore, the model can simulate an actual clinical infection that develops over one or several days. This model combines experimental findings from both in vitro and in vivo models into an in silico model. It can be used as a basis for further development of a sepsis simulation model that, in turn, could have a wide range of applications from pharmacological research and virtual patient generation to synthetic data generation for deep learning applications, or patient digital twin technology for improved monitoring algorithms.
Results
Model development
The multiscale ODE model we developed simulates processes on both the cellular and organism level. Supplementary Fig. 1 illustrates why there was a need for a new model structure. The model that was developed by Dobreva et al.33, becomes unstable during simulations with longer time scales and is not able to capture the dose-response behavior well.
A schematic representation of the new mathematical model structure is presented in Fig. 1. On a cellular level, it describes the activation of immune cells and the release of cytokines in response to inflammatory stimuli, in this case, LPS. On an organism level, it simulates the changes in body temperature, heart rate, and blood pressure over time. The ODE model consists of 15 equations and 48 parameters, with 23 of the model parameter values extracted from the literature. The other parameter values were either manually or automatically estimated and fixed based on the calibration data. Overviews of the model equations, parameters, and initial conditions are provided in Supplementary Equations 1, Supplementary Table 1, and Supplementary Table 2 respectively. The developed model also includes a theoretical tissue damage variable (D). Tissue damage does not occur during the endotoxemia experiments in healthy human volunteers. However, during an infection, if inflammation is severe, the body will lose the ability to maintain homeostasis, for which the tissue damage variable accounts. After the inflammatory challenge has passed the tissue damage will slowly decrease as the tissue recovers. In the model, there is a resting immune cell pool that does not deplete. Therefore, it is assumed that the total resting immune cell population, at no point during inflammation, totally runs out. LPS activates the resting immune cells and, once activated, they decay with a fixed constant. Once activated, they express mRNA coding for pro- and anti-inflammatory cytokines36,37,38,39. The mRNA is subsequently translated to produce cytokines which are released into plasma with a combined parameter that incorporates the translation rate and an arbitrary scaling factor. Simultaneously, the mRNA is degraded with a fixed half-life40,41,42,43. The cytokines in the plasma also have a fixed half-life44,45,46,47. IL-10 is an anti-inflammatory cytokine and will inhibit the expression of TNF, IL-1β, and IL-6 mRNA48,49,50. To prevent IL-10 from increasing uncontrollably during long exposures, a negative feedback loop is added in the form of an auto-inhibitory interaction. This is analogous to the suggested autoregulation of IL-10 expression observed in LPS-activated monocytes51. In this model, IL-1β and IL-6 cause an increase in body temperature52, which in turn results in an increase in heart rate53,54. TNF, IL-1β, and IL-6 cause tissue and endothelial damage, which in turn causes a decrease in blood pressure55. Negative feedback is added analogous to compensatory mechanisms in the body to maintain normal blood pressure. However, the ability to restore and maintain blood pressure decreases as the tissue damage variable increases. A decrease in blood pressure causes an increase in heart rate and vice-versa to maintain a steady supply of oxygenated blood54. The tissue damage value is an arbitrary value that starts at zero and increases as tissues are exposed to inflammatory cytokines.

The model describes the activation of immune cells that start expressing mRNA encoding for cytokines. Course black dashed arrows represent up-regulatory interactions. Black arrows with flat ends represent down-regulatory interactions. Solid black arrows represent production rates. Fine black dashed arrows represent elimination rates. The cytokines are produced and excreted into the extracellular environment, in this case, a one-compartment model taken equivalent to the plasma. IL-10 will inhibit the expression of TNF, IL-1β and IL-6. TNF, IL-1β, and IL-6 may cause tissue damage, which lowers blood pressure (BP) and impedes the ability to regulate blood pressure. The decrease in BP is compensated with an increase in heart rate (HR). IL-1β and IL-6 cause an increase in body temperature which in turn raises the HR.
Parameter sensitivity and identifiability analysis
The full results of the parameter sensitivity analysis can be found in Supplementary Figs. 2 and 3. Based on these results, six parameters were selected to be (re-)estimated using experimental data. These include the three compounded scaling parameters sTNF, sIL6, and sIL10 as well as three mRNA half-life parameters kTNFmRNA, kIL6mRNA, and kIL10mRNA. The output of the model was sensitive to each of these parameters.
Determining the three compounded parameters directly from the literature would not be possible due to the nature of the arbitrary scaling factor that is included in these parameters. Therefore, the value of these parameters is estimated by using the in vivo human calibration data. Re-estimating the mRNA half-life parameters can be justified given that this data is collected from in vitro studies and that the in vivo environment likely introduces more complexity, leading to slightly different effective mRNA lifetimes in vivo. Other parameters determined from literature or calibrated on data, regardless of whether the model output was sensitive or not, were kept to their values.
The local identifiability analysis akin to profile likelihood analysis (PLA) showed that the six parameters were all uniquely identifiable using the calibration data at least locally. The results of this analysis are also provided in Supplementary Fig. 4. The results confirm that the six parameters can be uniquely estimated for model calibration, using the calibration dataset.
Model calibration
The model was calibrated on a representative subset of the in vivo dataset. To this end, the population response to a 1 and 2 ng kg−1 LPS bolus was used to estimate the parameters for the two different validation scenarios. The former was used in conjunction with the validation for the continuous infusion, the latter was used for the dose-response validation. A set of six parameters, selected in the previous step, was estimated from this data. Table 1 contains the estimated parameter values. The three mRNA decay parameters were re-estimated too, their values are slightly increased compared to the literature values. Figure 2 shows the model fit for TNF, IL-1β, IL-6, and IL-10 together with the experimental data. Additionally, this figure shows the change in both the temperature and the heart rate from baseline together with the experimental data.
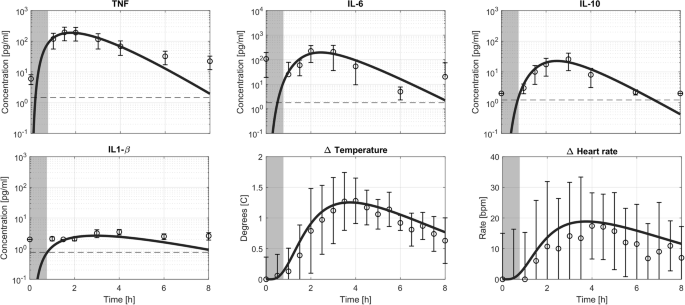
The model prediction for a bolus injection of LPS (solid line) together with experimental data and limit of detection (dashed line). A dark gray area indicates LPS concentration in the blood higher than 0.1 ng/ml. Data are depicted as mean ± standard deviation.
Overall, the model captures the dynamics observed in the actual data. It should be noted that the IL-1β concentrations in the circulation upon LPS administration are only slightly above the limit of detection, making it challenging to reliably estimate the parameters for IL-1β. They were, therefore, manually fixed based on the calibration data. TNF plasma concentrations peak at 200 pg mL−1, approximately 1.5 h after administration of the LPS bolus. IL-6 and IL-10 concentrations peak at approximately 2.5 h at 200 and 25 pg mL−1, respectively. All cytokines return to baseline, in this model equal to 0 pg mL−1, within the 8-h duration of the experiment and simulation. The temperature peaks at approximately 3.5 h post-LPS, showing a 1.5 degrees Celsius increase from baseline. The heart rate also peaked at approximately 3.5 h following LPS administration at a 20 beats per minute increase relative to baseline. As the blood pressure did not substantially change from baseline, the results are not shown here or in subsequent simulations. This observed behavior is also in line with the experimental data used for calibration.
Model validation
For model validation, two key aspects were examined. First, the model’s ability to predict the response to different bolus LPS dosages, and second, its capability to simulate the response to LPS bolus administration followed by continuous infusion during several hours.
To validate the model’s response to bolus LPS administration, a dataset comprising responses to LPS dosages of 0.3 (n = 10), 0.5 (n = 6), 1 (n = 6), and 2 (n = 6) ng kg−1 was composed. Notably, the measured absolute cytokine concentrations depend on the LPS batch potency17 and the cytokine measurement method (e.g. ELISA, multiplex assays, etc.). To address this, the model was calibrated using a 2 ng kg−1 subset (n = 15) of the calibration dataset. This calibration set appeared to provoke a similar response to those observed in the 2 ng kg−1 subset of the validation set. Bolus input profiles were varied according to the specified dosages, and the simulation results are presented in Fig. 3.
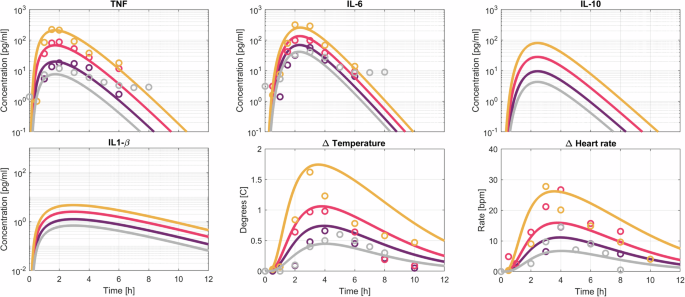
Model prediction (solid lines) and data in the form of population means for different doses of LPS injections. The different LPS doses range from 0.3 (light gray), 0.5 (purple), 1 (pink) to 2 (orange) ng kg−1.
Figure 3 illustrates the model’s ability to capture TNF responses across different LPS dosages, with peak concentrations consistently observed at 1.5 h post-administration. While the model overall aligns well with experimental data, it fails to predict slightly delayed TNF peak times for lower LPS dosages (2 h post-administration instead of 1.5 h). All other cytokine profiles peak at 2.5 h after administration. The model predicts IL-6 peak concentrations ranging from 40 to 200 pg mL−1 for the lowest and highest LPS dosages, matching experimental observations. Unfortunately, experimental data for IL-1β and IL-10 were unavailable, but the model predicts IL-10 concentrations of 4–80 pg mL−1, and IL-1β concentrations ranging from 0.75 to 5 pg mL−1.
Predicted temperature changes ranged from 0.5 to 2 degrees Celsius increases, consistent with experimental observations. Heart rate increased by 7 bpm for the lowest and 28 bpm for the highest LPS dose. The model, however, differs from experimental data in regards to the time taken for the temperature and heart rate to return to baseline. It overestimates this duration for higher LPS dosages. Additionally, heart rate changes for lower LPS dosages appear higher than the model’s predictions.
The second validation phase involved simulating extended exposure to LPS. The dosing scheme was identical to the one used in the experiment with 10 healthy volunteers. This scheme consisted of a 1 ng kg−1 loading bolus dose immediately followed by a 1 ng kg−1 h−1 infusion of LPS for 3 h. The simulation results are presented in Fig. 4.
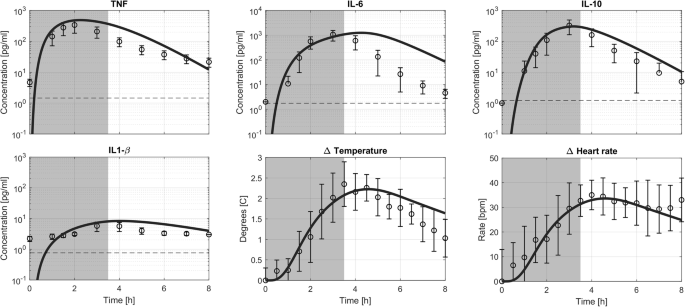
The prolonged LPS exposure consisted of a 1 ng kg−1 loading bolus dose immediately followed by a 1 ng kg−1 h−1 infusion of LPS for 3 h. The model prediction (solid line) together with experimental data and limit of detection (dashed line). A dark gray area indicates LPS concentration in the blood higher than 0.1 ng/ml. Data are depicted as mean ± standard deviation.
In the simulation, TNF concentrations peaked at 2 h following administration of the loading dose reaching 450 pg mL−1, whereas IL-6 peaked at 4.5 h with approximately 1100 pg mL−1. IL-10 reached its peak at 3 h with a concentration of 300 pg mL−1, and IL-1β peaked at 4 h with an 8 pg mL−1 concentration.
The model slightly overpredicted the TNF response, with an experimental average peak concentration of only 300 pg mL−1, while the timing of peak concentrations matched the model’s prediction. Regarding IL-6, the model predicted the correct peak concentration but overestimated the time to return to baseline, resulting in a delayed peak time compared to the experimental data. The prediction for IL-10, both in terms of timing and concentration, aligned with the experimental data. While IL-1β peaked at the correct time in the model’s prediction, its plasma concentration was slightly overestimated compared to the experimental data.
Temperature predictions were in agreement with experimental data, showing a peak temperature increase of around 2 degrees Celsius at 4 h following the administration of the LPS loading dose. The model returns to baseline slightly slower than was observed in the experimental data. The increase in heart rate, approximately 30 bpm, was sustained throughout both the simulation and experimental data.
Infection simulation
Figure 5 illustrates the model’s response to three distinct infection scenarios. Supplementary Fig. 5 shows the input profiles to the model. The bacterial growth rate’s influence on cytokine dynamics appears relatively minor. However, it has a considerable impact on vital signs. Notably, there is a substantial 10-h difference in meeting the systemic inflammatory response syndrome (SIRS) criteria thresholds between slow and rapid infections. Overall, it takes anywhere from 18 to 26 h after the start of the infection to cross the SIRS criteria thresholds. In terms of cytokines, IL-6 has been established as a biomarker with high diagnostic sensitivity and specificity in adults56. An optimal cut-off has yet to be determined, we therefore chose to use a conservative 200 pg mL−1 for this scenario. This value was determined based on the average of the cut-off values for sepsis (52 pg/mL) and septic shock (349 pg/mL)8. It only takes 4–6 h after the start of the infection to cross this threshold.
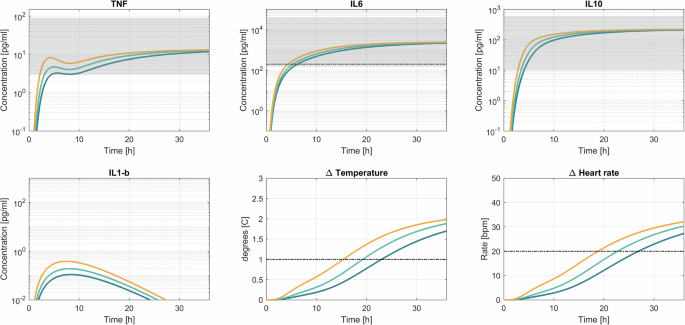
The blue line corresponds with a slow infection, green with a medium-fast infection, and orange with a fast infection. The black lines indicate thresholds for diagnosis, for IL-6 the cut-off was at 200 pg mL−1. Based on the SIRS criteria, a temperature increase of 1 degree Celsius and a 20 bpm increase in heart rate were selected as thresholds. The gray areas indicate the concentrations typically observed in sepsis patients upon admission to the ICU. The cytokine concentrations and vital signs are plotted from 0 to 36 h after the start of the infection. The gray dashed lines indicate the threshold according to SIRS criteria.
Discussion
In this work, we present a mathematical model of the inflammatory response to an infection. Built using both in vitro and in vivo data, and calibrated on various human datasets, the model was extensively validated using data from various in vivo studies with different LPS exposures in healthy volunteers. This model simulates immune cell activation dynamics in response to inflammatory stimuli, specifically LPS, by describing plasma concentrations of cytokines such as TNF, IL-6, IL-10, and IL-1β over time. Furthermore, the model describes the changes in physiological parameters such as temperature, heart rate, and blood pressure. To the best of our knowledge, this is the first mathematical model that can quantitatively and accurately simulate the inflammatory response to both a bolus injection and continuous infusion of LPS in healthy volunteers. This in silico model allows us to study prolonged exposure to inflammatory stimuli, simulating extended infection scenarios that are challenging to replicate in in vivo models.
To overcome the limitations of current models, we hypothesized that introducing mRNA expression in the model would allow for simulation of the inflammatory response to both short and long LPS exposures in healthy volunteers. In this way, mRNA acts as a form of short-term memory in the model, sustaining cytokine production briefly after the inflammatory stimulus has disappeared. In the case of an LPS bolus injection, the stimulus is very short57. The time-dependent delay term provides an additional delay in the short-term response without impacting long-term responses. Therefore, the model remains able to dynamically respond to the disappearance of the inflammatory stimulus. This functionality, achieved through sigmoid-shaped time-dependent terms for cytokines like IL-1β, IL-6, and IL-10, would not be possible using delay differential equations as these would shift the peak concentration time as well.
As is illustrated by the behavior of IL-6, it is important to recognize that the inflammatory response in vivo is highly complex, involving various immune cells and signaling molecules. The described model aims to provide a simplified system description that captures the behavior as observed in the in vivo experimental models. Data from animal in vitro experiments was used in some cases when similar human cell data was unavailable. Since the response in the inflammatory response may vary between animals and humans a bias may be introduced in the model fit to human data. This approach, however, has been selected so that the majority of human in vivo data could be used for independent validation. In future versions of the model, the model could be reparametrized using dose-response curves from in vitro experiments with human cells. In this model, it is not specified what cells exactly produce the cytokines. In the case of LPS administration in an experimental setting, tissue-resident macrophages and probably also endothelial cells appear to be the main sources of cytokine production, while circulating immune cells only play a minor role. Furthermore, because the model was developed using data from LPS stimulation models, it may only recapitulate the response induced by activation of the Toll-like receptor (TLR)4 pathway. In the clinical setting, different pathogens, molecules, and disease mechanisms are involved and may influence the inflammatory and clinical trajectory. Nevertheless, is well-established that at least genomic responses to different pathogens, pathogenic stimuli, and to other inciting events (trauma, burns) show great overlap58,59. This was underscored again by a recent study showing that gene expression patterns are highly correlated across heterogeneous groups of patients with fecal peritonitis and community-acquired pneumonia, demonstrating that most sepsis response pathways are common and independent of the pathogen involved60. Future efforts should nevertheless be made to include more types of (immune) cells in the model and add more complex disease mechanisms. Also, the pathways leading to cytokine production may be worked out in greater detail to test different perturbations within these pathways and their influence on the macroscopic behavior.
Notwithstanding, by focusing on both cellular and organism-level processes, this multiscale model balances simplicity with accuracy. Despite its minimalistic equations, the model successfully simulates heart rate and temperature changes, showing its robustness in capturing key physiological markers. Future extensions could explore incorporating more detailed physiological mechanisms. Mathematical models of the (para-)sympathetic regulation of the heart, as well as blood pressure regulation, are available in the literature33,61,62. It was decided to focus on establishing accurate biomarker dynamics first, leaving merging these models for the next iteration of the model.
Various medications can influence the inflammatory response and conversely, inflammation also influences the metabolism and clearance of drugs. This makes personalizing drug therapy especially challenging in critically ill patients. Some cytokines, such as IL-6, have been suggested to inhibit the production of drug-metabolizing enzymes63. The model we developed could be integrated into a (physiology-based) pharmacokinetic (PB)PK model to simulate and investigate this duality, as has previously been suggested64. As such, the multiscale model proposed in this work has a potential range of applications such as the development of a quantitative systems pharmacology (QSP) platform for in silico clinical trials advancing drug development and experimental design in clinical research. The model’s applications also extend to other sepsis simulation platforms. By forming the basis of a sepsis simulator, it could facilitate the study of various sepsis endotypes (e.g., hypo- or hyperinflammatory) and personalized treatment strategies associated with them65. For example, the BioGears Physiology Engine was developed as an open-source virtual patient simulator61. The simulator can simulate a wide range of physiological parameters, clinical phenomena, and virtual patients with great success. However, its infection module is based on an older murine model and therefore not able to qualitatively and quantitatively model correct biomarker dynamics on the required time scales. Furthermore, although the vital sign profiles generated by this simulator may appear quantitatively correct, temperature and heart rate changes are not in line with clinical observations. Others have suggested that biomarkers such as IL-666 and vital signs such as temperature67 and heart rate (variability)68 change slowly over several days (24–48 h) prior to diagnosis based on traditional clinical methods. Implementing this updated model in place of the old inflammation module may therefore greatly enhance the sepsis simulation in this engine.
To showcase the model’s potential for simulating infection progression, we tested it using three distinct infection scenarios. In each case, the model accurately reflected cytokine concentrations reported in clinical settings69. Simulations indicate that circulating IL-6 levels crossed detection thresholds several hours before clinical symptoms appeared, offering an estimated time advantage of 12–20 h for early infection detection. The degree of this advantage varies based on the bacterial growth rate, aligning with prior estimates from literature70,71. Traditionally, sepsis is identified through systemic inflammatory response syndrome (SIRS) criteria, including elevated heart rate, respiratory rate, and abnormal temperature, where patients displaying two or more SIRS criteria linked to suspected infection were classified as having sepsis72. The SOFA score has since replaced SIRS for sepsis diagnosis, but it relies on additional metrics that may not be immediately available1. Therefore, SIRS criteria remain a useful initial indicator, though it may detect infections relatively late due to delays between the onset of the inflammatory response and symptom manifestation. Alternative early detection methods include heart rate variability (HRV), which has been used primarily in neonates73. However, HRV has been shown to yield high false-positive rates of up to 70% in neonates70,71. This leads to unnecessary tests and a burden on young and vulnerable patients74. Biomarkers could potentially facilitate earlier detection than that offered by monitoring vital signs. Recent advancements in biosensors are of particular interest in this respect, as they may support proactive biomarker monitoring in the near future75, potentially serving as a promising alternative to methods based on vital signs alone.
While our model used a simplified asymptotic bacterial growth curve as an input profile, actual bacterial growth rates, and immune response timelines vary depending on factors such as infection type, immune function, and the patient’s condition. Although antibiotic interventions, which were outside the scope of this study, may alter cytokine response, the results suggest that monitoring cytokine concentrations in blood could significantly enhance early detection of infection or sepsis onset. As routine cytokine measurements are currently limited and time-intensive, the aforementioned new biosensor technologies could enable continuous, point-of-care cytokine monitoring, potentially with single-molecule sensitivity76. If minimally invasive real-time measurement technologies become available, they could improve early detection and inform treatment adjustments, such as antibiotic dosage. Notably, IL-6 has been shown to reflect antibiotic efficacy77, supporting the use of cytokine monitoring as a tool for guiding therapeutic decisions and optimizing sepsis management.
While this model offers advancements over existing models, it has limitations that should be addressed. Firstly, the prediction for the continuous LPS infusion model shows an overestimation of TNF plasma concentrations. Additionally, predicted IL-6 concentrations take longer to return to baseline compared to the experimental data. A similar, though less prominent issue is observed with the temperature response, as this is most likely linked to the prolonged increased values of IL-6. In the current model, IL-6 is represented solely as a pro-inflammatory cytokine. However, in reality, it is a pluripotent cytokine involved in a myriad of pathways. In fact, under certain conditions, IL-6 also exhibits anti-inflammatory effects78. This duality is not well understood and remains an active area of research. The discrepancy between the data and the simulation could therefore stem from IL-6’s complex role, which includes autoregulatory, and anti-inflammatory effects. Incorporating this complexity in a future iteration may improve the model’s accuracy and provide an opportunity to explore IL-6’s multifaceted behavior.
In conclusion, this work demonstrates the development, calibration, and validation of a multiscale mathematical model of the inflammatory response to infection. It extends other efforts made to model the LPS-induced inflammatory response mathematically. The capacity to quantitatively model individual cytokines over extended time frames opens up new possibilities for understanding and modeling different aspects of sepsis. The model serves as a foundation for a sepsis simulation model with a potentially wide range of applications in different disciplines associated with sepsis research. It importantly extends the currently available in vitro and in vivo sepsis model modalities to more closely resemble sepsis. Furthermore, it may facilitate pharmacometrics modeling and virtual patient generation going forward, investigating personalized treatment strategies. The infection simulation also serves as a proof-of-concept for new early detection solutions using continuous biomarker monitoring using newly developed sensing technologies.
Methods
Experimental data
In this work, a range of published data was digitized from figures using WebPlotDigitizer79. To build the model, data from in vitro and in vivo animal and human experiments was used to identify and quantify interactions in the inflammatory cascade induced by LPS stimulation80,81. Furthermore, data from three different in vivo human endotoxemia experiments were used for model calibration and validation. The first in vivo dataset was extracted from published data reported by Kiers et al.19 and included two different bolus dosages of 1 ng kg−1 (n = 10), 2 ng kg−1 (n = 15) as well as a 3-h infusion of 1 ng kg−1 h−1 (n = 10) of LPS. The second dataset was published by Dillingh et al.14 and includes three different bolus dosages of 0.5 ng kg−1 (n = 6), 1 ng kg−1 (n = 6), and 2 ng kg−1 (n = 6). The third dataset was extracted from published material by Taudorf et al.34 and includes a 0.3 ng kg−1 bolus (n = 10). All experimental data was collected from young healthy male volunteers who provided written informed consent, and all studies were approved by accredited local ethics committees. Details can be found in the original publications.
In the human endotoxemia studies included in this investigation, blood and vital signs were sampled regularly. The sampling schedule and collected data are summarized in Table 2. The 1 and 2 ng kg−1 bolus injection data from Kiers et al. were used for the calibration of the model, all other data were used for validation.
Model development
The workflow for designing the new ODE model consisted of multiple consecutive steps and iterative phases. The process began with identifying the components that needed to be included in the model. A conceptual model was built based on reported interactions, and interactions were included in the mathematical model if there was sufficient data or if they were deemed essential. Three types of interactions were included: up-regulatory and down-regulatory Hill equations, as well as production and conversion rates. The up- and down-regulatory Hill equations are mathematical representations used to describe the regulatory behavior of biological systems. The up-regulatory Hill equation is given by:
where [A] represents the concentration or value of the activating variable, n is the exponent, and x is the half-activation constant or half-maximal concentration.
Similarly, the down-regulatory Hill equation is given by:
In both equations, x represents the half-activation constant, which is a parameter determining the concentration of the activating variable at which the response is half-maximal. The exponent n governs the steepness of the response curve. Parameters were extracted from dose-response curves from in vitro experiments in the literature or manually selected and tuned based on calibration data if unavailable. A parameter sensitivity analysis and parameter estimation were conducted, followed by a parameter identifiability analysis to ensure the chosen parameters were identifiable. The model was validated using in vivo data from different datasets. Eventually, the model was also used to simulate the onset of a bacterial infection in an extrapolated scenario. The workflow is visualized in Supplementary Fig. 6.
For this model, it was decided to separately model cytokine mRNA and protein expression. Modeling the mRNA separately acts as a memory and allows the model to start translating cytokine proteins from mRNA at a later point, even though LPS itself is already largely eliminated from circulation due to its short half-life57. Furthermore, a new time delay method was introduced in this model, based on a sigmoid-shaped time-dependent term in the equations for IL-1β, IL-6, and IL-10. This acts as a one-sided delay allowing the model to accurately simulate the cytokine responses to both bolus and prolonged inflammatory stimuli. Mechanistically, this time delay is introduced to cover the internal signaling pathways and processes that introduce a delay between signal and response that is also observed in the data.
The model was implemented in MATLAB and Optimization Toolbox R2021a (The Mathworks Inc, Natick, MA). To solve the differential equations the ode45 solver was used. For the activation of immune cells and the temperature changes a traditional delay method was chosen in the form of transit compartments82,83.
Parameter sensitivity analysis
Both a local and multi-parameter sensitivity analysis (LPSA and MPSA) was performed on all model parameters. In the LPSA, each parameter was individually increased one by one with 50% of their reference value, forming an adjusted parameter set. To make comparisons, an output feature has to be selected. In this case, the area under the curve (AUC) for each state variable was chosen, the AUC represents the total exposure to the cytokines and combined duration and relative increase or decrease in vital signs. The two AUCs, one from the original parameter set and one from the adjusted set were subtracted from each other, and the absolute value of that result was subsequently divided by the AUC of the original curve. Dividing by the original AUC ensures both interpretability of the value obtained, namely a relative change to the original exposure, as well as removing bias from variables having absolute values with different orders of magnitude. As such, a larger value indicates that the variable is more sensitive to that specific parameter84.
MPSA is performed similarly to LPSA but now all parameters were varied simultaneously between an upper- and lower bound of 50% of the reference parameter value. This was done using Latin Hypercube sampling and 15.000 parameter sets were sampled. Convergence was checked and obtained so this number of samples proved to be sufficient in this case. Then the samples were sorted for each parameter individually and the cumulative distributions of the acceptable and unacceptable cases were computed. The Kolmogorov–Smirnov distance was then calculated. This distance is a measure of the sensitivity of the variable to the corresponding parameter85.
Parameter estimation
Parameters were estimated using Maximum Likelihood Estimation (MLE) principles by optimizing the objective function such that the normalized sum of squared residuals (SSR) between model simulation and measured population mean data became the smallest86,87. The objective function ({SSR}(theta )) is defined in Eq. 388. Where (V) is the number of variables for which there is data available, which includes different cytokines and vital signs depending on the dataset. ({T}^{i}) is the number of time points available for each variable (i). The model prediction for a variable (i) at a time point (j) given parameter vector (theta) is denoted by ({y}_{i,j}left(theta right)). On the other hand, ({y}_{i,j}^{{obs}}) is the corresponding value of the population mean of the variable (i) at time point (j). The whole term is normalized by dividing with (max) (({y}_{i}^{{obs}})), which is the maximal value of all observations in the time series for variable (i). This normalization was introduced to mitigate bias towards variables with higher absolute values compared to others, ensuring fair consideration across all variables.
The optimization was done using lsqnonlin which is a local, gradient-based least square solver in MATLAB. No additional regularization was needed. Only a subset of parameters, those that were identified during the parameter sensitivity analysis, were estimated.
Parameter identifiability
The model parameters that were selected for fitting were also evaluated for their identifiability. The local identifiability was evaluated by using a method similar to Profile Likelihood Analysis (PLA)88,89. In PLA, one parameter value is fixed at different values surrounding the optimal value whilst others are being re-estimated. If the SSR for the model fit increases this is seen as an indication that a reliable parameter estimate has been found and the parameter is deemed identifiable90. The identifiability of a parameter is determined by the model structure and the available data that is used for parameter estimation.
Validation of the model
The model validation was done by simulating the response to a 0.3, 0.5, 1, 2 ng kg−1 LPS bolus as well as to a 1 ng kg−1 loading dose directly followed by a 1 ng kg−1 h−1 continuous infusion of LPS for 3 h. The model prediction is compared to corresponding experimental data.
Infection simulation
The model was used to simulate an infection by changing the input to the bacterial load in blood that might be encountered in a patient during an infection. The bacterial growth curve served as an example exposure profile and therefore input to the model. Murine experiments have confirmed that this shape is indeed representative of the in vivo bacterial exposure in blood during an infection. Asymptotic curves were given as input to the model, these curves mimic part of the bacterial growth curve. Currently, there is no precise method to convert LPS concentration to bacterial load due to factors such as the potential localization of infections within specific parts of the body. Therefore, we varied the input profile of LPS and identified a plausible profile through trial and error. This approach results in cytokine concentrations that are typically observed in adult sepsis patients. No treatments are simulated and only the onset of infection is modeled. To account for this uncertainty, and investigate the impact of the bacterial growth rate on the observed response, three different infection scenarios are simulated. These three scenarios differ only in the bacterial growth rate. The first scenario is a rapid infection that develops in 12 h. The second is an intermediately rapid infection that takes 24 h to fully develop. Lastly, a slow infection that takes 36 h is modeled. Faster infections may mimic the clinical behavior typically seen in more severe infections. Clinical symptoms were assumed to be present as the temperature exceeded 38 degrees Celsius or the heart rate exceeded 90 bpm per the SIRS criteria. This works out to a relative change of 1 degree Celsius and a relative increase of 20 bpm compared to the average baseline.


Responses