Measuring Overwork in China Using Daily High-Resolution Nighttime Satellite Data

Background & Summary
In contemporary society, working hours play a pivotal role in shaping individual well-being. Overtime work has become a salient issue, as it is widely recognized for its adverse effects on physical and mental health. Recognizing this issue, many countries and regions have begun to explore adjustments to working hour systems in an effort to enhance employee happiness and quality of life. For instance, in Germany, 45 companies conducted a six-month experiment with a four-day workweek in 2024, and over 70% of them expressed their willingness to continue with this arrangement after the experiment. Similar trials have also been carried out in the United States and Japan. In China, the holiday system is gradually improving, with the revision of the “National Holidays and Memorial Days Leave Methods” by the General Office of the State Council in November 2024, which increased the Spring Festival holiday by one day in 2025.
Existing literature has consistently demonstrated a strong negative correlation between overtime work and both mental and physical health1,2,3,4. The accurate identification and analysis of overwork are paramount for policymakers to address potential health threats and efficiency losses. Major existing research mainly identifies overwork based on survey data5,6,7,8,9,10,11,12,13. We have collected major micro databases that include measurements for overwork, with brief introductions presented in Table 1. However, overtime work is a complex result of institutional, legal, cultural, and economic factors that exhibit significant heterogeneity across countries and over time. Consequently, survey data collected from employees in different countries and periods are often incompatible for direct comparison. Therefore, the availability of global data and the establishment of a unified standard are key factors in resolving this dilemma.
Nocturnal light detected by satellites provides an objective measurement for constructing a compatible and comparable index for economic activities. Economists began to widely use this data following the work that employed nocturnal light luminance as a proxy for real Gross Domestic Product (GDP)14,15. Since then, night light images from the Defense Meteorological Satellite Program’s (DMSP) Operational Line Scanner (OLS) have been utilized to identify various economic proxy variables, such as the boundaries and geometry of urban areas16 and the foundation of infrastructures17.
Night light images from DMSP face several potential drawbacks due to the technological limitations present when they were launched. A significant disadvantage arises from their limited dynamic range, leading to an over-saturation or “top coding” problem. This issue results in approximately 6% of pixels being truncated with top-coded digital number (DN) values of 63, thereby reducing the distinction between Central Business Districts (CBDs) and suburbs18. A method had been designed to calibrate the values of these top-coded pixels, which has been widely accepted in subsequent research19. To address these limitations, the Suomi-National Polar-orbiting Partnership (S-NPP) was launched at the end of 2011. Equipped with the Day/Night Band (DNB) sensor of the Visible Infrared Imaging Radiometer Suite (VIIRS), it generates nighttime products with higher resolution (15 arc-seconds, double that of the DMSP) and a wider dynamic range. This allows for the recording of both extremely high and low luminance levels in pixels. Multiple scientific and socio-economic studies have utilized VIIRS Day/Night Band (DNB) data19,20,21.
Overwork often occurs sporadically throughout the year, making daily night light data essential for capturing relevant features of overtime work. Although raw data from DMSP/OLS and S-NPP/VIIRS are recorded and collected daily, publicly available data from DMSP/OLS is pre-processed into annual maps. These maps reflect average conditions for economic activities but fail to capture the daily variations in work hours, thereby losing crucial information about employees who work only on certain nights each year. In contrast, the S-NPP satellite provides a daily night light data product, The VIIRS/NPP Gap-Filled Lunar BRDF-Adjusted Nighttime Lights Daily L3 Global 500 m Linear Lat Lon Grid (VNP46A2)22, which enables the capture of daily overwork features. By combining daily nightlight data with enterprise registration data in China, we extend the existing method23 to calculate an overwork index. We also design an algorithm that aggregates daily overwork data from pixels to different districts and frequencies.
Methods
Data input
VNP46A2 is a product that includes seven datasets, with two of the most relevant ones represented in Table 2. The raw nocturnal visible and near-infrared (NIR) light data is recorded by the National Polar-orbiting Partnership (SNPP) Visible Infrared Imaging Radiometer Suite (VIIRS). Advances in sensor resolution and calibration allow this product to better monitor daily nighttime overwork phenomena, especially in low-light conditions. This product employs standard VIIRS science algorithms before available in public. The data processing methods are employed to enhance the accuracy and utility of satellite data products. For nighttime data, the enhancements aim to improve the detection of short-term variations in nighttime lights by reducing noise and correcting for atmospheric and lunar effects. This allows for more accurate analysis of daily, seasonal, and annual changes in light emissions, supporting applications in urban planning, energy consumption studies, and environmental assessments (Black Marble User Guide, 2022)24. The preprocess re-format the raw data into a gridded linear format (Fig. 1). Notably, the pre-processing of the data has been conducted by National Aeronautics and Space Administration (NASA), and the publicly available data represent the processed results.

Separated blocks in the product. The blocks are marked by grids represented in the figure. The night light data, with a resolution of 15 arc-seconds (approximately 500 meters), has been converted into an array format and stored in HDF5 files. Each block, covering a spatial area of 10° × 10°, is stored in a single file, coded in two dimensions and marked by coordinates “h” and “v”. The detailed array shape is also provided.
We downloaded the blocks covering the whole of China, ranging from h25 to h31 horizontally and from v03 to v07 vertically. Notably, we excluded five blocks that only include the oceanic parts of China without any administrative areas. The product was initially available on January 19, 2012. VNP46A2 data from January 19, 2012, to December 31, 2020, are used in our research to match the enterprise registration data in China and to avoid disturbances caused by the outbreak of COVID-19.
VNP46A2 provides two types of night light measurements, named DNB_BRDF-Corrected_NTL and Gap_Filled_DNB_BRDFCorrected_NTL. The latter version fills in some of the missing values based on historical data. We use the gap-filled data in our analysis due to the large amount of missing grids in the former product, exceeding 50%. The missing ratio of the gap-filled product is presented in Table 3. In 2012, the first year that the SNPP satellite was launched, the missing rate was relatively high for the majority of grids, then stabilized in subsequent years. Only a few grids located along the coast missed all data for the entire year due to biases originating from the alignment process.
The State Administration for Industry and Commerce (SAIC), maintains a comprehensive firm registration dataset encompassing all firm affiliates since the founding of the People’s Republic of China. This dataset includes over 100 million items of basic enterprise information, such as names, registered capital, and addresses. However, it does not directly provide the latitude and longitude coordinates of these enterprises. In addition, to generalization our samples, we add the workplace of the A listed companies as a complementary. To obtain this information, we input the addresses into the API provided by Gaode Map, an online mapping service in China, to acquire the corresponding coordinates for each corporate entity. Subsequently, we calculate the firm stocks year by year and align the firms to a raster file aligned with VNP46A2 at a resolution of 15 arc-seconds.
Preprocessing
Before introducing the algorithm, basic preprocessing is necessary to mitigate the disturbances caused by extreme events such as nocturnal fires and lightning flashes. Existing methods are typically designed to address specific events individually. To comprehensively reduce the impact of extreme night light values, we employ a straightforward statistical approach. We calculate the natural logarithm of the night light values and determine their 99% confidence intervals annually in the assumption of normal distribution. Pixels with values outside this range (3 (sigma )) are excluded. Taking the logarithm helps to calibrate the skewed distribution of luminance, and applying the algorithm on a yearly basis reduces computational costs.
Judge daily overwork
To determine whether a specific grid exhibits potential overwork on a given day, we use two criteria: First, luminance tends to increase during periods of overtime work within a grid. Thus, it is necessary to identify the normal intensity of night light in the absence of overtime work. We establish a baseline using the median night light values at the raster level during holidays over the year. This baseline is then used to compare daily night light values to identify deviations indicative of potential overwork.
The notation i, y, d, and h, denotes gird, year, date, holidays, and the number of surrounding pixels, respectively.(,{Media}{n}_{{iy}}()) refers to the median night light value for pixel i in year y. BN represents the night light luminance. To account for the potential influence of surrounding grids on night light within a specific grid, we developed a ResNet5 model that incorporates the values of the 24 adjacent grids as inputs to mitigate confounding factors. We selected all grids containing at least one enterprise as our sample set and randomly divided these samples into training and test datasets with an 80:20 ratio. Each center grid was uniformly encoded with the maximum value of int16 (65535) to control for overfitting and reduce computational costs. Notably, we use the raw data, including extreme values, as the training dataset before preprocessing. Extreme values, which primarily originate from special events, can produce spillover effects on surrounding grids. The main objective of this deep learning model is to mitigate the impact of such spillover. The detailed network architecture is illustrated in Fig. 2.
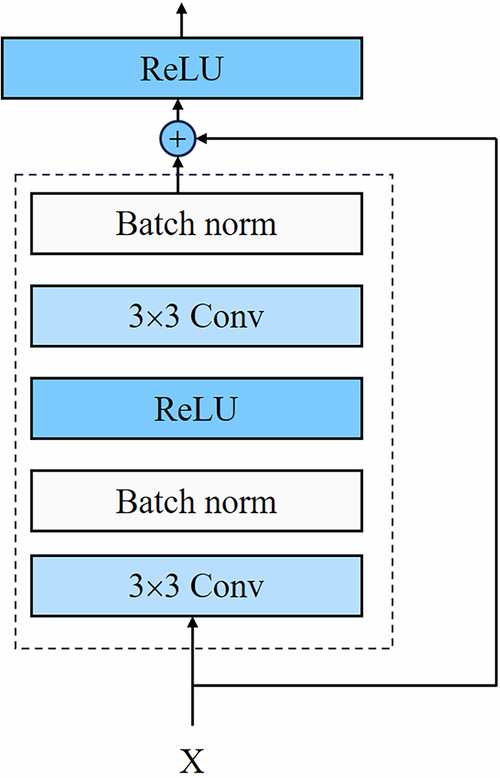
The ResNet block for condition 1. All grids contain one or more firms are used to train this network and the features are extracted from the 24 surrounding grids. We randomly choose 80% samples as training set and 20% as test data. Epochs and learning rate are 1024 and 0.001, respectively.
({widehat{BN}}_{i,y,d}) refers to the model’s predicted label. We interpret the output as being influenced by a range of spatial factors. A grid may indicate potential overwork if its luminance exceeds the predicted value or if relatively high luminance is due to spatial spillover. Therefore, we use a combination of these two conditions to identify grids with potential overwork. Further consideration is given to enterprises in grids when both c1 = 1 and c2 = 1. Since enterprises are fixed workplaces for most full-time employees, we exclude grids from overwork consideration if the enterprise stock is zero at the end of the year. Using establishment and bankruptcy dates, we can theoretically calculate the daily firm stock. However, considering data stagnation, operational cycles, and computational costs, we use annual enterprise stock in practice.
Weight selection
When multiple enterprises are located within the same grid, identifying the specific source of overtime work becomes necessary. A common method is to apply a specific algorithm to estimate the probability of overwork for each corporate entity. However, since most of the enterprises in the sample have not listed in the public market, there are too few features related to overwork to conduct a reliable estimation. To address this, we simply assume that the overwork probability of firms within the same grid follows a uniform distribution, meaning that all firms have an equal probability of working during leisure time. In other words, if there are several firms in the same grid, the actual overwork intensity for this grid is the ratio of the total overwork intensity divided by the number of firms. This approach simplifies the calculation while distributing the overwork intensity evenly among the enterprises within the grid. Due to the overlap between the workplace and registered address, we excluded A listed companies from our weighted data. This resulted in the loss of approximately 2,000 samples, which is about 0.2%.
Excluded grids with serious missing value
Another potential threat arises from the processing of valid grids. The accuracy of our measure of overwork depends on the number of valid dates annually. To ensure accuracy, we exclude grids that have fewer than 70 valid workdays and 5 valid holidays annually. This ensures that our calculations are based on a sufficient amount of valid data, thereby improving the robustness of our overwork measurement.
Aggregate
Based on the daily overwork measures at the grid level, we first aggregate the data annually. The ratio of overwork days to workdays and median value of workdays in a year is used to determine the annual overwork intensity for each grid, respectively. Night light values during holidays are considered a potential indicator of overwork, and assuming that half of the holidays for each grid experience overwork can introduce bias. Therefore, we exclude all holidays from our aggregation process to ensure a more accurate representation of overwork intensity.
We then calculate the overwork index for urbans for each year. First, we match the raster data of annual overwork intensity with the firm stock at the end of the year. After excluding grids without enterprises, we calculate the overwork index using the mean ratio of overwork days to workdays in prefectures. The overwork index at different administrative levels can be calculated using the same method. Additionally, we calculate the detailed intensity of overwork similarly, but instead of using a dummy variable, we use the difference between the daily night light values and the median night light values on holidays.
Data Records
The daily and annual overwork data at grids level are stored as HDF5 format. The corresponding data aggregate at city level are stored in Stata files. The data25 is freely accessible at https://doi.org/10.6084/m9.figshare.27060931.
Technical Validation
To examine the accuracy and effectiveness of our overwork measurement at different levels, we conduct a series of examinations from various perspectives in this section. First, we assess the correlation between the overwork features and the number of firms to validate our weighting selection. Next, we combine descriptive statistics with events that significantly influence overtime work. Finally, we analyze the rank and change tendency of overwork at prefecture level in China.
Weight selection
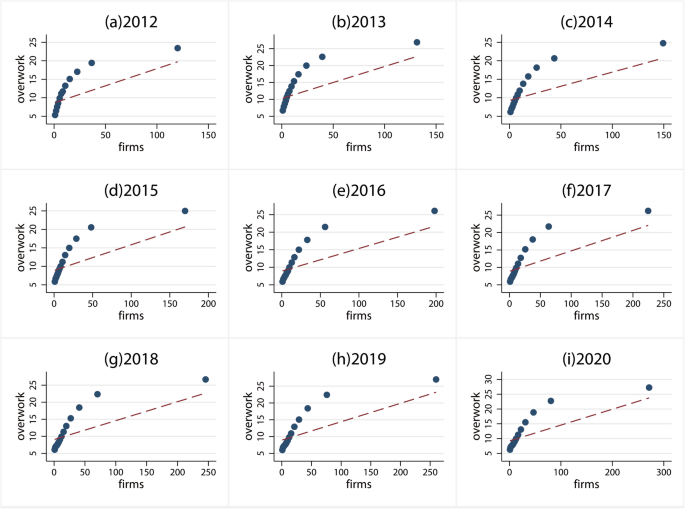
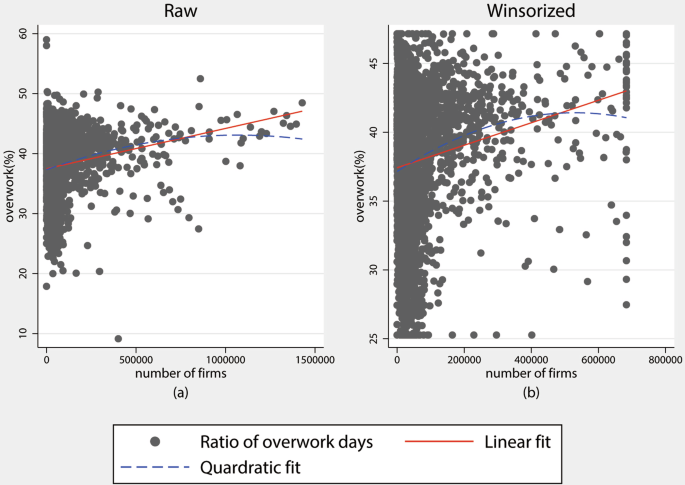
Enterprises are a primary source of overtime work, and the number of firms within grids is used as a weight for overwork. Therefore, a strong positive correlation between overwork and the number of firms is a key assumption of our algorithm. To examine this assumption, we present scatter plots at two levels, as referred to in the context, illustrated in Figs. 3, 4, respectively. The results at both the grid and prefecture levels show a strong positive correlation, supporting our assumption. Moreover, the overwork index weighted by firms reflects the average intensity considering the number of firms, capturing overwork from a legal and institutional perspective. In contrast, overwork at the grid level may represent the aggregate overwork for a urban. Therefore, we present the overwork both with and without weight in this context. Notably, due to the large number of data points at the grid level, we use binscatter, a method well-suited for visualizing bivariate relationships with large samples, to present the graphs year by year26.
.Overwork and the number of firms at raster level. The blue dots in each panel represent the conditional expectation of the overwork index given the number of firms. These expectations are calculated using a non-parametric algorithm, with 20 bins selected for the analysis.
Overwork and the number of firms at prefecture level. Y axis represents the average ratio of overwork days to all work days in the year. X axis represents the number of firms registered in the prefecture. We excluded bankrupt firms at the end of corresponding year.
Daily features validation
Capturing daily features of overwork is crucial for aggregating the annual overwork index. The results are presented in the panel a of Figs. 5, 6. The ratio of overwork grids to all grids ranges from 1% to 15.3%. Among 2253 workdays in from 2012 to 2020 in our data, the extreme value that obviously different with general value only occur in several days. We plot the daily overwork index by calculating the mean value for each day nationwide. Significant events that impact overwork are marked on the graph. These events are selected based on three criteria: (1) national coverage, (2) their reflection of factors related to law, institutions, culture, and the economy, and (3) the availability of accurate dates for when the events occurred.
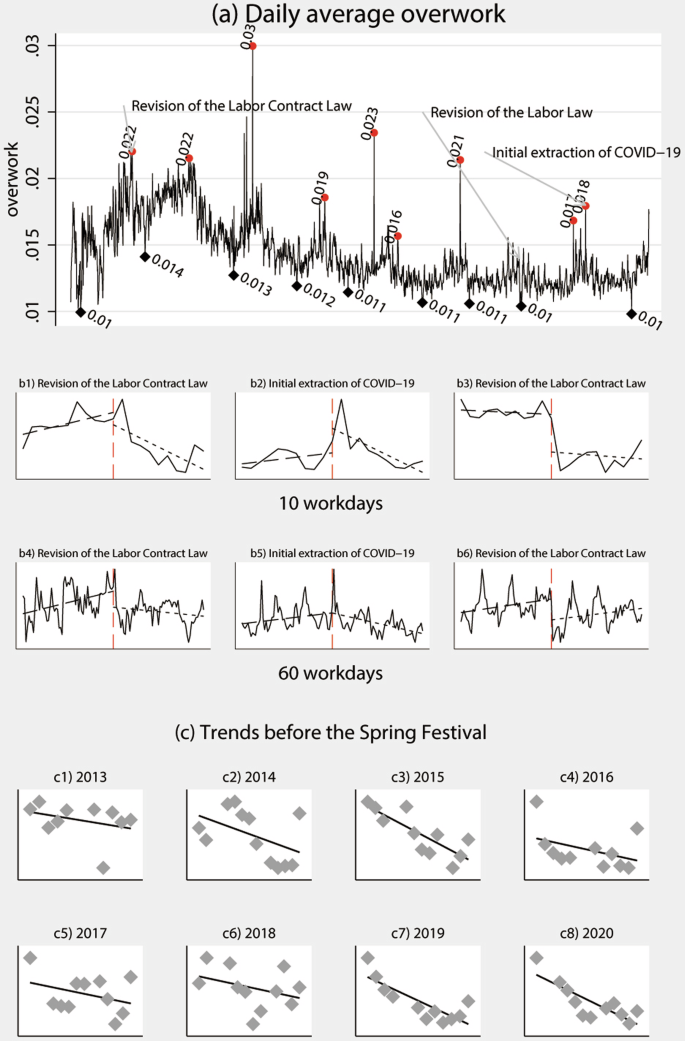
Illustration of features of daily overwork across China. The Y-axis in panel a represents the ratio of overwork grids to all grids located in China. Red and black dots mark the maximum and minimum overwork ratios for the year, respectively. Panel b shows the change tendency before and after the events marked in panel a. Subpanels b1-b3 refer to a 10-workday window both before and after the event, while b4-b6 refer to a 60-workday window. Panel c illustrates the trend from the beginning of the Chinese Spring Festival travel rush to the beginning of the Chinese Spring Festival. The trend in 2012 is omitted due to the unavailability of data for that year. The results are weighted by the number of firms at the grid level.
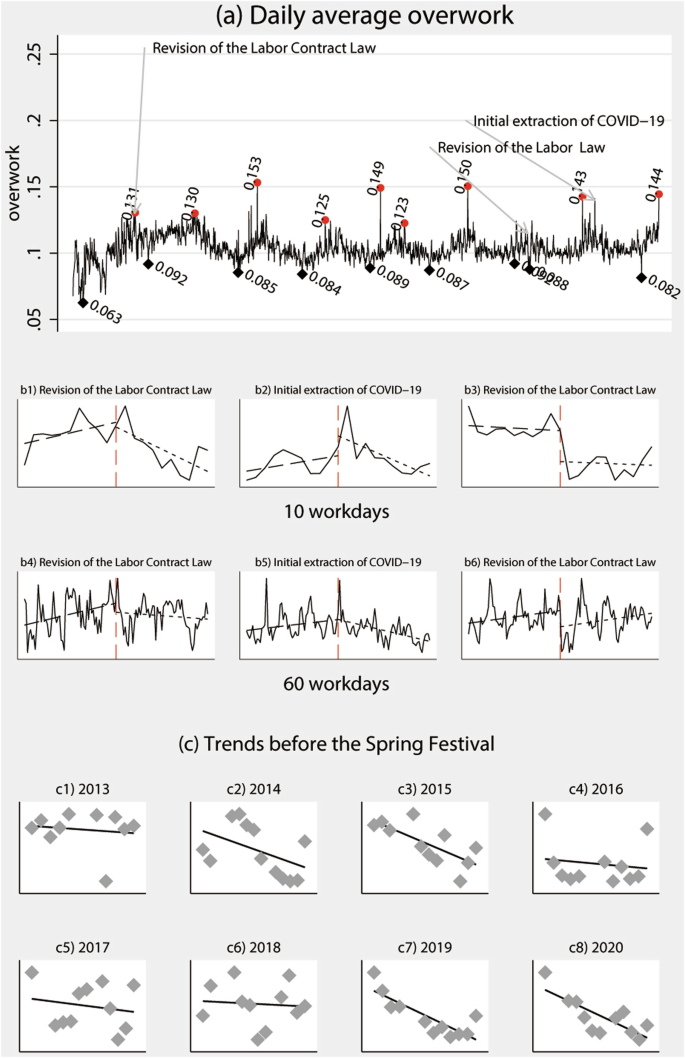
Illustration of features of daily overwork across China. The Y-axis in panel a represents the ratio of overwork grids to all grids located in China. Red and black dots mark the maximum and minimum overwork ratios for the year, respectively. Panel b shows the change tendency before and after the events marked in panel a. Subpanels b1-b3 refer to a 10-workday window both before and after the event, while b4-b6 refer to a 60-workday window. Panel c illustrates the trend from the beginning of the Chinese Spring Festival travel rush to the beginning of the Chinese Spring Festival. The trend in 2012 is omitted due to the unavailability of data for that year.
We examine several national events related to overwork from various perspectives: the revision of the Labor Contract Law announced on December 28, 2012, and the revision of the Labor Law on December 29, 2018, from the legal and institutional perspectives and the initial extraction of COVID-19 on January 7, 2020, from an economic perspective. The results present in panel b of Figs. 5, 6. Due to policy expectations or data delays, the peaks sometimes occur one day or two days later. In panel b, we plot two windows: 10 and 60 workdays before and after the event. Despite the revision of the Labor Law on December 29, 2018, there was an obvious increase after the event in both the short and long term. In 2018, the Labor Law revised only two items related to changes in the supervision institution, which may have led to a short-term impact but no long-term impact after the revision. Specifically, the Labor Law was revised as follows: (1) In paragraph two of Article 15, the phrase “must go through approval procedures in accordance with relevant national regulations” was revised to “must comply with relevant national regulations”. (2) In Article 69, the term “assessment and appraisal institutions approved by the government” was changed to “assessment and appraisal institutions that have been filed”. (3) In Article 94, the term “administrative departments for industry and commerce” was modified to “market supervision and administration departments”. Furthermore, the trend of overwork was analyzed from the commencement of the Spring Festival travel rush to the onset of the Spring Festival, which is one of the most significant holidays in China. A notable decline was evident during this interval. Figures 5, 6 present a scatter plot along with a linear fitted line, which clearly illustrate the decreasing trend.
We further examine the trend in overwork using a local policy experiment: the Pilot Programme for the Diversified Settlement of Labor Disputes, announced on February 20, 2020, and covering 8 provinces and 3 cities in China. We plot the daily overwork from January 1, 2020, in Figs. 7, 8.Both provincial and prefectural overwork are calculated using the zonal statistic function of ArcGIS Pro 3.01. The results show a noticeable decline in overwork following the implementation of the policy.
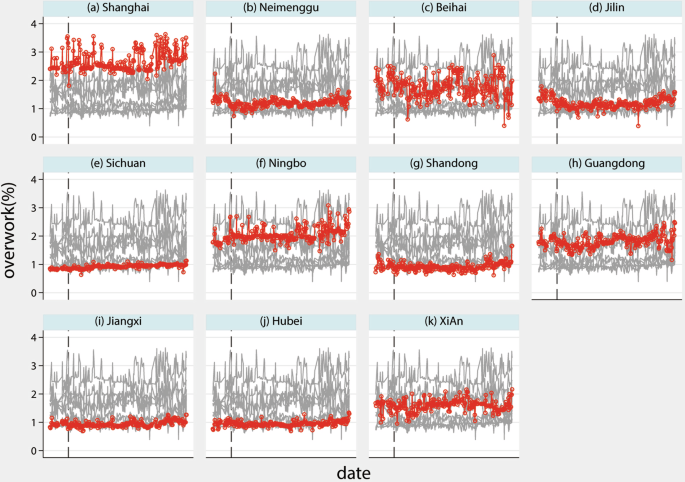
Illustration of firm weighted daily overwork ratio in 2020 for some experimental prefectures and provinces. The black dash line denotes the announcement of the Pilot Programme for the Diversified Settlement of Labor Disputes. The red line and dots represent the ratio of overwork grids to all grids in the area, while the grey lines show the overwork ratios in other areas. These ratios are weighted by the number of firms.
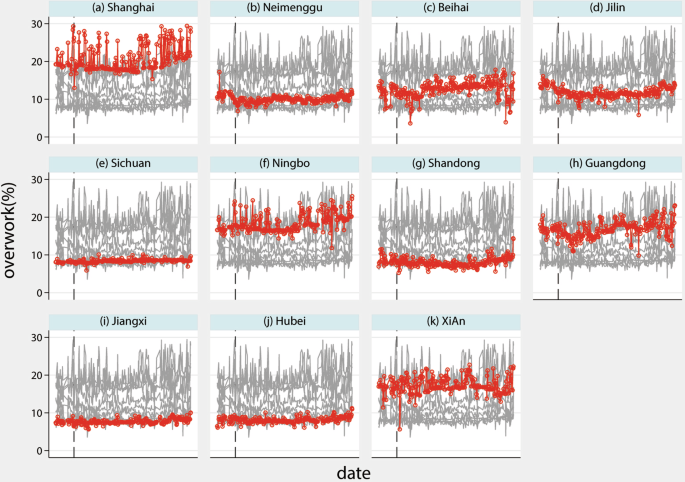
Illustration of daily overwork ratio in 2020. The black dash line denotes the announcement of the Pilot Programme for the Diversified Settlement of Labor Disputes. The red line and dots represent the ratio of overwork grids to all grids in the area, while the grey lines show the overwork ratios in other areas.
Rank and change tendency
Figures 9, 10 present the urban areas with the highest and lowest weighted annual overwork times, respectively. As previously noted in the text, the data from 2012 exhibit some differences compared to samples from other years, which is reflected in the city rankings. Therefore, the 2012 data should be used with caution. The spatial distribution of the top 10 and bottom 10 overwork cities shows spatial agglomeration in Figs. 9, 10. The top 10 cities are clustered in the eastern and southern regions of China, while the bottom 10 cities are clustered in the central and western regions. Notably, when weighting overwork by the number of firms, it is found that some underdeveloped cities in northwest China do experience severe overwork. This may be attributed to inadequate legal protection for laborers. In Fig. 11, the trend of the rankings of China’s first-tier cities, including Beijing, Shanghai, Guangzhou, and Shenzhen, is plotted. The high overwork rankings in these first-tier cities further corroborate the accuracy of our measurements.
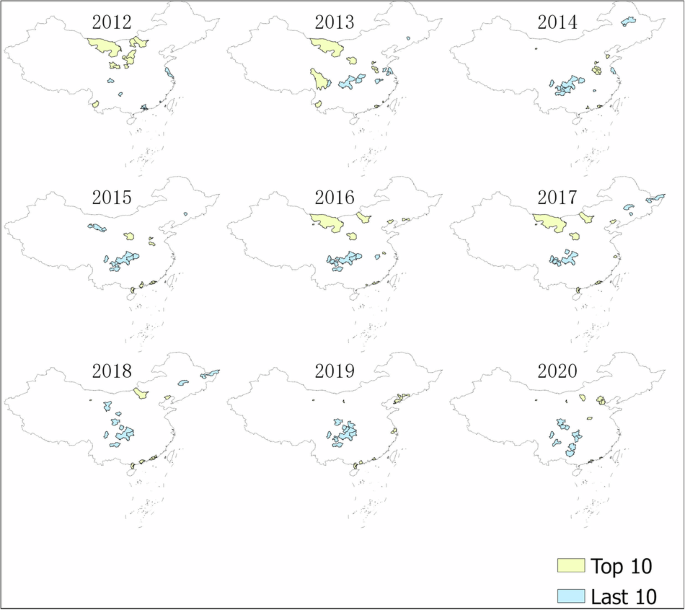
Illustration of top 10 and last 10 cities in China by overwork. We rank the aggregate overwork in each city and plot the top 10 and last 10 cities on the Chinese map. Each map represents the ranking for one year. Yellow blocks mark the top 10 cities, while blue blocks mark the last 10 cities. When conducting the rankings, regions with significant gaps in enterprise data, including the Tibet Autonomous Region, Qinghai Province, and Xinjiang Uygur Autonomous Region, as well as Hainan Province, where nightlight data is substantially lacking, were excluded. To ensure data comparability, data from provincially administered counties and forest regions like the Greater Khingan Range and Shennongjia were also removed. The rankings do not include data from Hong Kong, Macau, and Taiwan.The measurement for overwork is weighted by the number of firms in the city.
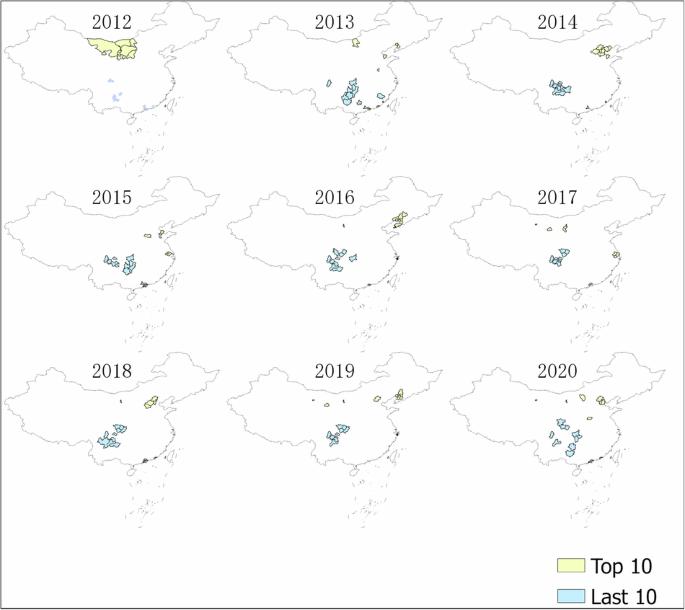
Illustration of top 10 and last 10 cities in China by overwork. We rank the aggregate overwork in each city and plot the top 10 and last 10 cities on the Chinese map. Each map represents the ranking for one year. Yellow blocks mark the top 10 cities, while blue blocks mark the last 10 cities. When conducting the rankings, regions with significant gaps in enterprise data, including the Tibet Autonomous Region, Qinghai Province, and Xinjiang Uygur Autonomous Region, as well as Hainan Province, where nightlight data is substantially lacking, were excluded. To ensure data comparability, data from provincially administered counties and forest regions like the Greater Khingan Range and Shennongjia were also removed. The rankings do not include data from Hong Kong, Macau, and Taiwan.
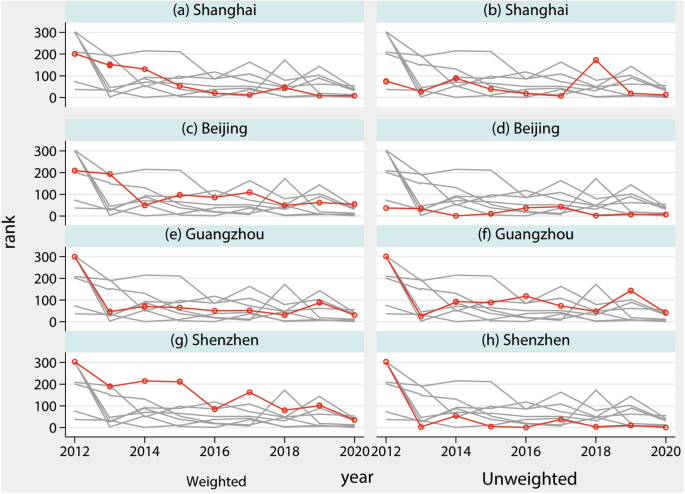
Change of the rank for the first tier cities in China. Y axis presents the detail rank for prefectures and X axis presents the year.
Validation with survey data
CLDS (China Labor Dynamic survey) database is used to further examine our measurement. It’s a tract survey in China from 2011–2020. Compared with other micro survey dataset, CLDS contain a question, did you overwork at last month, which could match the overwork condition of individuals with our measure at corresponding month in the prefectures. We use this work to construct a dummy variable and run a regression to our measurement for overwork, the results present in Table 4. Significant positive correlation at 1% level between two variables provide strong evidence for the effectiveness of our measurement.
Conclusion
In summary, the validation results confirm the reliability of our measurement of overwork in China. It is noteworthy that the data from 2012, the earliest year for which raw data were published, differ from the results of other years and should be used with caution. Additionally, as a subjective method for measuring overwork, this approach can be extended for cross-national comparisons.


Responses