Mechanisms of intergranular corrosion and self-healing in high temperature aged lean duplex stainless steel 2404

Introduction
Duplex stainless steels (DSSs) exhibit superior mechanical strength compared to austenitic stainless steels and higher toughness than ferritic stainless steels1,2,3, attributed to the presence of a dual phase microstructure with similar volume fractions of ferrite and austenite4,5. These remarkable properties and high corrosion resistance allow these materials to be used in various industrial segments, such as the oil and gas, power generation, chemical, petrochemical, and marine sectors6,7,8.
A key measure of corrosion resistance in DSS is the pitting resistance equivalent number (PREN), which is often used to classify different DSS grades based on their ability to resist localized corrosion. Examples9,10,11,12 include lean duplex, such as 2404, with a PREN of about 33; standard duplex, such as 2205, with a PREN of about 35; super duplex, such as 2507, with a PREN of about 42; and hyper duplex, such as 2707, with a PREN of about 49. In contrast, traditional austenitic stainless steels, such as 304 and 316, have much lower PREN values of about 18 and 24, respectively. In particular, lean duplex stainless steels (LDSSs) have been developed as an economical, low-cost alternative to the other DSS grades due to the reduced nickel (Ni) and molybdenum (Mo) contents, which represent a significant part of the total raw material cost7. To compensate for the reduction in Ni, which is a strong austenite stabilizer, high contents of manganese (Mn) and nitrogen (N) were added. The high N content not only contributed to a mechanical strength close to that of the other DSS grades but also promoted an improvement in corrosion resistance9.
Due to the complexity of the dual phase microstructure resulting from the addition of various alloying elements and a metastable ferrite, DSSs are subject to the formation of chromium (Cr) rich phases such as Cr-rich α‘ phase, Cr carbides and nitrides, sigma (σ) and chi (χ) phases when exposed to the temperature range of 300–1000 °C during thermal cycling and welding processes10,13,14,15,16. The formation of Cr-rich phases leads to the depletion of this element in the adjacent regions, resulting in the sensitization of the material and subsequent deterioration of corrosion resistance17,18. At temperatures above 600 °C, the formation and growth of the σ phase with exposure time has been reported as the main cause of corrosion resistance degradation10,19,20.
To assess the degree of sensitization (DOS) caused by the formation and growth of the σ phase, DSSs aged at high temperatures (600–900 °C) are subjected to double-loop electrochemical potentiodynamic reactivation (DL-EPR) tests10,14,18. This technique effectively evaluates the corrosion resistance degradation caused by the presence of the σ phase in DSS. However, finding the optimal DL-EPR test conditions is critical. It requires customization for each DSS grade/thermal aging combination because DL-EPR is affected by specific test conditions such as scan rate, temperature, and solution composition14,21,22,23. Non-standard test conditions may have contributed to the different results reported in the literature, as observed in studies discussing the self-healing process in DSS aged at high temperatures24,25.
The self-healing mechanism was proposed for austenitic stainless steels18, in which it was suggested that after the cessation of Cr carbide precipitation due to the depletion of carbon (C) atoms available for precipitation, prolonged exposure to high temperatures results in the diffusion of Cr atoms from the matrix to Cr-depleted regions. Over time, the previously sensitized steel undergoes a gradual process of desensitization. For DSSs, a similar mechanism has been suggested14,24,26,27: Cr and Mo atoms, the major elements of the σ phase, diffuse from the matrix to the depleted regions, restoring corrosion resistance. However, this mechanism seems valid only when the σ phase reaches thermodynamic equilibrium. This condition depends on the amount of alloying elements that favor the growth of this phase, mainly Cr and Mo13,28, and on the temperature and aging time14.
In this context, within the same DSS grade exposed at 700 °C, the self-healing process was reported during a relatively short aging period, as observed by Gao et al. 24, who reported the self-healing of LDSS 2101 after 24 h of aging. In their study, the DOS reached a peak of 11.4% at 24 h and then decreased with prolonged aging, reaching ~3.7% after 100 h. On the other hand, no self-healing of LDSS 2101 was observed by Deng et al. 25 after aging at 700 °C for up to 300 h, with the DOS continuously increasing during this period, reaching a maximum of 35.6%. Although different solution compositions were used in the DL-EPR tests in both studies, the kinetics of σ phase precipitation in LDSS 2101 is slow due to the lower Mo content29,30. The slow kinetics of σ phase formation implies that prolonged aging at 700 °C is required for this phase to develop in the microstructure of the material25, casting doubt on the occurrence of the self-healing mechanism in LDSS 2101 reported by Gao et al. 24. For LDSS 2404, with higher Cr, Ni and Mo contents (24Cr, 3.6Ni and 1.6Mo wt%) than LDSS 2101 (21.5Cr, 1.5Ni and 0.3Mo wt%)9, previous studies31,32 conducted at 700 °C for up to 100 h showed no evidence of the self-healing process. Instead, the DOS increased with aging time, reaching ~54.3% after 100 h32. Other studies on the thermal aging of this material in the temperature range of 600–950 °C33,34 were limited to a short duration (up to 60 min), which does not allow a detailed analysis of the corrosion mechanisms with the development of the σ phase.
For DSS with higher Cr, Ni, and Mo contents compared to the LDSS grade, no self-healing process was observed for standard 2205 after aging at 700 °C for up to 240 h35. However, Gong et al. 26 reported the healing of standard 2205 after 24 h of aging at 800 °C. For a 7MoPLUS DSS, Lo et al. 18 evaluating the effect of long-term thermal aging on the microstructure at temperatures of 630, 700, and 800 °C did not detect self-healing at any of the temperatures studied, even after 15,000 h of aging, leading the authors to question the occurrence of this phenomenon in DSS. For DSSs aged at 900 °C, Hong et al. 27 and Sun et al. 14 reported the self-healing process in a super duplex 2507 and a hyper duplex 2707 after 4 and 10 h of aging, respectively.
Given the above considerations, the occurrence of the self-healing process in DSS grades and the temperatures and aging times at which it can be expected to occur remain unclear. In this scenario, thermodynamic calculations using the CALPHAD approach, with DICTRA software36 and phase modeling37,38 have proven effective in elucidating σ phase formation in thermally aged DSS. Using DICTRA calculations36,37, it has been possible to estimate the compositional profiles of Cr and Mo at the interfaces between the σ phase and the ferrite or austenite phases, allowing an assessment of the extent of Cr and Mo depletion in regions adjacent to the σ phase. Thus, DICTRA simulations have the potential to advance the understanding of the self-healing process observed in high-temperature aged DSS and provide insight into the effectiveness of the DL-EPR test in detecting the recovery of corrosion resistance. In addition, these simulations can be used to predict the temperatures and aging time at which the self-healing process can be expected to occur for a DSS exposed to high temperatures.
Therefore, this study aims to understand the mechanism of intergranular corrosion and the self-healing process of DSSs aged at high temperatures, correlating the results obtained with the compositional profiles of Cr and Mo at the interfaces between the σ phase and the ferrite and austenite phases, using kinetic calculations. For this purpose, an LDSS 2404 was used, in which few studies31,32,33,34 have been conducted to evaluate the corrosion mechanism of this material aged at high temperatures, mainly during long-term aging. This material was subjected to thermal aging at temperatures of 700 and 800 °C for up to 500 h, and DL-EPR tests monitored the corrosion resistance. To validate the DL-EPR results, which are influenced by specific test conditions, anodic polarization tests were also performed in a 3.5 wt% NaCl solution. In addition, microstructural changes with thermal aging were evaluated using high-resolution electron microscopy techniques and X-ray diffraction analysis. Finally, the results obtained were compared with DICTRA calculations.
Experimental procedure
Material
LDSS 2404, supplied by Outokumpu Stainless AB as a 6.1 mm-thick hot-rolled sheet, was solution-treated at 1050 °C for 1 h, followed by water quenching. Cylindrical samples of 6 mm diameter were then cut by electric discharge machining and thermally aged at 700 and 800 °C for different times (0.5, 1, 2, 4, 6, 8, 10, 24, 48, 72, 100, 200, 300, and 500 h) in a vacuum muffle furnace to prevent surface oxidation. After the different aging times, the samples were removed from the furnace and air-cooled. Table 1 shows the chemical composition of the material determined using an arc spark optical emission and the N content by inert gas fusion technique in a LECO analyzer.
Materials characterization
The solution-treated sample and the samples aged at 700 and 800 °C for up to 500 h were mounted in conductive bakelite, ground to 1200-grit SiC paper, polished with a 1.0 μm alumina suspension, followed by vibratory polishing for 24 h with a 0.05 µm colloidal silica suspension. Phase mapping was performed by electron backscatter diffraction (EBSD) using a Tescan Mira 3 scanning electron microscope (FEG-SEM). Data were collected with a step size of 0.078 µm. The volume fraction of the phases constituting the microstructure of the solution-treated sample and samples aged for 500 h at both temperatures was determined by X-ray diffraction (XRD) analysis using the Rietveld method with the GSAS-II software39. The XRD analyses were performed using a Shimadzu XRD-6100 diffractometer operating with Cu-Kα radiation at 40 kV and 30 mA. The 2θ scan angle range was set from 30° to 100°, and each 0.02° step was counted for 6 s.
Electrochemical corrosion tests
Electrochemical corrosion tests after thermal aging were performed on a Gamry Reference 3000 potentiostat connected to a conventional electrochemical cell consisting of a Pt foil counter electrode, a KCl-saturated Ag/AgCl reference electrode, and cylindrical working electrodes with a surface area of 0.283 cm2 mounted in polyester resin. Before electrochemical measurements, the samples were ground to 600-grit SiC paper and immersed in the test solutions. At least three measurements were performed for each condition.
The DOS caused by the formation and growth of Cr-rich phases was measured by DL-EPR tests in a 1 M H2SO4 + 0.5 M NaCl + 0.01 M KSCN solution at room temperature. This solution effectively evaluates the DOS caused by the formation of Cr-rich phases in LDSS 240432,40. The working electrodes were maintained in an open circuit for 10 min, followed by a scan in the anodic direction from −500 to 300 mVAg/AgCl. At 300 mVAg/AgCl, the scanning potential was reversed to −500 mVAg/AgCl in the cathodic direction. A sweep rate of 1.67 mV/s was imposed. The evaluation of the DOS was determined in terms of the charge ratio (Qr/Qa)×100 in combination with observations of the surface morphology by SEM after the DL-EPR tests. Qa corresponds to the charge activation covering the entire sample surface and is determined from the polarization curve in the anodic direction, while Qr is associated with the charge reactivation resulting from corrosion in Cr-depleted regions and is determined from the polarization curve in the cathodic direction41. Qr/Qa ratio is more appropriate than the maximum reactivation/activation peak current intensity (Ir/Ia) when DL-EPR curves show two peaks during activation and/or reactivation scans. In such a condition, Qr/Qa reflects dissolution around all deleterious microstructure phases, eliminating the influence of one peak on the other without additional effort to separate them42. In addition, potentiostatic etching tests were performed for 5 min in the same solution used for the DL-EPR measurements at the activation and reactivation potential peaks observed in the DL-EPR curves, and the microstructures were analyzed by SEM.
Pitting corrosion resistance was determined by anodic polarization tests in 3.5 wt% NaCl solution at room temperature. Before testing, the samples were immersed for 1 h until a quasi-stationary potential, referred to as the corrosion potential (Ecorr), was reached. Measurements were taken at a scan rate of 1 mV/s starting from Ecorr and completed when the apex current reached a current density of 5 × 10⁻³ A/cm2. Breakdown potential (Eb) values were recorded at a potential where the current density increased sharply, exceeding 100 μA/cm2 43. After the tests, the morphology resulting from the localized corrosion attack was observed by SEM.
Thermodynamic and kinetic calculations
DICTRA calculations of the isothermal formation of the σ phase at the ferrite/austenite interface were performed to evaluate the Cr and Mo profiles near the formed σ phase at different aging times. The TCFE9 thermodynamic database was used to calculate the local equilibrium at the interfaces during isothermal aging, and the MOBFE4 mobility database was used to simulate diffusion-controlled transformations. Considering the initial volume fractions of ferrite and austenite in the solution-treated sample estimated by quantitative Rietveld phase analysis and the chemical composition of the material shown in Table 1, except for C, P, and S (considered as residual elements), the equilibrium calculation was performed to access the probable compositions of ferrite and austenite in the solution treated sample. These compositions are the input to define the calculation cell used in the DICTRA calculations, assuming 4.87 µm length as a region of ferrite and 5.13 µm length as a region of austenite, positioned to the right of the ferrite region. An unidirectional diffusion flux perpendicular to the ferrite/austenite interface was assumed, and σ formation was allowed in the model when a thermodynamic potential for σ presence of 10−5RT was reached (where R is the universal gas constant and T is the absolute temperature).
Results
Microstructure characterization
Figure 1 shows EBSD phase maps and DRX patterns of the microstructure of the solution-treated sample and samples aged at 700 and 800 °C for 500 h. The microstructure of the solution-treated sample, shown in Fig. 1a, consists of ferrite and austenite phases. With twin boundaries, the austenite phase is present as elongated islands resulting from the hot rolling process during manufacture, dispersed in the ferritic matrix. The XRD pattern of the solution-treated sample presented in Fig. 1b shows reflections of the ferrite and austenite phases. The phase volume fractions estimated by quantitative Rietveld phase analysis are approximately 49% ferrite and 51% austenite.

EBSD phase maps and XRD patterns of the microstructure of the solution-treated sample (a, b) and samples aged at 700 °C (c, d) and 800 °C (e, f) for 500 h. In the EBSD phase map, ferrite is shown in green, austenite in red, σ phase in light blue and Cr2N in dark blue.
The microstructures of samples aged for 500 h at 700 and 800 °C, shown in Fig. 1c and e, respectively, are composed of ferrite, austenite, σ phase located within the ferrite, and Cr nitride (Cr2N) with an ellipsoid shape, seen at ferrite and austenite grain boundaries, phase interfaces (ferrite/austenite, ferrite/σ phase, and austenite/σ phase), and within the ferrite phase. Cr carbide (Cr23C6) is also present in these samples, as shown in Supplementary Fig. 1, but was excluded from the phase indexing due to mis-indexing of ferrite when Cr23C6 was selected for acquisition.
The EBSD phase maps (Fig. 1a, c, and e) show a significant reduction of the ferrite phase with aging for 500 h at both temperatures. The formation of the austenite phase is also observed at the ferrite grain boundaries, in regions adjacent to the ferrite/austenite and austenite/σ phase interfaces and regions adjacent to Cr2N. In addition, small islands of austenite are also seen within the ferrite and ferrite/σ phase interfaces. The phase volume fractions are ~19% ferrite, 57% austenite, and 24% σ phase in the sample aged at 700 °C and 8% ferrite, 65% austenite, and 26% σ in the sample aged at 800 °C, as estimated by quantitative Rietveld phase analysis from the XRD patterns shown in Fig. 1d and f, respectively. Due to their small volume fractions and geometric sizes, Cr2N and Cr23C6 are not detected in the XRD patterns.
DL-EPR tests
Figures 2 and 3 show the DL-EPR curves of the samples aged at 700 and 800 °C for up to 500 h, respectively. During the scan in the anodic direction, the solution-treated sample shows two activation current peaks at −130 and −60 mVAg/AgCl; for the samples aged for 0.5 h at 700 °C (Fig. 2a) and 800 °C (Fig. 3a), an additional activation current peak is observed near −20 mVAg/AgCl. The current densities of these activation peaks increase with aging time, as shown in Fig. 2b–g for samples aged at 700 °C and Fig. 3b–f for samples aged at 800 °C. However, after 24 h of aging at 700 °C (Fig. 2h) and 10 h of aging at 800 °C (Fig. 3g), only one activation current peak is apparent. The activation peak current densities of the samples aged at both temperatures are very close to each other after 500 h, about 59 mA/cm2 for the sample aged at 700 °C (Fig. 2n) and about 56 mA/cm2 for the sample aged at 800 °C (Fig. 3n).
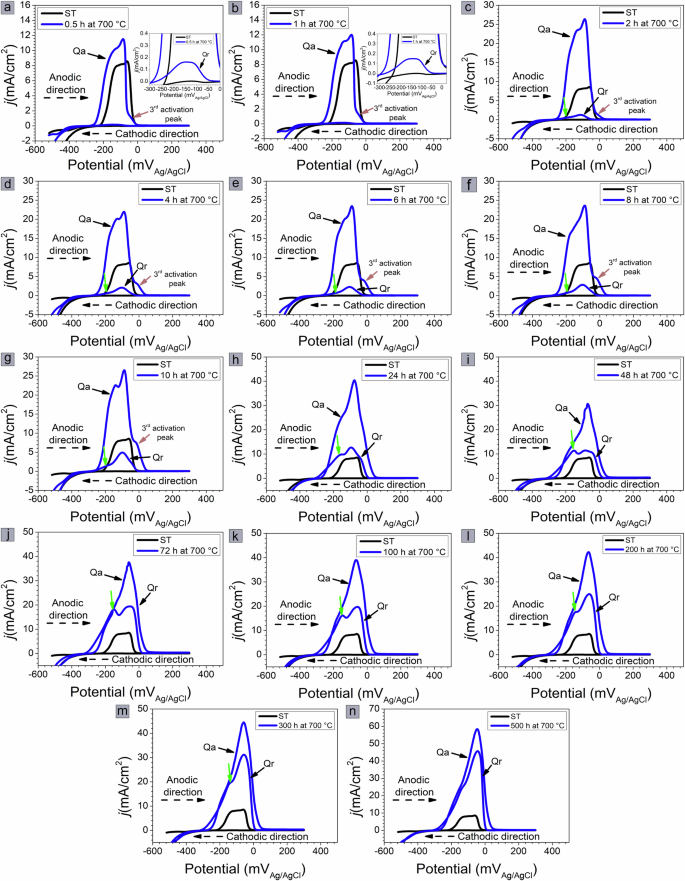
0.5 (a), 1 (b), 2 (c), 4 (d), 6 (e), 8 (f), 10 (g), 24 (h), 48 (i), 72 (j), 100 (k), 200 (l), 300 (m), and 500 h (n).
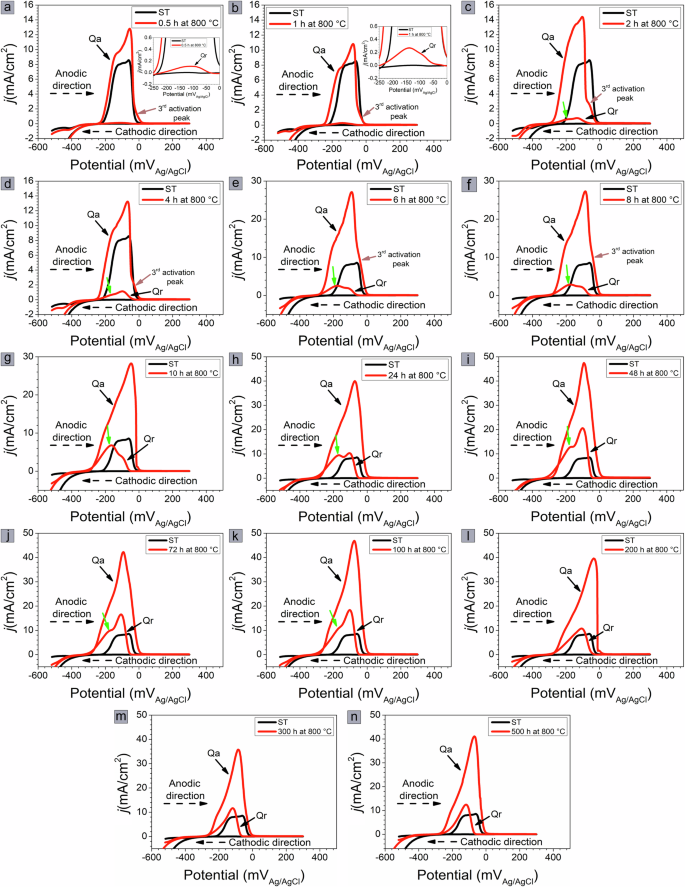
0.5 (a), 1 (b), 2 (c), 4 (d), 6 (e), 8 (f), 10 (g), 24 (h), 48 (i), 72 (j), 100 (k), 200 (l), 300 (m), and 500 h (n).
During the scan in the cathodic direction, a reactivation current peak with a slightly broader shape is observed in the first 30 min of aging at both temperatures, suggesting the presence of two reactivation current peaks. After 2 h at 700 °C (Fig. 2c) and 800 °C (Fig. 3c), two reactivation current peaks are visible located near −90 and −150 mVAg/AgCl. A green arrow in the DL-EPR curves indicates the second reactivation peak. Interestingly, for samples aged at 700 °C for up to 24 h (Fig. 2c–h), the current density of the first reactivation peak increases much more than that of the second reactivation peak. With aging at 700 °C for 48 and 72 h (Fig. 2i and j), the reactivation current densities of the two peaks are close. For aging times >100 h at 700 °C, the current density of the first reactivation peak again increases more than that of the second reactivation peak (Fig. 2k–m).
As for the samples aged at 800 °C, the current density of the first reactivation peak is greater than that of the second reactivation peak for aging times of 2 and 4 h (Fig. 3c and d) This behavior is reversed for aging times of 6–10 h (Fig. 3e–g), and the current density of the second reactivation peak is greater than that of the first reactivation peak. With increasing aging time, the current density of the first reactivation peak is again higher than that of the second reactivation peak (Fig. 3h–k). However, after 500 h at 700 °C (Fig. 2n) and 200 h at 800 °C (Fig. 3l), the reactivation peaks overlap, and only the activation current peak is visible. After 500 h, the peak reactivation current density for the sample aged at 700 °C is more than threefold greater (~46 mA/cm2) than that for the sample aged at 800 °C (13 mA/cm2).
Figure 4a shows the average DOS values for the samples aged at 700 and 800 °C for up to 500 h. These values are compared with the volume fraction of the σ phase formed in the microstructure as a function of aging time and temperature, shown in Fig. 4b. The volume fractions were obtained from the EBSD phase maps provided as supplementary information (Supplementary Figs. 2 and 3) since the amount of σ phase is too small to be detected by XRD in the early stages of aging. Similar behavior of the DOS is observed for both temperatures with increasing aging time up to 48 h, where the DOS increases with increasing aging time. For each aging condition up to 48 h, the average DOS values for the studied temperatures are close, considering the experimental error. However, the volume fraction of the σ phase, which evolves similarly in LDSS 2404 at both temperatures during the first 4 h of aging, becomes significantly higher with exposure at 800 °C for aging times longer than 6 h. After 48 h of aging at 700 °C, the average DOS value continues to increase with increasing aging time and reaches an average value of about 76% after 500 h. For the samples aged at 800 °C, the average DOS value after 48 h is about 43% and decreases for aging times greater than 72 h. After 500 h, the average DOS value is about 31%. It is important to note that the volume fraction of the σ phase formed at both temperatures after 500 h is similar, ~21% at 700 °C and 22% at 800 °C. These values are close to those obtained by quantitative Rietveld phase analysis (Fig. 1).
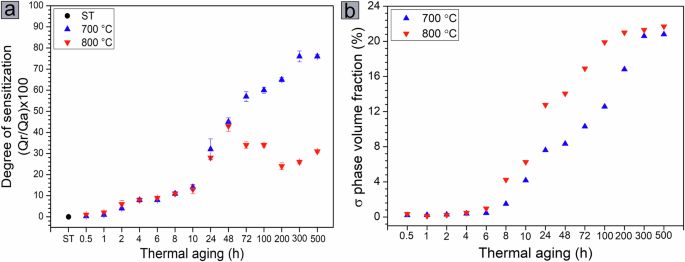
Degree of sensitization for the samples aged at 700 °C and 800 °C for up to 500 h (a) and volume fraction of the σ phase formed in the microstructure as a function of aging time and temperature (b).
Since the DOS evolves similarly with aging up to 48 h at both temperatures, the corrosion attack morphology was examined for early times up to 10 h to identify differences in the corrosion pattern as a function of microstructural evolution, as shown in Fig. 5. Surface morphology analysis was also performed for samples aged at 700 °C for intermediate (48 h) and extended (500 h) times, as presented in Fig. 6, considering the gradual increase in DOS with time. For the samples aged at 800 °C, surface analyses were performed at 48 h (when the highest DOS value was observed), 72 h (when a decrease in DOS value was observed), and 500 h of aging.
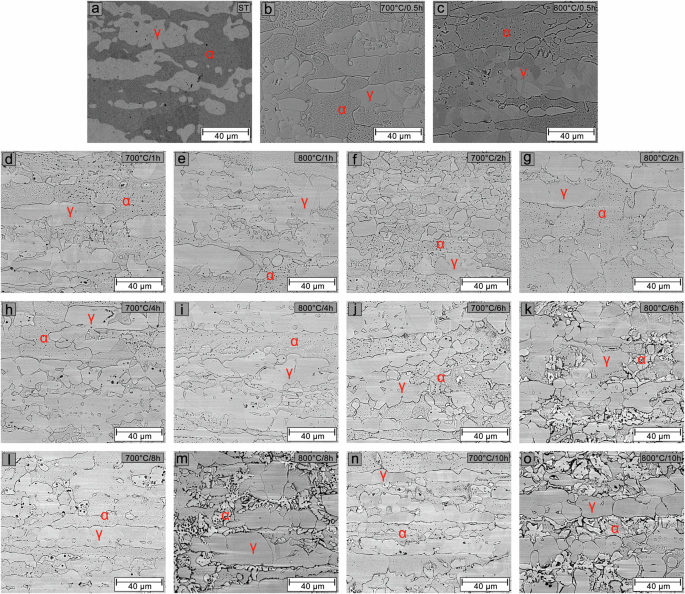
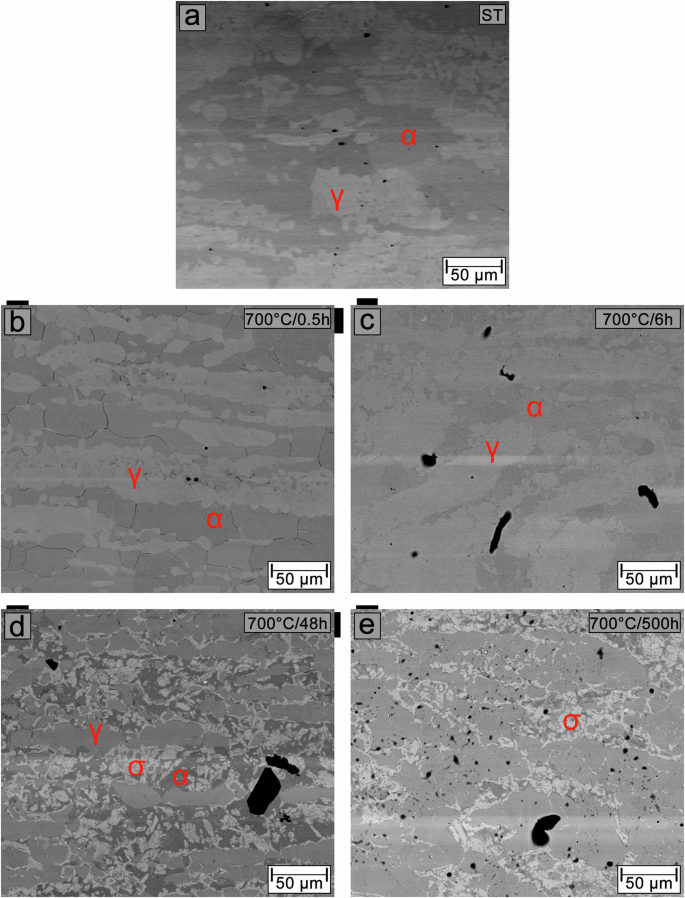
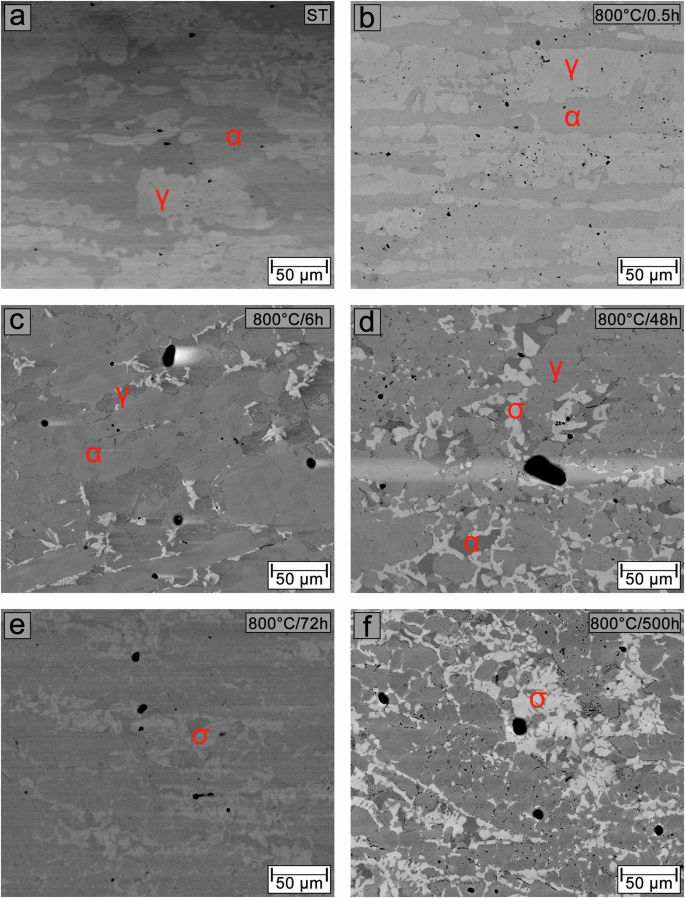
BSE-SEM images of the solution-treated sample (a) and samples aged at 700 and 800 °C for 0.5 h (b, c), 1 h (d, e), 2 h (f, g), 4 h (h, i), 6 h (j, k), 8 h (l, m), and 10 h (n, o), respectively.
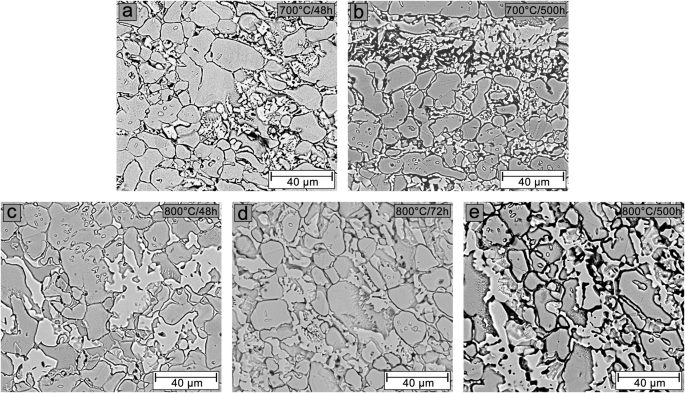
BSE-SEM images of samples aged at 700 °C for 48 h (a) and 500 h (b), and samples aged at 800 °C for 48 h (c), 72 h (d), and 500 h (e).
In the solution-treated sample (Fig. 5a), a slight corrosion attack is observed on the ferrite, which shows a dark coloration. Small pits are also seen at the ferrite/austenite interface, in the ferrite, and within the austenite. The pits observed in the austenite result from localized attacks on small ferrite regions within the austenite, as shown in Fig. 1a. The pit nucleation is due to the composition of the DL-EPR test solution, which contains NaCl. For samples in the initial stages of aging at 700 °C (Fig. 5b, d, f, h, j, l, n), intergranular corrosion is observed at the ferrite grain boundaries and ferrite/austenite interfaces. Along with the corrosion attack within the ferrite, this process intensifies with aging time. Notably, pitting corrosion becomes more pronounced after 8 h (Fig. 5l) and 10 h (Fig. 5n), coinciding with the time when the volume fraction of the σ phase in the microstructure starts to become significant (Fig. 4b). For samples in the early stages of aging at 800 °C (Fig. 5c, e, g, I, k, m,o), a similar corrosion attack pattern is observed as for samples aged at 700 °C for up to 4 h. After 6 h (Fig. 5k), a significant amount of σ phase (bright phase) is present in the microstructure. The corrosion attack occurs preferentially at the ferrite/σ and σ/austenite interfaces, as well as at the ferrite grain boundaries. This corrosion intensifies with aging and progresses further after 8 h (Fig. 5m) and 10 h (Fig. 5o).
After 48 h at 700 °C (Fig. 6a) and 800 °C (Fig. 6c), the ferrite matrix can no longer be distinguished. Corrosion attack is observed around the σ phase, grain boundaries, and phase boundaries, which is more intense in the sample aged at 700 °C. In the sample aged for 72 h at 800 °C (Fig. 6d), the corrosion attack around the σ phase and austenite grain boundaries becomes more intense compared to the sample aged for 48 h at 800 °C (Fig. 6c). However, this corrosion attack is visually less pronounced than observed on the sample aged at 700 °C for 48 h (Fig. 6a). With 500 h of aging, both in the sample aged at 700 °C (Fig. 6b) and at 800 °C (Fig. 6e), the corrosion process is significantly intensified, resulting in complete corrosion of the regions adjacent to the σ phase. It is impossible to determine which samples presented the most severe corrosion attack.
Pitting corrosion
Figure 7a shows the anodic polarization curves for the solution-treated sample and those aged at 700 and 800 °C for 500 h. The corrosion potential (Ecorr) does not vary with aging time and temperature. However, the passive region undergoes significant changes. For the solution-treated sample, a broad passive region is observed, characterized by a partially unchanged passive current density (ipass) up to a potential of 1100 mVAg/AgCl, followed by a sudden and significant increase in current density with further increases in potential. For the samples aged at 700 and 800 °C for 500 h, the passive region (ΔEp = Eb−Ecorr) is quite narrow compared to the solution-treated sample, but the passive region at 800 °C is wider than at 700 °C, as described in Table 2. In addition, anodic current density fluctuations are also observed in the passive region for samples aged for 500 h, indicating the formation of metastable pits that re-passivate with increasing potential until they become stable pits above Eb, leading to an abrupt and sharp increase in anodic current density.
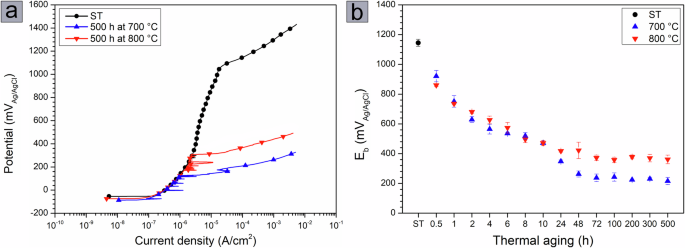
a Anodic polarization curves of the solution-treated sample and samples aged for 500 h at 700 and 800 °C. b Average Eb values determined from the anodic polarization curves as a function of aging time at both temperatures.
Figure 7b shows the average Eb values as a function of temperature and aging time. The average Eb value for the solution-treated sample is about 1147 mVAg/AgCl and decreases with thermal aging. For both aging temperatures, the average Eb values decrease with aging time, remaining essentially unchanged after 48 h at 700 °C and after 24 h at 800 °C. After 500 h of aging, the average Eb value for the 700 °C aged sample is about 168 mVAg/AgCl, while the Eb value for the 800 °C aged sample is about 361 mVAg/AgCl.
Figures 8 and 9 show BSE/SEM images of the preferential pitting sites in the solution-treated sample and samples aged at 700 °C for 0.5, 6, 48, and 500 h and at 800 °C for 0.5, 6, 48, 72, and 500 h, respectively. The morphology of the pitting corrosion process in the sample aged for 6 h at both temperatures was examined because at 800 °C a significant fraction of the σ phase is already present, without significant changes in DOS and Eb values compared to the sample aged at 700 °C. In the solution-treated sample (Figs. 8a and 9a), pitting nucleation occurs within the ferrite (dark phase) and at the ferrite/austenite interfaces. After 0.5 h, the preferential pitting sites remain unchanged. However, the sample aged at 700 °C (Fig. 8b) shows intergranular corrosion of the ferrite. In comparison, the sample aged at 800 °C (Fig. 9b) exhibits a significant increase in pits within the ferrite and at the ferrite/austenite interfaces. After 6 h, pits nucleate and propagate preferentially at the ferrite/austenite interfaces in the sample aged at 700 °C (Fig. 8c). For the sample aged at 800 °C (Fig. 9c), the nucleation of large pits occurs in regions adjacent to the σ phase. Notably, the pit size formed is smaller for the sample aged at 800 °C compared to the sample aged at 700 °C. After 48 h, pitting occurs preferentially in regions adjacent to the σ phase within the ferrite for both the samples aged at 700 °C (Fig. 8d) and 800 °C (Fig. 9d). In the sample aged for 72 h at 800 °C (Fig. 9e), pit nucleation also occurs in regions adjacent to the σ phase, but the size of the pits formed is smaller than in the sample aged for 48 h at 800 °C. After aging for 500 h, it is observed that the size of the pits formed adjacent to the σ phase is significantly larger in the sample aged at 700 °C (Fig. 8e) compared to the sample aged at 800 °C (Fig. 9f). Additionally, the nucleation of many small pits is observed in the sample aged at 700 °C, while intergranular corrosion is visible In the sample aged at 800 °C.
BSE-SEM images of the solution-treated sample (a) and samples aged at 700 °C for 0.5 h (b), 6 h (c), 48 h (d), and 500 h (e).
BSE-SEM images of the solution-treated sample (a) and samples aged at 800 °C for 0.5 h (b), 6 h (c), 48 h (d), 72 h (e), and 500 h (f).
Discussion
The precipitation of Cr2N and Cr23C6 occurs within the first few min of thermal aging at 700 and 800 °C in LDSS 2404 because their incubation times are shorter than the incubation time required for σ phase formation13,25,44,45. Cr2N is predicted to precipitate more than Cr23C6 due to the rapid consumption of available C atoms. In addition, the N content in the steel (0.28 wt%) is about 12 times higher than the C content (0.023 wt%), which allows Cr2N to continue precipitating during long-term aging45. Precipitation of both phases has been observed to occur in regions of lower nucleation energy, such as triple grain boundaries, followed by single interfaces and then twin boundaries45, as also observed in Fig. 1 and Supplementary Figs. 1–3. Cr2N and Cr23C6 precipitation is accompanied by local Cr depletion, which destabilizes the ferrite and leads to the formation of secondary austenite (γ2) in regions adjacent to these precipitates, explaining the formation of austenite phase in regions adjacent to the Cr2N observed in Fig. 1c and e.
As aging time increases, the σ phase forms, depleting Cr and Mo in adjacent regions and leading to the formation of γ2 (Fig. 1c and e). The σ phase was observed shortly after 30 min of aging at both temperatures, as shown in detail in Supplementary Fig. 4. Ferrite/austenite interfaces and ferrite grain boundaries were the preferred sites for σ-phase nucleation, in agreement with previous studies46,47,48. The growth of the σ phase with aging destabilized the ferritic matrix, resulting in an increased amount of γ2. After 500 h of aging, the γ2 volume fraction, the difference between the amount of austenite in the solution-treated and aged samples, is about 6% for the sample aged at 700 °C and about 14% for the sample aged at 800 °C, based on quantitative Rietveld phase analysis (Fig. 1). This phase with reduced Cr content is a preferential site for increased electrochemical activity.
The following discussion begins with an analysis of the intergranular and pitting corrosion mechanisms in LDSS 2404 as a function of the phase transformations during the aging process at temperatures of 700 and 800 °C. Subsequently, the mechanisms involved in the decrease in DOS after 72 h of aging at 800 °C are discussed based on thermodynamic calculations using the CALPHAD approach and DICTRA software.
During the DL-EPR tests on DSSs, two distinct peaks of activation current are common, as observed for both the solution-treated sample and the samples in the early stages of aging at temperatures of 700 and 800 °C (Figs. 2 and 3). These peaks have been attributed to the anodic dissolution of ferrite, which occurs at lower potentials due to its higher Cr content, and austenite, occurring at higher potentials due to its lower Cr content40,49. As for the third peak of activation current found around −20 mVAg/AgCl for the samples in the early stages of aging at both temperatures, it is related to the anodic dissolution of Cr-depleted regions50, in this case γ251.
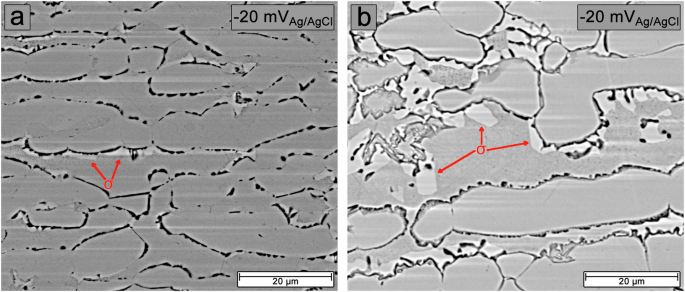
BSE-SEM images of samples aged at 700 °C for 10 h (a) and at 800 °C for 8 h (b).
Figure 10 shows BSE-SEM images of the surface of samples aged at 700 °C for 10 h and 800 °C for 8 h after potentiostatic etching tests for 5 min at a potential of −20 mVAg/AgCl. The current density observed for this third activation peak was the highest in these samples. It can be seen that the appearance of this third activation peak is due to anodic dissolution occurring at both grain boundaries and phase boundaries. These are sites where Cr2N, Cr23C6, and σ phases have formed, leading to γ2 formation due to Cr and Mo reduction in adjacent regions. It is, therefore, plausible that this third reactivation peak results from the dissolution of γ2. Notably, the dissolution at γ2 sites was more severe for the sample aged at 700 °C than at 800 °C, indicating greater Cr and Mo depletion for this sample.
The distinction between the three activation current peaks was lost in samples with longer aging times due to a smaller variation in Cr content between ferrite, primary austenite, and γ2. However, γ2 is still the phase with the lowest Cr content. This is due to the growth of the σ phase, leading to Cr and Mo depletion in the ferrite and then in the austenite, which has a slower Cr and Mo diffusion coefficient than the ferrite phase45,52. The reduction in the Cr and Mo gradients resulted in a single consolidated activation current peak, whose activation peak current densities tended to increase with aging time at both temperatures. According to the literature53, the lower the Cr content in the chemical composition of the stainless steel, the higher the critical current density (icrit) [and also the primary passivation potential (Epp)] required for the formation of a passive film, resulting in higher current density values at Epp during polarization measurements in an acidic environment (in this case, sulfuric acid). Thus, as Cr depletion progresses in regions adjacent to the σ phase during thermal aging, higher values of icrit and Epp are required for these sites to form a passive film.
In the cathodic direction scan, the reactivation current peak appears due to corrosion of the Cr-depleted regions. This means that in the solution-treated sample, the slight corrosion attack on ferrite (Fig. 5a) is due to a galvanic corrosion process in which ferrite, because of its lower Ni content compared to austenite, preferentially dissolves in acidic solutions54. However, since the passive film formed during polarization is stable enough to prevent its dissolution during scanning in the cathodic direction, this behavior resulted in an insignificant reactivation peak (Fig. 2a and 3a). In the sample aged for 0.5 h at both temperatures, a broad reactivation peak was observed due to the presence of two overlapping reactivation peaks (Figs. 2a and 3a). Corrosion attack occurred in ferrite due to the galvanic corrosion process and at ferrite grain boundaries and ferrite/austenite interfaces (Fig. 5b, c) due to precipitation of Cr2N, Cr23C6, and σ phase resulting in the aforementioned Cr and Mo depletion.
After 2 h of aging, two reactivation current peaks near −90 and −150 mVAg/AgCl were observed for most aging times at 700 and 800 °C (Figs. 2 and 3), with the magnitude of the reactivation current densities alternating with increasing aging time. Figure 11 shows BSE/SEM images of the surface of samples aged for 24 h at 700 and 800 °C after potentiostatic etching for 5 min at the found reactivation potentials. It is observed that the reactivation current peak near −90 mVAg/AgCl is due to a corrosion attack at the grain and phase boundaries (Fig. 11a and b). In comparison, the reactivation current peak near −150 mVAg/AgCl is due to corrosion attack in regions adjacent to the σ/γ2/ferrite interfaces (Fig. 11c and d).
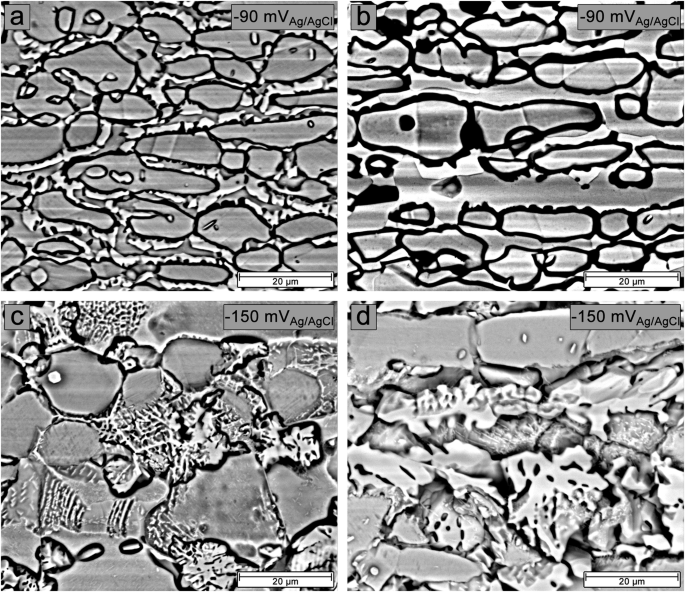
BSE-SEM images of samples aged for 24 h at 700 °C (a–c) and 800 °C (b–d) after potentiostatic etching at −90 mVAg/AgCl and −150 mVAg/AgCl, respectively.
The variation in the magnitude of the current densities of the two reactivation peaks is related to the microstructural evolution at both temperatures with increasing aging time. In the early stages of thermal aging at both temperatures, the precipitation of Cr2N, Cr23C6, and the σ phase led to preferential corrosion attack in Cr- and Mo-depleted regions located at grain and phase boundaries (Fig. 5), resulting in a reactivation peak current density near −90 mVAg/AgCl that was higher than that near −150 mVAg/AgCl. After 6 h of aging at 800 °C, the rapid growth of the σ phase (Fig. 4b) caused significant Cr and Mo depletion in the ferrite, leading to corrosion attack in the regions adjacent to the σ/γ2/ferrite interfaces (Fig. 5k) and a higher current density of the peak near −150 mVAg/AgCl compared to the peak near −90 mVAg/AgCl. However, no significant increase in DOS was observed compared to the sample aged at 700 °C (Fig. 4a). Similar behavior was observed only in samples aged at 700 °C after 48 h of aging (Fig. 2i) due to the slow σ phase growth kinetics at 700 °C. Although the current density of the peak near −150 mVAg/AgCl was higher than near −90 mVAg/AgCl at these aging times, the peak current density near −90 mVAg/AgCl also increased. This increase was caused by the depletion of Cr and Mo at the σ/austenite interfaces and the increase in the amount and size of Cr2N precipitates with aging time, especially for samples exposed at 800 °C, as shown in Supplementary Figs. 2 and 3. This behavior resulted in a corrosion attack around the σ phase, grain boundaries, and phase boundaries in the samples aged for 48 h at 700 °C (Fig. 6a) and 800 °C (Fig. 6c), which was more intense for the sample aged at 700 °C.
With increasing aging time, the current density of the reactivation peak near −90 mVAg/AgCl reached much higher current density values than that of the reactivation peak near −150 mVAg/AgCl at both temperatures, indicating that gradual Cr and Mo depletion at the σ/austenite interface caused the increase in DOS with increasing aging time. In samples aged at 800 °C, the current density of the reactivation peak near −90 mVAg/AgCl decreased after 72 h (Fig. 3j–n), resulting from a partial recovery of the intergranular corrosion resistance, which can indicate a partial healing process due to Cr and Mo diffusion from the ferrite bulk to the depleted regions. However, no significant difference in corrosion attack morphology was observed between samples aged for 500 h at 700 °C (Fig. 6b) and 800 °C (Fig. 6e), which is due to the presence of Cr- and Mo-depleted regions at σ interfaces.
The average DOS values obtained as a function of temperature and aging time are consistent with pitting corrosion performance. In the solution-treated sample, whose DOS value was 0.1% (Fig. 4), the Eb value was the highest, about 1136 mVAg/AgCl (Table 2). It is important to mention that the anodic polarization curve for this sample (Fig. 7a) showed characteristics of transpassivation, in which the current density gradually and steadily increases at high electrode potential values. In such a condition, the pits were induced by transpassivation40,55,56,57. Pitting nucleation in the solution-treated sample (Fig. 8a) at the ferrite/austenite interfaces was due to the heterogeneity and segregation of elements that occur at these locations, favoring passive film breakdown58, while pitting nucleation within the ferrite was due to its lower PREN value (28) compared to austenite (30), as previously reported40.
With thermal aging at 700 and 800 °C, the DOS values were about 0.3% and 1%, respectively, just after 0.5 h. Although these values are low due to the small area fraction of the Cr2N, Cr23C6, and σ phases relative to the total area of the samples, these fine precipitates reduced the passive region by about 18% at 700 °C and 20% at 800 °C. This was caused by intergranular corrosion of the ferrite and increased pits within the ferrite and ferrite/austenite interfaces for both samples. DOS and Eb values were similar and followed the same trend with aging time up to 48 h at both temperatures, although the kinetics of σ phase formation and growth was faster at 800 °C, resulting in a significant amount of this phase after 6 h. This suggests that the partitioning of Cr and Mo from the ferrite bulk to the depleted regions, which is essential for self-healing, starts well before 72 h of aging. However, the DL-EPR test could not detect it in the early stages. Anodic polarization tests confirmed this hypothesis since the average Eb values do not change significantly after 24 h at 800 °C. The reduction in the passive region with aging for 48 h was ~73% at 700 °C and 61% at 800 °C, which is consistent with a slightly smaller pit size formed in regions adjacent to the σ phase in the sample aged at 800 °C (Fig. 9d) compared to the sample aged at 700 °C (Fig. 8d).
After 72 h at 800 °C, the DOS started to decrease and reached a value of 31% after 500 h, which contributed to the reduction of the size of pits formed (Fig. 9f). However, due to the dilution of the Cr and Mo contents in the matrix, the self-healing process cannot promote an increase in the pitting corrosion resistance, so the passive region does not change during long-term aging. For samples aged at 700 °C, the passive region also does not change after 48 h of aging. However, the DOS reaches about 76% after 500 h, indicating that the Cr- and Mo-depleted sites have reached a critical value below which the pitting corrosion resistance does not change with long-term aging. The pit sizes adjacent to the σ phase (Fig. 8e) were much larger than those observed in the sample aged at 800 °C. The increased volume fraction of Cr2N, which reached about 2.3% at 700 °C and about 3.6% at 800 °C, was responsible for the nucleation of many small pits in the sample aged at 700 °C and the intergranular corrosion observed in the sample aged at 800 °C after 500 h. Although long-term Cr2N precipitation contributes to increased DOS and decreased Eb at both temperatures, its effect is minimal compared to the significant volume fraction of the σ phase formed.
Figure 12 shows the Cr and Mo profiles recorded throughout the computational cell for thermal aging up to 500 h at 700 and 800 °C. Table 3 shows the Cr and Mo contents predicted by the DICTRA calculations for the ferrite/austenite interface in the solution-treated sample and the ferrite/σ and σ/austenite interfaces for the samples aged for 48 and 500 h at both temperatures. The equilibrium condition determines the composition profile of the ferrite and austenite phases in the solution-treated sample, whose predicted values of Cr and Mo contents are close to those determined by EDS chemical composition analysis (24.49 wt% Cr and 1.41 wt% Mo for ferrite; 22.43 wt% Cr and 1.23 wt% Mo for austenite) in the previous study40. Cr and Mo depletion (shown as a triangular or rectangular shape) and the composition gradient for these elements adjacent to the σ phase are predicted to be more pronounced during aging at 700 °C (Fig. 12a, b) than at 800 °C (Fig. 12c, d). This finding is consistent with the higher DOS and lower Eb values for long-term aged samples at 700 °C. DICTRA calculations show that for samples aged at 700 °C, a reduction in Cr depletion at the ferrite/σ interface is expected after 24 h (Fig. 12a). However, this decrease is insufficient to reduce the DOS as Mo depletion is predicted to increase with increasing aging time (Fig. 12b). At the σ/austenite interface, Cr depletion is predicted to remain constant with aging time, while Mo depletion is expected to gradually increase with thermal aging (Table 3).

Compositions profiles of Cr and Mo during the formation and growth of the σ phase at the austenite/ferrite interface, obtained from DICTRA calculations, with aging time at 700 °C (a, b) and 800 °C (c, d), respectively. Austenite is the phase on the right side of the plot, ferrite is on the left, and σ is at the interface.
For samples aged at 800 °C, DICTRA calculations indicate that the diffusion of Cr and Mo from the ferrite bulk into the depleted regions adjacent to the σ phase began after 6 h, with a reduction in Cr depletion at the ferrite/σ interface (Fig. 12c), which became significant with the reduction in Mo depletion predicted to occur after 24 h (Fig. 12d). This behavior accounts for the similar DOS values at both temperatures up to 48 h, even with the faster σ phase growth kinetics at 800 °C. It also supports that the average Eb values do not change significantly after 24 h at 800 °C, confirming that the self-healing process starts earlier than 72 h of aging (Fig. 4), as indicated by DL-EPR tests. The early diffusion of Cr and Mo into the regions depleted of these elements adjacent to the σ phase, even before it reaches its thermodynamic equilibrium condition, seems to be associated with the higher aging temperature, which promotes the diffusion of Cr and Mo during the growth of the σ phase. However, this self-healing process resulted in only a partial recovery of the intergranular corrosion resistance, which can be explained by the following reasons: (i) the depletion in Cr and Mo at the σ/austenite interface is predicted not to decrease with aging up to 500 h (Table 3), and this interface continues to corrode with long-term aging, as shown by electrochemical tests, and (ii) the Cr and Mo contents in the ferrite are predicted to stabilize at much lower levels than in the solution-treated sample. Such behavior results from the intense consumption of Cr and Mo with the growth of the σ phase, which leads to an increase in the extent of the depleted region of these elements. In this sense, the availability of Cr and Mo around this depleted region is insufficient to reduce the concentration gradient, resulting in the diffusion of these elements from the interior of the ferrite into these depleted regions, causing a dilution of Cr and Mo levels in the ferrite.
The Cr and Mo profiles obtained from DICTRA calculations support the electrochemical corrosion behavior of LDSS 2404 after prolonged aging at 700 and 800 °C, demonstrating its effectiveness in evaluating the depletion of Cr and Mo due to the growth of the σ phase and further clarifying the electrochemical corrosion mechanism discussed in this study. Considering that the determination of Cr and Mo concentration profiles in regions adjacent to the σ phase by SEM/EDS is difficult due to the resolution limit of this technique, and transmission electron microscopy (TEM/EDS) is time-consuming and expensive, DICTRA calculations turn out to be a practical and economical alternative for estimating composition profiles in the vicinity of the σ phase.
In summary, this study has investigated the intergranular corrosion mechanism of LDSS 2404 long-term aged at 700 and 800 °C by DL-EPR tests. The electrochemical results show good reproducibility, corroborate the surface morphological changes after corrosion, and agree with thermodynamic and kinetic calculations. It is shown that thermal aging of LDSS 2404 at 700 and 800 °C promotes Cr23C6, Cr2N, and σ precipitation and γ2 formation as a result of Cr and Mo depletion in adjacent regions. The growth of the σ phase with aging time at 700 °C leads to a sharp increase in DOS and a low Eb value in LDSS 2404. At 800 °C, a recovery of the Cr and Mo depleted regions in the ferrite/σ interface due to the self-healing process contributes to a significant reduction in DOS after 72 h and stabilization of Eb after 24 h at higher electrode potentials. The full recovery of the intergranular corrosion resistance of LDSS 2404 by the self-healing process does not occur due to the high consumption of Cr and Mo as the σ phase grows, resulting in the dilution of these elements in the ferrite bulk during the diffusion process towards the depleted regions. In addition, the corrosion process at the σ/austenite interface is intensified with long-term aging. DICTRA calculations and DL-EPR tests for quantitative measurement of DOS effectively evaluate the depletion of Cr and Mo caused by the growth of the σ phase, providing a deeper understanding of the intergranular corrosion mechanism.


Responses