Mechanisms of meteorological drought propagation to agricultural drought in China: insights from causality chain

Introduction
Drought, an inevitable natural phenomenon and one of the most devastating hazards worldwide, often leads to significant socioeconomic and ecological losses1. Meteorological droughts primarily occur due to below-average precipitation levels. The subsequent propagation of meteorological droughts throughout the hydrological cycle, marked by limited precipitation and enhanced atmospheric dryness, leads to decreased soil moisture. This, in turn, affects crop growth and leads to agricultural drought2,3. This subsequent decrease in soil moisture further diminished surface runoff or base flow, resulting in hydrological drought4. The fundamental nature of drought propagation lies in a causal relationship5,6,7. Macroscopically, this relationship exists between meteorological drought and agricultural drought, as meteorological drought causes agricultural drought5. Microscopically, it also involves a causal linkage among various meteorological variables8. Therefore, understanding the linkage between meteorological and agricultural droughts is crucial for attributing the causes of agricultural drought hazards and mitigating adverse consequence9.
Since 1980, stress on global water resources has been rising, primarily attributed to population growth, socio-economic advancements, and shifting consumption patterns. This trend is particularly pronounced in agricultural-reliant nations like China10, indicating increased challenges to maintain food security in the country. The wave of industrial modernization has led to a surge in productivity, subsequently driving up demand for water resources in both the energy and industrial sectors11. Traditionally, agricultural droughts triggered by meteorological droughts with significant precipitation deficits are seen as linear relationships12. However, accelerated groundwater extraction and a constant increase in production and domestic water supply have shortened the drought propagation duration, intensifying drought nonlinear propagation. This means that even mild meteorological droughts can now trigger severe agricultural droughts13. Water shortages in agricultural irrigation exacerbate the risk of agricultural droughts, amplifying their impact on agriculture and posing a significant threat to food security14,15.
Drought propagation is the transition of drought indicators from meteorological conditions to alternative forms of drought within the terrestrial segment of the overall hydrological cycle, according to Van Loon16. In recent years, the development of causal analysis methods provided new perspectives for exploring this issue. These methods are capable of identifying and determining causal relationships between two time series variables, demonstrating significant applicability in the elucidating of drought propagation relationships6. Previous studies have demonstrated a significant causal connection between drought-related meteorological variables, notably precipitation (P) and soil moisture (SM)17,18. Furthermore, the reciprocal feedback among these variables can facilitate drought propagation. The transition from meteorological drought to agricultural drought represents the agricultural system’s response to meteorological drought13.
Due to the difficulty and complexity of interpreting drought propagation phenomenon, previous research often assumed a linear relationship between meteorological and agricultural droughts, presuming that agricultural droughts were solely dependent on the propagation of meteorological droughts13,19. However, recent studies have revealed the intricate nature of these relationships. For instance, Wang et al.20 found that agricultural droughts may undergo nonlinear amplification or diminishment due to meteorological drought propagation, indicating the presence of hidden complexities. Dai et al.21 explored the propagation characteristics and mechanisms from meteorological to agricultural drought in various seasons and noted that the transition is influenced by multiple factors, suggesting nonlinearity. All these observations suggest that the transition from meteorological to agricultural drought is intricate and nonlinear22,23. Predicting drought nonlinear propagation, which is more challenging and needed than linear propagation, as drought nonlinear propagation often leads to significant losses12.
In order to further analyze the nonlinear propagation mechanisms of droughts, numerous scholars have made various attempts. Fang et al.24 utilized mutual information (MI) based on entropy theory to detect the nonlinear and chaotic dependencies in the propagation from meteorological drought to hydrological drought. Zhou et al.12 introduced the directed information transfer index (DITI) to study the nonlinear dependence, establishing the relationship between the characteristics of meteorological and hydrological droughts. Zhao et al.13 further detected nonlinear information about drought propagation time and rate using a nonlinear dynamic system and chaos theory, providing new perspectives on the complexity of drought propagation. However, most studies are limited to relatively small research areas and primarily focus on the analysis and quantification of non-linear propagation characteristics of drought, lacking in-depth exploration of the non-linear propagation mechanisms and their driving factors.
Despite these efforts, there is still a lack of systematic and comprehensive studies that differentiate between linear and nonlinear drought propagation across China, elucidate the reasons for regional variations, and provide a unified and reliable methodology for analyzing nonlinear propagation mechanisms. This study aims to fill these gaps by establishing a causality chain to identify the propagation paths of droughts. Specifically, the Standardized Precipitation Evapotranspiration Index (SPEI) and the Standardized Soil Moisture Index (SSMI) are utilized to represent meteorological and agricultural droughts, respectively. The Convergent Cross Mapping method is employed to analyze the nonlinear propagation pathways and features of drought, which is a novel approach in this research field5,17. Machine learning models based on the XGBoost algorithm are utilized to investigate the driving and influencing factors of drought propagation, considering significant factors such as the linear Drought Propagation Time (DPT). These methods can robustly explain the linear and nonlinear dependencies in drought propagation. By comprehensively examining drought propagation characteristics and mechanisms, this study provides valuable insights for regional decision-making in drought prevention and mitigation.
Results
Drought propagation time, counts and intensity
Based on the maximum Pearson correlation coefficient (MPCC) method, we studied the delayed impact of drought propagation, with a specific focus on the linear propagation time from meteorological drought to agricultural drought, as depicted in Fig. 1a. The findings revealed that the propagation of meteorological drought to agricultural drought in China is primarily concentrated within a two-month period, encompassing approximately 71.46% of the total area. Meteorological drought induces a decline in terrestrial moisture, subsequently indicating a reduction in soil moisture (SM). Notably, these changes occur rapidly, with the linear drought propagation time (DPT) being less than one month in nearly one-third of the region, providing robust support for this observation. Furthermore, the linear response of agricultural drought to meteorological drought demonstrated a high sensitivity, with an average correlation coefficient of 0.7 (Fig. 1b). Nevertheless, it is worth noting that in certain water-limited regions, such as the central area of Tibet, the time for linear drought propagation may be prolonged due to constraints in water availability, resulting in a longer required period for drought propagation. Through a comprehensive assessment, this study employed the SPEI of 1-month scale to construct a causal chain that links the propagation of meteorological drought to agricultural drought. This approach aims to provide more timely guidance for agricultural production and water resource management.

a Drought propagation time (DPT), b linear correlation relationship, c drought propagation counts (DPCs), d drought intensity propagation index (DIP) of metrological drought propagation to agricultural drought in China from 2000-2018, e DIP and DPCs of metrological drought propagation to agricultural drought under different dry-wet areas. The orange, yellow, light green, and dark green panels in the figure represent the extents of the arid, semi-arid, semi-humid, and humid regions in China, respectively.
During the period from 2000 to 2018, the average number of drought propagation events in China was approximately 25, demonstrating significant regional variations. Notably, the eastern regions of the country experienced a comparatively higher frequency of drought propagation, while the western regions, particularly the Qinghai-Tibet Plateau region, experienced fewer occurrences. The observed pattern of drought propagation aligns with the spatial distribution of wet and dry conditions across China, where wetter areas tend to exhibit a higher frequency of drought propagation events, compared to dryer regions.
The spatial distribution of drought intensity in China is presented in Fig. 1d. A stronger drought propagation indicates a more comprehensive transition from meteorological drought to agricultural drought. With an average DIP of 1.09, China experiences a peer-to-peer drought propagation level overall. The distribution pattern highlights a greater intensity of propagation in humid area compared to arid ones (Fig. 1e), indicating that areas with frequent drought occurrences also exhibit more extensive drought propagation. Nevertheless, specific regions, notably the central region of the Qinghai-Tibet Plateau, exhibit significantly heightened drought propagation intensity. This phenomenon may be attributed to various factors such as altitude, soil texture, and topography of the plateau region. These elements influence P distribution and impede water infiltration into the soil, subsequently exacerbating soil drought in the region25.
Causality chain of drought propagation
A causality chain has been meticulously established to illustrate the process of drought propagation, taking into account various meteorological factors (Fig. 2a). Meteorological drought, which often acts as the precursor to other types of drought, typically stems from fluctuations in temperature. Both Potential Evapotranspiration (PET) and Precipitation (P) are highly sensitive to temperature changes. On one hand, PET demonstrates a positive correlation with temperature variations. On the other hand, the increase in temperature elevates VPD, enhancing the atmospheric water storage capacity and exacerbating the deficit of land water, thereby intensifying meteorological drought. Concurrently, fluctuations in both P and PET also lead to rapid variations in SM, subsequently altering the agricultural drought conditions. To validate the constructed causality chain for drought propagation, the Causality Chain Model (CCM) was employed.
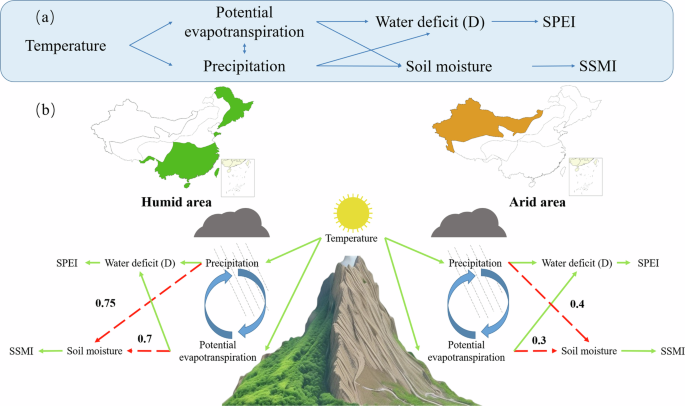
a Causality chain and the involved variables. b Causality chain of drought propagation in humid area and arid area. The solid green line in the figure indicates a strong causal relationship (cross mapping skill greater than 0.9), and the red dashed line points out the causal relationship difference between humid and arid area. Cross mapping skill was calculated by CCM, details refer to Figs. 8 & 9 and Figs. S1 & S2.
Temperature exerts a substantial influence on both P and PET across various areas, playing a pivotal role in the drought dynamics (Figs. S1-S2). Even in arid area, there exists a significant causal relationship between temperature and P (Cross mapping skill reaching approximately 0.9, p < 0.01, Fig. S1). Additionally, both the theoretical analysis and the results of causality test also highlight a strong influence from temperature to PET. The main differences among these four areas lie in the interdependencies between P and SM, as well as between PET and SM (Fig. 3).
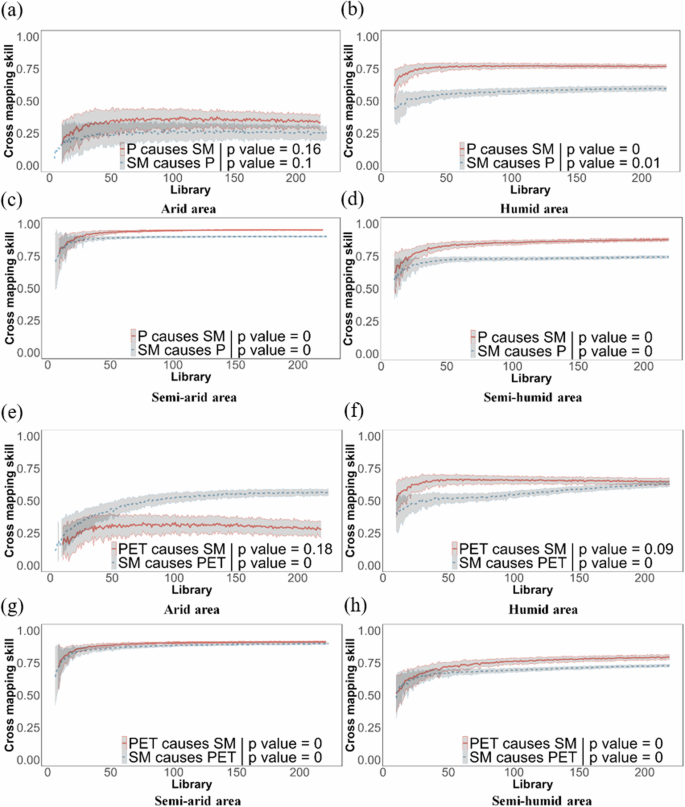
a–d P and SM, e–h PET and SM.
The significance of the cross-mapping skills is notable, reaching a value of 0.75 (with p = 0.02) in humid area where P is abundant, changes in soil moisture (SM) rely more heavily on P. Consequently, when P levels decrease in these areas, SM rapidly changes, leading to agricultural drought. This explains the generally faster drought propagation time (DPT) in humid area compared to arid area. Furthermore, the causal relationship between PET and SM explains the regional disparities in drought propagation (as shown in Fig. 3e–h). In arid area with water scarcity, PET is unlikely to result in significant changes due to water limitations. However, in humid area with abundant water, an increase in PET will swiftly trigger alterations in SM. The cross-mapping skills between PET and SM reach a value of 0.7 (with p < 0.01).
The combined causal relationships among P, PET, and SM account for the regional differences in drought propagation. To quantitatively observe the nonlinear drought propagation under different dry and wet conditions, cross-mapping skills between P, PET, and SM were calculated for all grid points in China. Grid points with statistically significant causal relationships (p < 0.05) were identified, and a statistical analysis of the AI and cross-mapping skills for these points was conducted (Fig. 4). In arid and semi-arid regions (AI values range from 0 to 0.5), the causal relationship between P and SM is particularly sensitive to changes in regional humidity. As AI increases, this causal relationship is significantly strengthened, indicating a pronounced enhancement in the nonlinear propagation of drought. This causal relationship begins to stabilize when AI is above 0.5, reaching a plateau rather than further growth. A similar pattern is observed in the relationship between PET and SM. This once again underscores the close correlation between the nonlinear intensity of drought propagation and the regional moisture status and changes in moisture conditions12.
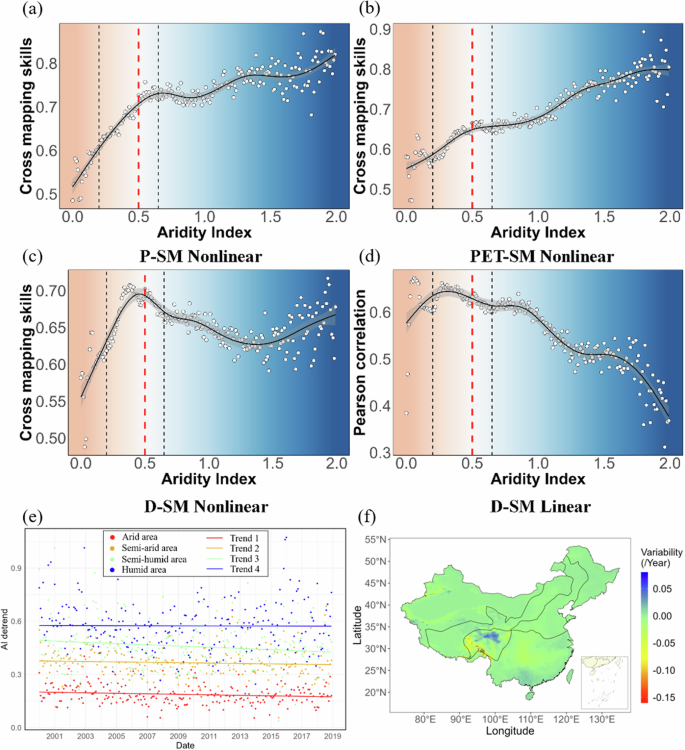
a P-predicted SM. b PET-predicted SM. c D-predicted SM. d Linear correlation between D and SM. e AI after removing the seasonal trend in different regions. f Spatial distribution of annual variation rates of AI.
Also, as shown in Fig. 4, the dependency between meteorological factors and SM determines the strength of drought propagation. The stronger the dependency, the higher the risk of drought propagation. In other words, a stronger dependency between water deficit (D) and SM indicates a faster land-atmosphere water exchange rate. If there is an anomaly in either side of the land-atmosphere water exchange, it can easily lead to a cascading effect. This also implies that in humid area with a faster land-atmosphere water exchange rate, drought propagation is more likely to occur.
Drivers and impact factor of drought propagation
XGBoost was used to simulate the DPCs in different areas, and the model developed has a good prediction effect. (R2 > 0.75, Fig. 5a–d). Significant alterations in P and PET have resulted in meteorological drought (Fig. 6a–d). As temperatures continue to rise, the intensification of meteorological drought further impacts SM, ultimately leading to agricultural drought. However, there are certain factors that can hinder this causal process, including runoff and vegetations. Temperature significantly influences the rate of evapotranspiration from terrestrial water bodies, resulting in variations in soil moisture content, which subsequently affects the propagation of drought. When considering DPCs as the target variable, the SHAP values of temperature across all areas consistently indicate its unparalleled importance in drought propagation, making it the primary determinant of drought propagation frequency (as shown in Figs. S3–S6).
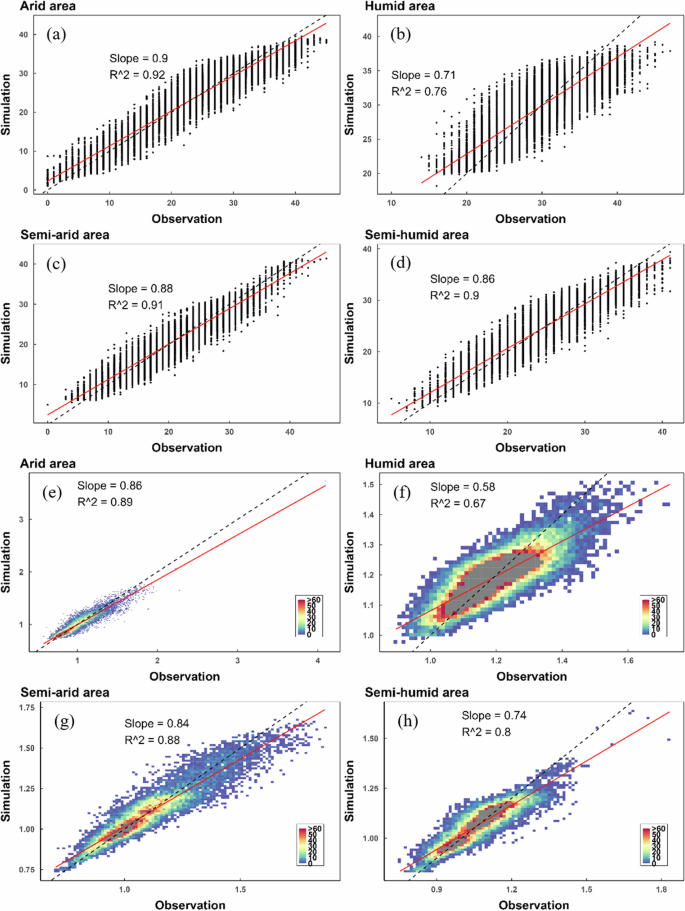
a–d DPCs, e–h DIP.
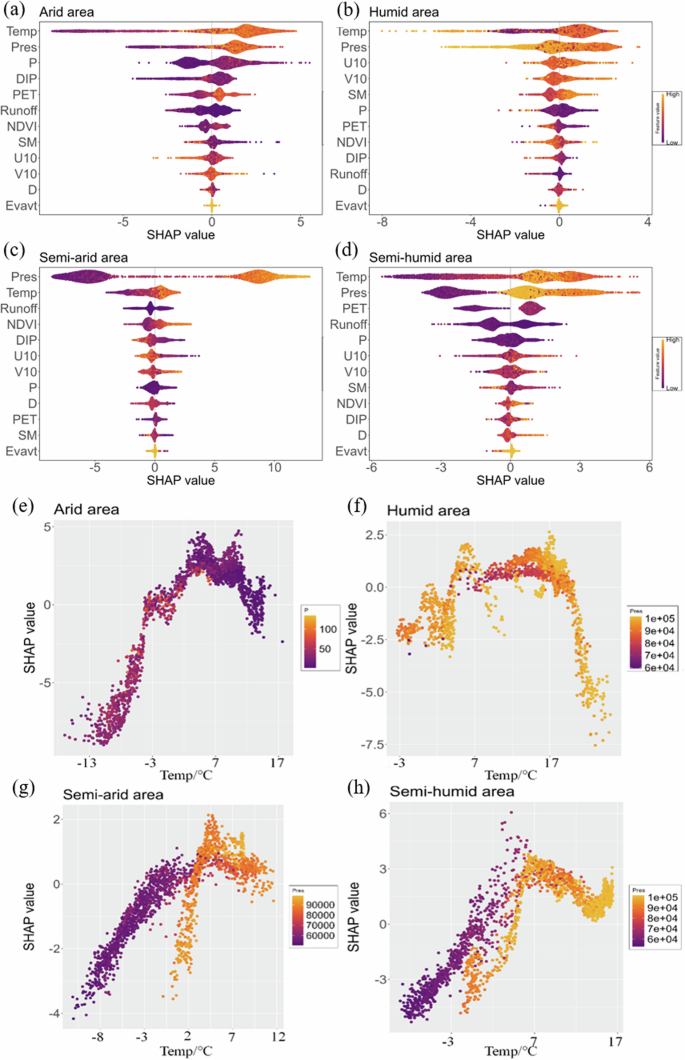
a–d Corresponding contribution of multiple variables. e–h SHAP values for regionalised differences of DPCs explained by temperature.
In addition to the factors already considered within the causal chain of drought propagation, surface air pressure emerges as a significant influencer, surpassing even P and SM. This is because surface air pressure interacts with temperature (as shown in Fig. 6e–h). The calculation and description of evapotranspiration using the Penman-Monteith method also suggest that surface pressure controls the actual water vapour pressure26. Furthermore, surface pressure, in conjunction with temperature, controls changes in VPD, which affects P and ET, and thereby drought propagation, by influencing the atmospheric demand for moisture27. In nearly all areas, temperature and surface air pressure are mutually dependent and together dominate drought propagation by influencing P and PET (Fig. 6e–h). These two variables account for over 50% of the occurrences of drought propagation. Additionally, the impact of runoff on drought propagation is observed to be more pronounced in arid area compared to humid area, indicating increased sensitivity to water availability in arid area. In these areas, runoff plays a more significant regulatory role in drought propagation than in humid area.
The XGBoost model can likewise simulate DIP in different areas (R2 > 0.65, Fig. 5e–h), the contribution of temperature on the intensity of drought propagation diminishes as water availability decreases, especially in arid and semi-arid area (Figs. S7–S10). External moisture, such as P, and runoff in arid area, regulate the propagation of drought significantly more than in humid area, which may be due to the fact that evapotranspiration from the humid area consumes part of the water from P and runoff. Compared to arid area, humid area appears to have more frequent land-air moisture exchange due to the coupling of various factors, and sufficient moisture amplifies the effects of various factors on the propagation of drought, making the process more complex (Fig. 7). But in dry-wet transition area, runoff and soil moisture becomes particularly important factors. This suggests that the primary factors influencing these water deficit areas are the water storage attributes of the area, specifically the available water content. Unlike humid area with frequent rainfall, these areas exhibit the unique characteristic that the intensity of drought propagation is strongly influenced by runoff and SM, and that changes in DIP are more related to their own water storage capacity. On the contrary, in humid area, DIP is more affected by variable meteorological factors and is prone to erratic behavior, which in turn triggers severe drought propagation and even flash droughts.
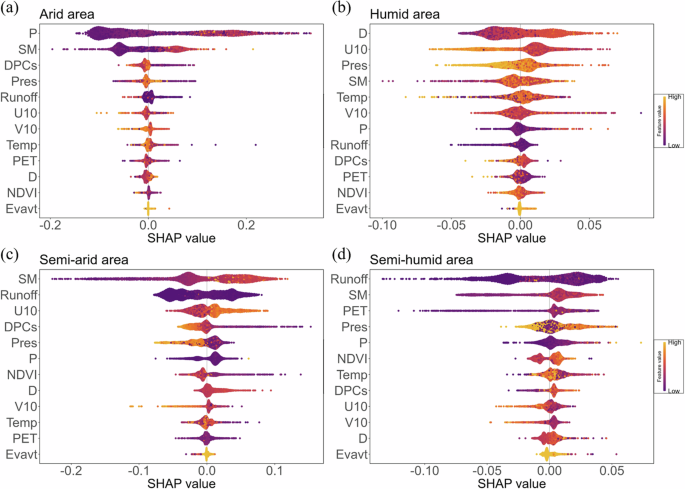
a Arid area. b Humid area. c Semi-arid area. d Semi-humid area.
Discussions
Previous research on drought propagation has primarily relied on linear assumptions, which align with practical realities, as reported by Dai et al.22. However, the drought propagation process can be both linear and nonlinear, as emphasized by Zhao et al.13 and Guo et al.4. The inherent causality of drought nonlinear propagation is emphasized by Shi et al.5. The current study aims to construct a causal chain for drought propagation, revealing the contributing factors to regional disparities in drought nonlinear propagation. The CCM method is primarily utilized to detect nonlinear causal relationships, specifically in terms of drought propagation paths based on meteorological variables. This approach offers a complementary perspective to the field of drought nonlinear propagation research. Nevertheless, it is important to acknowledge the coexistence of drought linear propagation, as pointed out by Yu et al.28. Therefore, we conducted a statistical analysis of linear correlation coefficients using AI to investigate the relationship between regional wet and dry conditions (Fig. S11). The findings suggest that as the wetness of the area increases, the drought linear propagation risk will gradually decrease. This indicates that inconsistencies in regional moisture conditions play a key role in drought propagation29. The drought nonlinear propagation is in fact the result of the exacerbation (or mitigation) of drought propagation due to other factors affecting drought propagation (e.g., wind speed, vegetation), thus exhibiting non-linearity of propagation. This exacerbating (or mitigating) effect is manifested by affecting the exchange of moisture13,25, and thus drought nonlinear propagation is gradually diminished as the amount of moisture decreases.
The sensitivity of SM to P offers the most straightforward explanation for drought propagation19. Our findings indicate that the stronger causal relationships among P, PET and SM in humid area contribute to more severe drought propagation compared to arid area. This aligns with the patterns identified by Li et al.29. Nevertheless, the water exchange process between soil and the atmosphere is influenced not only by PET and P30, but also modulated by various other factors, including groundwater flows31. The altered water linear response between soil and the atmosphere in arid area was more pronounced, with a weaker nonlinear response. This variation was not solely attributed to local moisture conditions, but may also be linked to regional elevation, soil slope, and texture32.
Our research indicates that temperature and surface air pressure are the primary driving factors influencing the propagation of meteorological drought into agricultural drought (Figs. 6–7). From a physical standpoint, increased temperature exacerbates the evaporation of water vapor, altering its content in the atmosphere and subsequently disrupting precipitation formation and distribution patterns33. This directly reduces the opportunities for soil moisture to be replenished through precipitation, leading to deteriorating soil moisture conditions. Moreover, rising temperatures significantly enhance potential evapotranspiration, causing rapid loss of soil moisture to the atmosphere34. As a result, crop root systems struggle to absorb sufficient water from the drying soil, hindering growth and accelerating the transition from meteorological drought to agricultural drought. Consequently, the alteration of the evapotranspiration process induced by temperature changes is a critical mechanism in the transformation of meteorological drought into agricultural drought25.
Additionally, surface air pressure plays an important role in drought propagation through its interaction with temperature. Changes in surface air pressure can modify atmospheric circulation patterns, influencing the direction and intensity of water vapor transport35. According to Yuan et al.36, surface air pressure and temperature jointly regulate the vapor pressure deficit, impacting atmospheric demand for moisture and subsequently influencing precipitation and evapotranspiration processes. When meteorological drought occurs, if changes in surface air pressure lead to an increased atmospheric demand for moisture while water vapor transport is insufficient, effective replenishment through precipitation becomes challenging37. This can result in the continued worsening of meteorological drought, gradually extending into the agricultural sector and further depleting soil moisture, thereby intensifying agricultural drought.
The synergistic effects of temperature and surface air pressure significantly amplify the influence on drought propagation, highlighting the urgent need for agricultural practices to mitigate the risks of drought transmission stemming from these two factors.
Based on the above results, while also referring to the data on agricultural distribution and phenology in China published by Luo et al.38 and Han et al.39, we have proposed the following drought mitigation and regulatory strategies for agricultural production in different regions in a tailored manner:
In arid regions, where drought-tolerant crops such as cotton and wheat are mainly grown, the growing season is short and droughts occur frequently. Considering that temperature and surface air pressure are critical factors influencing drought propagation, alongside the significant impact of precipitation, it is essential to strengthen the construction of water conservancy facilities and promote water-saving irrigation technologies such as drip irrigation7. Additionally, deep plowing practices should be adopted to improve soil’s water-holding capacity. It is also important to select and breed drought-tolerant crop varieties and to adjust cropping structures based on the availability of water resources26. Establishing a comprehensive monitoring system to provide early warnings of impending droughts is paramount. Furthermore, enhancing ecological restoration efforts is crucial for mitigating and managing the risks associated with linear drought propagation.
In semi-arid regions where crops such as wheat and corn are cultivated, precipitation patterns tend to be unstable19. Given the significant roles of surface pressure and soil moisture in drought propagation, it is highly advisable to utilize greenhouses to regulate air pressure during crop growth and to establish rainwater harvesting facilities for supplementary irrigation during drought periods. Additionally, the promotion of drought-tolerant crop varieties is essential, along with the implementation of crop rotation and fallowing systems. Agronomic practices, including deep plowing, should be adopted to enhance the water absorption capacity of the soil3. Moreover, a moderate development of facility agriculture can serve to mitigate the adverse effects of droughts, thereby ensuring more stable agricultural productivity.
In semi-humid regions with diverse crops, precipitation is unevenly distributed. Since runoff and soil moisture affect drought propagation, it is necessary to optimize the irrigation system for precise irrigation. Additionally, drainage systems should be enhanced to prevent droughts that may result from waterlogging. Strengthening soil moisture monitoring and promoting water-saving technologies are also critical26. Moreover, it is important to adjust the planting structure strategically to mitigate drought risks.
In humid regions where rice, fruits, and vegetables are primarily cultivated, precipitation is plentiful, yet droughts and floods often alternate14. Given that drought propagation is significantly influenced by meteorological factors and is subject to non-linear dynamics, it is essential to enhance the development of water conservancy projects to effectively balance flood control and drought resilience. Furthermore, the implementation of precision agriculture should be prioritized to facilitate targeted irrigation and fertilization practices. Improvements to farmland drainage and irrigation systems are also necessary. Additionally, emergency plans for sudden droughts should be established, and contingency water sources should be reserved to mitigate the risks associated with non-linear drought propagation26. Through these measures, we can effectively address drought risks and safeguard agricultural production and ecological health.
In the context of uncertainty analysis, the uncertainty present in the data product introduces a level of uncertainty into the results of this study40. Notably, a distinct causal link between temperature and P as well as PET is evident in both the ERA5-Land and CMFD datasets, with cross mapping skills exceeding 0.9 (Figs. S12-S13). This indicates that temperature plays a significant role in drought propagation.
To further assess the robustness of the model predictions, we incorporated multiple meteorological datasets, including Global Land Data Assimilation System (GLDAS) and Global Land Evaporation Amsterdam Model (GLEAM), alongside the original meteorological data used in this study, to conduct cross-validation experiments for the CCM model (Figs. S14–S19). The results indicate that by substituting the precipitation and potential evapotranspiration data from the CMFD dataset for the P and PET used in this study, as well as replacing the soil moisture data with precipitation data from the GLDAS and GLEAM datasets, similar outcomes were observed. Specifically, the convergent cross-mapping ability between P or PET and SM is notably higher in humid area compared to arid area (Causality error<0.085). This underscores the reliability of our study’s findings and the consistency and interchangeability of P and PET between the CMFD and ERA5-Land datasets in examining variable causality. Furthermore, in-situ observations have demonstrated that ERA5-Land performs well in simulating SM41, providing further support for the robustness of the results of this study.
Moreover, there are inherent uncertainties in drought indices for drought monitoring. Although the SPEI and SSMI selected for this research effectively characterize meteorological and agricultural droughts, respectively, their applicability varies across different regions in China, which spans multiple climatic zones. For instance, SPEI may not accurately reflect localized microclimatic differences, and its accuracy can be compromised in complex terrains where spatial variability of meteorological elements is significant14. Similarly, SSMI faces limitations in accounting for differences in vegetation root uptake of soil moisture. The efficiency of soil moisture utilization varies among different vegetation types and growth stages, which somewhat restricts the precision of SSMI in evaluating agricultural drought. Moreover, significant differences in soil texture and structure across various climatic regions can also influence the accuracy of SSMI in reflecting the true status of soil moisture7.
It is worth mentioning that only monthly data from 2000–2018 were utilized in this study. Though this sample length is sufficient for ensuring the robustness of causality detection42, the inherent lag effects associated with monthly scales in identifying drought processes may hinder real-time disaster risk assessment and mitigation, thereby limiting its potential social benefits. Utilizing drought indices with finer temporal resolutions can further enhance the accuracy of drought warnings. For example, the China Meteorological Administration employs a rolling 90-day window to calculate the SPEI on a daily basis, thus enabling more precise identification of the specific dates when drought conditions begin or end43,44,45. In fact, unlike traditional drought dynamic monitoring, the primary objective of this study is to explore the intrinsic connections between meteorological drought and agricultural drought by constructing a causal chain. By investigating the driving factors that influence the propagation between these two forms of drought, we aim to provide theoretical guidance for drought prevention and mitigation in agricultural production. The approach we propose demonstrates broad applicability, and the future use of longer time series and higher temporal resolution datasets will undoubtedly enhance the credibility of the identified drought propagation patterns, while also facilitating the exploration of their dynamic changes.
Furthermore, it is recognized that additional factors like vapor pressure deficit (VPD) and groundwater storage may also play an important role10,46. The current causality chain’s exclusion of these factors could limit its ability to capture all drought propagation patterns. Future research could consider incorporating a more extensive and nuanced causality chain, incorporating additional relevant variables. This would offer a deeper understanding of drought propagation’s complexity, revealing potential patterns and providing a stronger scientific foundation for further exploration.
In summary, this study constructed a causality chain for drought propagation, aiming to elucidate the mechanisms and processes involved. The results were encouraging, indicating that the causality chain effectively captured the nonlinearities of drought propagation across diverse areas. It was revealed that the time of meteorological-agricultural drought propagation in China typically spans around 2 months, with an average DPCs of approximately 25 occurrences, showing peer-to-peer drought propagation overall. Five key variables (i.e., P, Temp, PET, SM and D) are fundamental to understanding the impact of drought propagation and offer intuitive insights into its pathways29. Among these factors, temperature stands out as the predominant driving factor for drought propagation, with temperature and surface air pressure explaining over 50% of the instances of drought propagation.
The CCM method demonstrates potential applications in detecting nonlinear drought propagation, revealing significantly stronger drought propagation in humid area compared to arid area. This disparity arises from the nonlinear causality of SM in humid area on P and PET, which is nearly twice as pronounced as in arid area. More interestingly, moving from arid to humid area, nonlinear drought propagation increases by nearly 1.5 times, while linear propagation remains minimally affected by dry-wet conditions. As the wetness of the area increases, the nonlinear propagation of meteorological drought to agricultural drought will gradually increase and linear propagation will gradually decrease. The natural moisture conditions within watersheds emerge as the primary factor causing differences in the frequency and intensity of drought propagation, especially in water-stressed area. By comprehensively examining the characteristics and mechanisms of drought propagation, this study provides valuable insights for drought prevention and mitigation in agricultural production.
Methods
Data sources
ERA5-Land is a high-precision reanalysis dataset, which is generated through the land component of the enhanced resolution European Centre for Medium-Range Weather Forecasts (ECMWF) ERA5 climate reanalysis, the data utilizes the laws of physics to combine the model data with observations from around the world, resulting in a globally complete and consistent dataset47 (http://cds.climate.copernicus.eu). With a resolution of 0.1°, monthly total precipitation (P), potential evapotranspiration (PET), volumetric soil water layer (0–7 cm) (SM), runoff, 2 m temperature, 10 m u-component of wind (U10), 10m v-component of wind (V10), evaporation from vegetation transpiration (Evavt), and surface pressure (Pres) data from 2000–2018 was used in the study. All data are cropped to China region.
China Meteorological Forcing Dataset (CMFD, available at https://westdc.westgis.ac.cn/) is a high-precision dataset for land surface modelling in China48. The near-surface air temperature, downward shortwave radiation, downward longwave radiation, precipitation rate, and near-surface air-specific humidity from 2000 to 2018 were used in this study, and based on these data PET was calculated with reference to Yang et al.49. All data have a spatial resolution of 0.1°.
Normalized Difference Vegetation Index (NDVI) is one of the most commonly used remote sensing indexes for vegetation research. NDVI from 2000-2018 for MOD13Q1 of Moderate Resolution Imaging Spectroradiometer (MODIS) was used in the study, and it has a spatial resolution of 250 m and is provided as a 16-day composite, the data was processed into monthly data using monthly maximum synthesis, resampled with a resolution of 0.1° and cropped to China.
Convergent cross mapping
Convergent Cross Mapping (CCM) based on Taken’s theory50 has demonstrated considerable efficacy in discerning causal relationships within time series of complex systems41. CCM represents an innovative approach for detecting causality in nonlinear dynamical systems. In the context of CCM, causal relationships are ascertained by quantifying the extent to which the historical records of a time series in one variable reliably estimate the state of another variable. Notably, CCM goes beyond traditional causal analysis methods by distinguishing between bidirectional and unidirectional causal relationships. The steps involved in CCM are shown in Fig. 8.
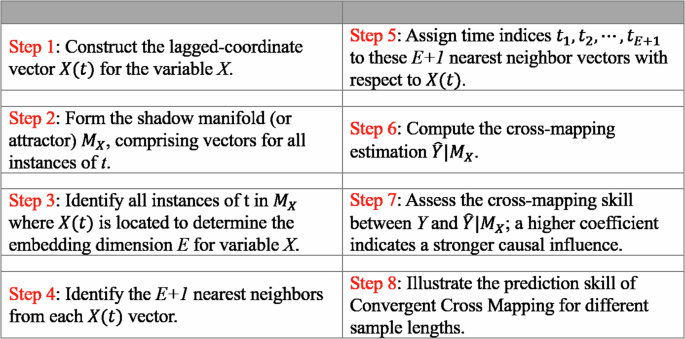
A schematic framework and steps of CCM method.
In this study, CCM was used to detect drought nonlinear propagation tracks. This model tests the causality relationship among the variables involved in the chain, analyzing the propagation path of drought among meteorological variables. The calculation of CCM was by rEDM and mutispatialCCM package in R, for more information, please refer to Sugihara et al.51 and Clark et al.42.
Different drought indexes
(1) SPEI and SSMI
The Standardized Precipitation Evapotranspiration Index52 (SPEI) and the Standardized Soil Moisture Index53 (SSMI) are commonly used to characterize meteorological and agricultural drought.
SPEI considers both P and potential PET, effectively reflecting meteorological drought conditions and accurately characterizing the impact of changes in meteorological conditions on drought. Its applicability is widespread across various climatic regions in China. In arid and semi-arid areas, where precipitation is scarce and evapotranspiration is high, SPEI clearly demonstrates the degree of moisture deficiency. In contrast, in semi-humid and humid regions, despite relatively abundant precipitation, SPEI is adept at capturing signs of drought when precipitation distribution is uneven14.
Conversely, SSMI utilizes SM as its input. Given that soil moisture is a critical factor affecting crop growth, SSMI holds significant significance for agricultural drought monitoring. Its applicability is evident across different climatic regions. In arid and semi-arid zones, where soil moisture is already limited, SSMI can intuitively reflect subtle changes in soil moisture levels. Meanwhile, in semi-humid and humid areas, where soil moisture is subject to substantial fluctuations due to precipitation and evaporation, SSMI is effective in tracking trends in soil moisture variation14,53.
The calculation methods for these drought indexes are based on the mathematical algorithm of the Standardized Precipitation Index (SPI), incorporating a normal quantile transformation to standardize the indices for temporal and spatial comparability. Similar to SPI, both SPEI and SSMI can be computed at multiple time scales to represent the cumulative drought severity over a predefined period. In this study, SPEI and SSMI are computed at each grid point using log-logistic and gamma distribution54. The study selected SPEI at time scales ranging from 1 month to 12 months (SPEI1-SPEI12), as well as SSMI at a 1-month time scale (SSMI1), to calculate the propagation time and intensity from meteorological drought to agricultural drought. Additionally, the time scale of SPEI that exhibits the most significant correlation with agricultural drought was chosen to construct the causal chain of propagation. Detailed methodologies are described in the subsequent sections. The computation of SPEI and SSMI employs the SPEI package in R, with specific calculations following the methodology outlined by Vicente-Serrano et al.52.
In the study, SPEI and SSMI identify drought and classify drought levels based on indicator values (Table S1). Since moderate and extremely droughts are of great concern, they are the primary focus in this study. For this study, the drought discrimination threshold is set at -1.
(2) Aridity Index
To investigate the dependency of SM on dry-wet conditions under varying climatic conditions, climate classification utilizes the Global Aridity Index (AI) provided by the Consultative Group on International Agricultural Research – Consortium for Spatial Information55 (CGIAR-CSI) (http://www.cgiar-csi.org). The calculation formula for AI is as follows:
where ({MAP}) is the mean annual P, and ({MAE}) is the mean annual PET. According to the United Nations Environment Programme56 (UNEP), there are five climate classes: hyper-arid (AI < 0.03), arid (0.03 < AI < 0.2), semi-arid (0.2 < AI < 0.5), semi-humid (0.5 < AI < 0.65), and humid (AI > 0.65). To gain a deeper understanding of the mechanisms of drought propagation and the reasons for regional disparities, China has been categorized into distinct areas based on AI, including humid, semi-humid, arid, and semi-arid area57. Additionally, regions with annual precipitation of less than 200 mm are typically classified as permanently arid areas, where meteorological droughts are often absent. In China, the 200 mm precipitation iso-line is frequently regarded as the boundary between arid and semi-arid regions. Through comparisons conducted in this study, the drought zones delineated by precipitation align closely with those identified by AI. Numerous studies have indicated that these areas are also prone to frequent meteorological drought events29,46. Therefore, to ensure the comprehensiveness of the research area and the thoroughness of the analysis, this study includes these permanently arid regions as part of the research subjects.
Drought propagation time, counts and intensity
(1) Drought propagation time (DPT)
In essence, a higher correlation coefficient indicates a stronger connection between different types of droughts58. Therefore, the linear propagation relationship of droughts can be characterized using correlation coefficients46,59. The maximum Pearson correlation coefficient (MPCC) method was verified to effectively show the differences in response intensity and time among different drought types60,61,62. This method effectively assesses the linear propagation intensity and time of droughts, commonly considering the maximum correlation coefficient as linear drought propagation intensity and the time scale of the maximum correlation coefficient as linear DPT, and will be used to describe the linear propagation of meteorological drought and agricultural drought in this study. The formulas are as follows:
where i represents the time scale, ({{SPEI}}_{i}) represents the SPEI at time scale (i)-month, ({{SSMI}}_{1}) represents the SSMI sequence at one-month time scale, ({R}_{i}) represents the Pearson correlation between ({{SPEI}}_{i}) and ({{SSMI}}_{1}) time series, (max {{(R}_{i})}_{{scale}}) denotes the time scale corresponding to the maximum value of ({R}_{i}), and ({{Time}}_{{propagation}}) represents DPT.
(2) Drought propagation counts (DPCs)
Given that this study focuses on moderate and extreme drought, following the definitions of SPEI and SSMI, SPEI < -1 and SSMI < -1 was considered as criteria for drought identification. Besides, since the DPT is nearly within six months for most areas nationwide, drought propagation was defined within six months as effective propagation. Following the method above, DPCs was computed from 2000-2018.
(3) Drought Intensity Propagation Index (DIP)
Drought propagation intensity is an attribute of regional drought characteristics, serving as a quantitative parameter to express the specific propagation process of drought features between two types of drought. It signifies the drought transformation efficiency, specifically the degree to which meteorological drought intensity propagates to agricultural drought intensity. The fundamental assumption is that, under ideal conditions, the propagation of meteorological drought to agriculture drought occurs in a point-to-point manner, meaning that agricultural drought is solely influenced by meteorological drought and provides feedback to it. In this scenario, the intensity and duration of both types of drought are consistent, resulting in a ratio close to 1. However, in reality, the propagation of meteorological drought to soil drought is influenced by numerous factors, causing this ratio to often deviate from 129. To describe the process and intensity of the propagation from meteorological drought to agricultural drought, DIP was employed to quantify the extent to which meteorological drought intensity propagates to agricultural drought intensity29. The calculation formula for DIP is as follows:
where ({DIP}) is drought intensity propagation index, n is the timespan of meteorological drought propagates to agricultural drought. Numerically, n is equivalent to the propagation time (DPT) of meteorological drought to soil drought at the grid point. ({{SI}}_{{SSMI}1-{Ln}}) signifies the average value of the drought sequence in the one-month scale SSMI series, while ({{MI}}_{{SPEIn}-{Ln}}) represents the average value of the drought sequence in the n-month SPEI series. DIP in the range of [0.9, 1.1) indicates peer-to-peer propagation, DIP greater than 1.1 indicates strong propagation, and less than 0.9 indicates weak propagation.
Explainable machine learning
Extreme Gradient Boosting (XGBoost) is an algorithm based on Gradient Boosting Decision Tree (GBDT), aiming to enhance the speed and predictive capabilities of gradient boosting decision trees. It utilizes a second-order Taylor series to approximate the cost function and incorporates regularization terms into the objective function. The foundational knowledge behind the mechanism and implementation of XGBoost can be found in Chen and Guestrin63 and Bentéjac et al.64. Previous drought studies have achieved successful results by employing XGBoost to predict meteorological indicators65,66. The predict skill of the XGBoost was employed in this study to quantify the contribution of each variable to drought propagation combined with the SHAP explainer.
Shapley Additive explanations (SHAP) is a machine learning interpretability method that provides a unified interpretability approach by combining elements from additive feature attribution methods with Shapley values as a measure of feature importance67,68. The interpretation of SHAP values is straightforward: the larger the absolute SHAP value, the more significant the contribution of that feature to the model prediction, with negative (positive) SHAP values indicating negative (positive) impacts on the prediction process.
In this study, SHAP values are calculated on the XGBoost model, which performs optimally in predicting drought propagation effects, using a tree explainer69,70. Two XGBoost models was established by employing DPCs and DIP as the target variables. P, PET, SM, runoff, 2 m temperature, U10, V10, Evavt, and Pres were designated as feature variables to predict the target variables. The SHAP interpreter was employed for elucidating the outcomes.
Selection of factors and uncertainties analysis
For the selection of driving factors of drought propagation, it is noted that the process of meteorological drought evolving into agricultural drought is triggered by the disruption of the water budget imbalance, which is a consequence of the water exchange between land and the atmosphere. This process concurrently results in a decrease in soil moisture (SM), ultimately evolving into agricultural drought. Temperature plays a significant role in this process, as it significantly enhances regional evapotranspiration49. Additionally, in the absence of regional water vapor considerations, high temperatures elevate Vapor Pressure Deficit71 (VPD), further reducing the likelihood of rainfall occurrence. Consequently, temperature can be considered a driving factor in drought propagation72.
Certainly, it is crucial to take into account the uncertainty of causality which is related to different factors and datasets. The ERA5-Land is a complete high-precision reanalysis dataset, which was used for analysis in this study because it contains a complete set of variables and has performed well in drought studies73,74,75. However, as a causal monitoring method, CCM have considered the uncertainties of the results introduced by the method in its description of the significance, but it does not include errors in the data product itself, which can lead to uncertainty in the results. More importantly, ERA5-Land is a model-generated reanalysis dataset with established data linkages between the variables themselves, so for the natural laws revealed by the causality in this study, it was necessary to verify the robustness of the results using other datasets. Therefore, P and PET from CMFD (China Meteorological Forcing Dataset) was used to verified the results of this study.
Study framework
Figure 9 presents the framework of the study. Based on ERA5-Land dataset, this study aims: (a) to analyze the characteristics of drought propagation in China; (b) to analyze the driving factors and regional differences in nonlinear drought propagation in China, (c) to verified the robustness of the results based on CMFD dataset, and (d) to examine the influencing factors of drought propagation.
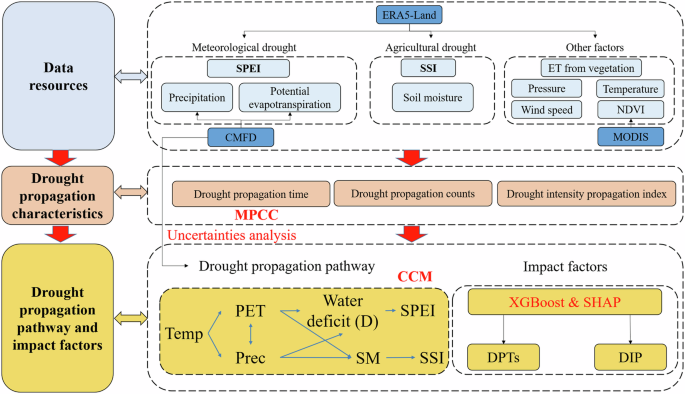
This research involves three steps: data processing, the construction of drought propagation characteristic indices, and the exploration of drought propagation pathways and their driving factors. The calculation formulas of the relevant indices and the underlying principles of the methods that appeared in the figure have been detailed in the previous sections.
")

Responses